EIA’s Electric Power Monthly – December 2018 Edition with data for October
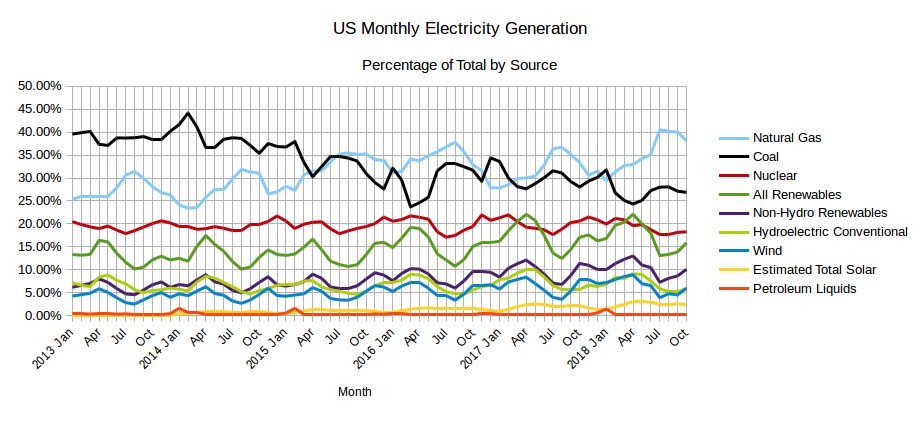
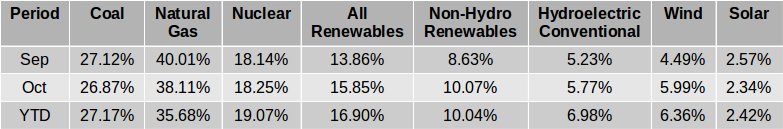
The EIA released the latest edition of their Electric Power Monthly on December 26th, with data for October 2018. The table above shows the percentage contribution of the main fuel sources to two decimal places for the last two months and the year to date.
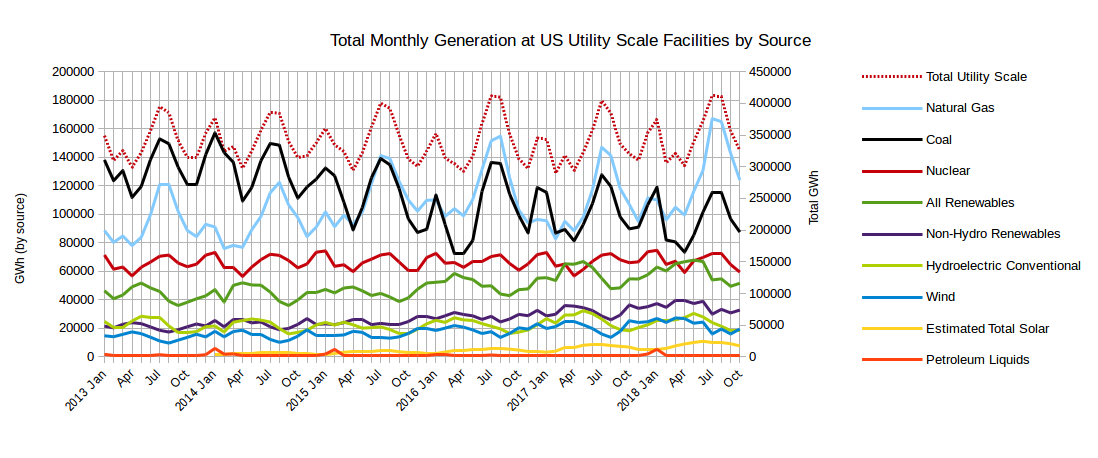
In October, as usual for this time of the year, the absolute amount of electricity generated continued to decline with the mid summer demand for air conditioning falling away further. Coal and Natural Gas between them, fueled 64.98% of US electricity generation in October, with the contributions from most other major sources edging up slightly. The contribution from Natural Gas was down at 38.11%, from 40.01% in September, with the amount generated falling from 142,745 GWh to 124,027 GWh. Generation fueled by coal declined from 96,743 Gwh to 87,452 GWh resulting in the percentage contribution falling from 27.12% to 26.87%. The amount of electricity generated by Nuclear plants decreased from 64,725 GWh to 59,397 GWh with the resulting contribution actually rising very slightly from 18.14% to 18.25% in October. The amount generated by conventional hydroelectric increased from 18,663 GWh in September to 18,779 GWh in October with resulting contribution increasing to 5.77% as opposed to 5.23% in September. The amount generated by wind increased from 16,022 GWh to 19,507 GWh with the resulting contribution rising from 4.49% to 5.99% in September. The estimated total solar output fell from 9,153 GWh to 7,625 GWh with the resulting contribution falling from 2.57% to 2.34%. The contribution of zero carbon or carbon neutral sources rose from 32.01% in September to 34.10% in October.
The graph below shows the absolute production from the various sources as well as the total amount generated (right axis).
…click on the above link to read the rest of the article…