Quantifying wind surpluses and deficits in Western Europe
This post updates my January 2015 Wind blowing nowhere post using 2016 rather than 2013 data. The 2016 data show the same features as the 2013 data, with high and low wind conditions extending over large areas and a decreasing level of correlation with distance between countries. The post also quantifies the surpluses and deficits created by high and low wind conditions in January 2016 in gigawatts. The results indicate that wind surpluses in Western European countries during windy periods will be too large to be exported to surrounding countries and that wind deficits during wind lulls will be too large to be covered by imports from surrounding countries. This casts further doubt on claims that wind surpluses and deficits in one region can be offset by transfers to and from another because the wind is always blowing somewhere.
2016 Wind Generation:
The wind and other data used in this post are from the P-F Bach data base used in “wind blowing nowhere”. Three of the countries for which 2013 data were available – Finland, Ireland and Belgium – have no 2016 data, but three countries that had no 2013 data – Norway, Sweden and the Netherlands – do. As a result we now have a contiguous block of nine countries that extends from Gibraltar to North Cape, a distance of 4,400km, and which has a width of up to 1,900 km (Figure 1). The total area covered by the nine countries is 2.66 million sq km:
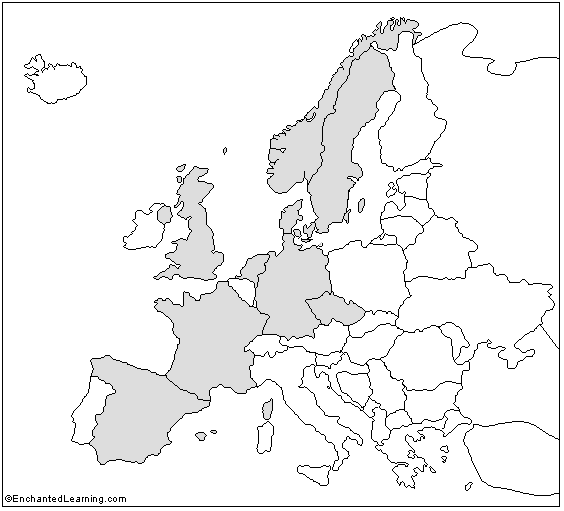
Figure 1: Countries with 2016 wind generation data
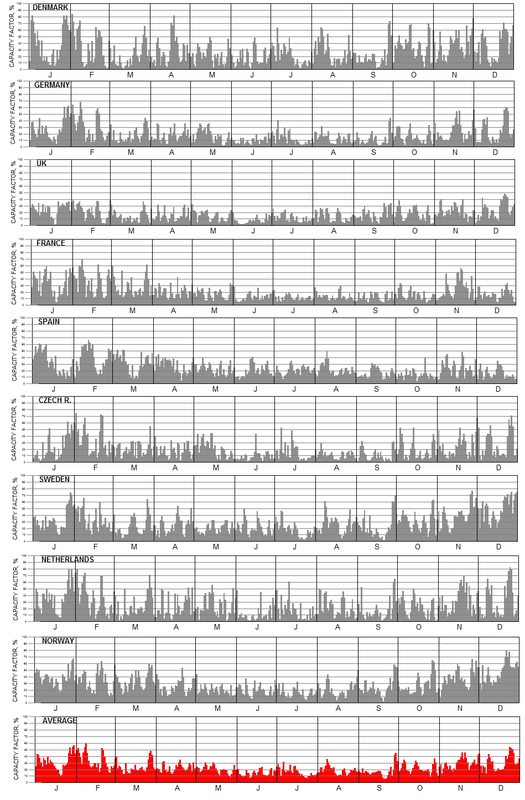
Wind capacity factors by country are shown in Figure 2 (click to enlarge). Capacity factors instead of actual generation values are plotted to avoid swamping countries with low levels of wind generation with generation from large producers, and daily rather than hourly data are shown for readability. Capacity factors are adjusted for capacity additions during the year:
…click on the above link to read the rest of the article…