World Oil Output Last 3 Years
The EIA publishes every possible energy stat for the USA and hardly anything for the rest of the world. Well, anything current for the rest of the world anyway. TheirInternational Energy Statistics is already five full months behind and working on six. December 2014 is the last international oil production data we have.
Anyway during this lull in other data I decided to look at the last three years of international data, from December 2011 to December 2014. All data is in thousand barrels per day.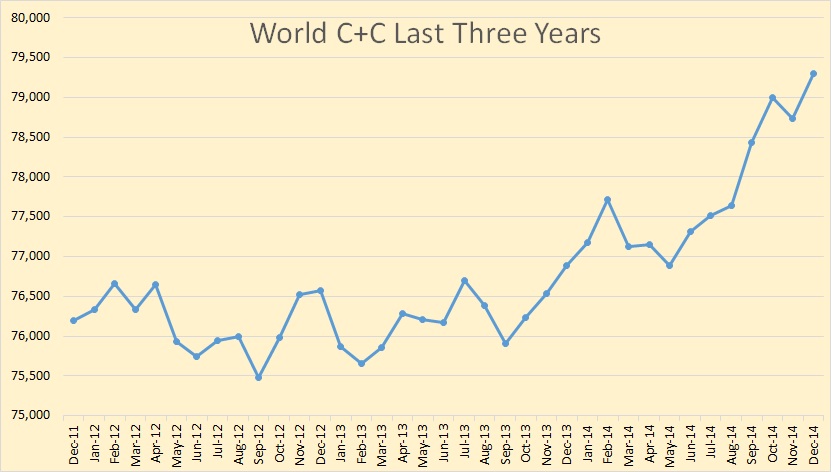
World C+C production was flat for most of 2012 and 2013 but in late 2013 production took off and has increased by about 3 million barrels per day above the average for 2012 and 2013. December C+C production was 79,300,000 BPD.
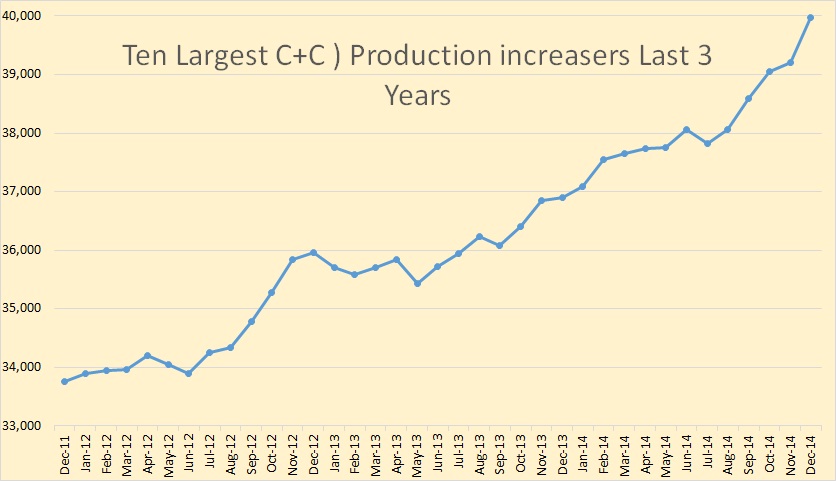
While total C+C production has increased by 3,000,000 BPD over the last three years the top ten gainers have increased just over twice as much, 6,200,000 BPD.
And just who were the big C+C production increasers for the last three years. Keep in mind this is the total change, or increase, over the last three years, not total production.
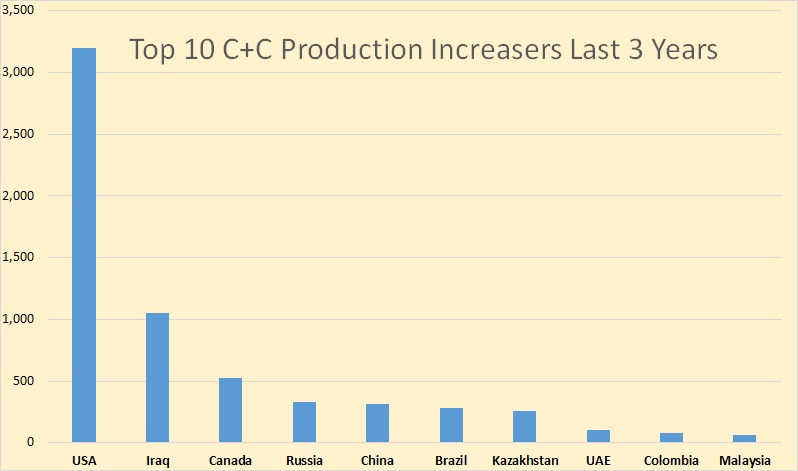
The largest gainer, by a wide margin, was the USA. Iraq and Canada were runners up and the rest were also rans.
Almost everyone else had declines.
…click on the above link to read the rest of the article…