U.S. Government Historical Debt
Chart of the Week #7
Over the years, meeting people from all walks of life, I’ve noticed something: when you bring up the massive U.S. debt that’s starting to take over our whole economy, some just shrug and say, “Well, the U.S. has always had a ton of debt — it’s just how things are, nothing to be too surprised about.”
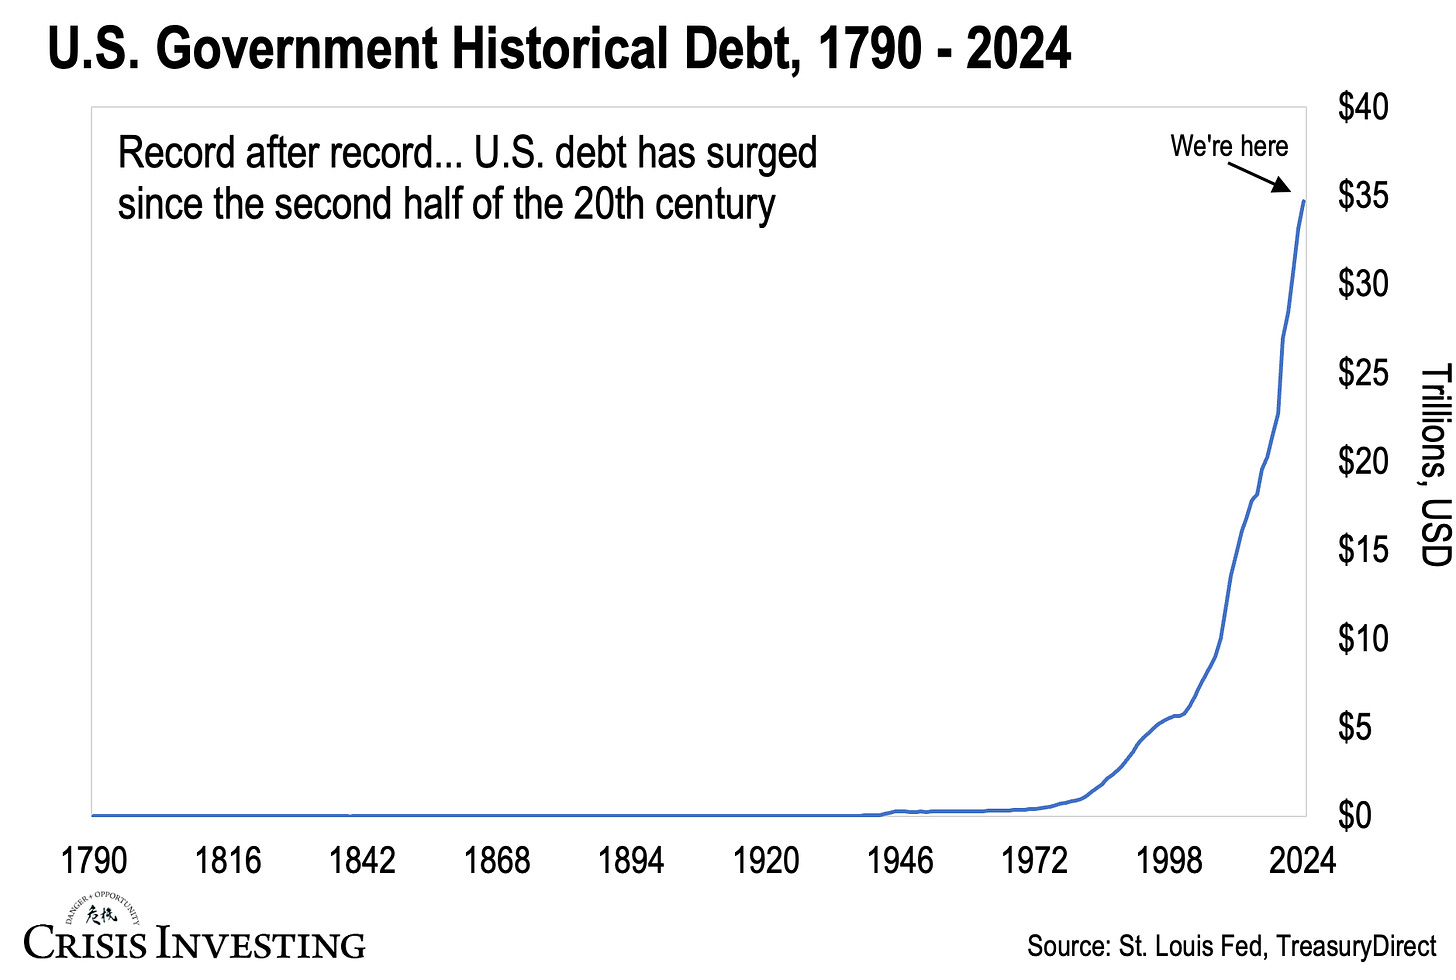
When I come across this line of thinking, I like to whip out the following chart. Take a look. It shows the U.S. government’s debt since 1790.

What you’ll notice right away is that government debt was pretty much nonexistent from the early days of our country until about halfway through the 20th century.
But this situation changed in the second half of the century, first gradually and then alarmingly. This happened with the expansion of federal government spending under Presidents Franklin D. Roosevelt, Lyndon B. Johnson’s, Richard Nixon. And debt just kept snowballing since.
That said, President Biden really took it to levels we hadn’t seen before.
In the years since taking office in 2021, Biden went on a trillion-dollar spending spree with stimulus projects like the American Rescue Plan, the Infrastructure Investment and Jobs Act, and the Inflation Reduction Act.
The unmistakable result of such policies is the current national debt standing at $34.8 trillion — more than a quarter-million dollars for every household — compared to “just” $27.8 trillion in 2021.
Come to think of it… “standing” may not be the best word. The U.S. government debt never stands still; it grows relentlessly with every passing moment. Here’s a link if you want to watch it go up live, but be warned, it’s quite disturbing.