US October Oil Production Pushed Higher by New Mexico
All of the Crude plus Condensate (C + C) production data for the US state charts comes from the EIAʼs December Petroleum Supply monthly PSM which provides updated information up to October 2022.
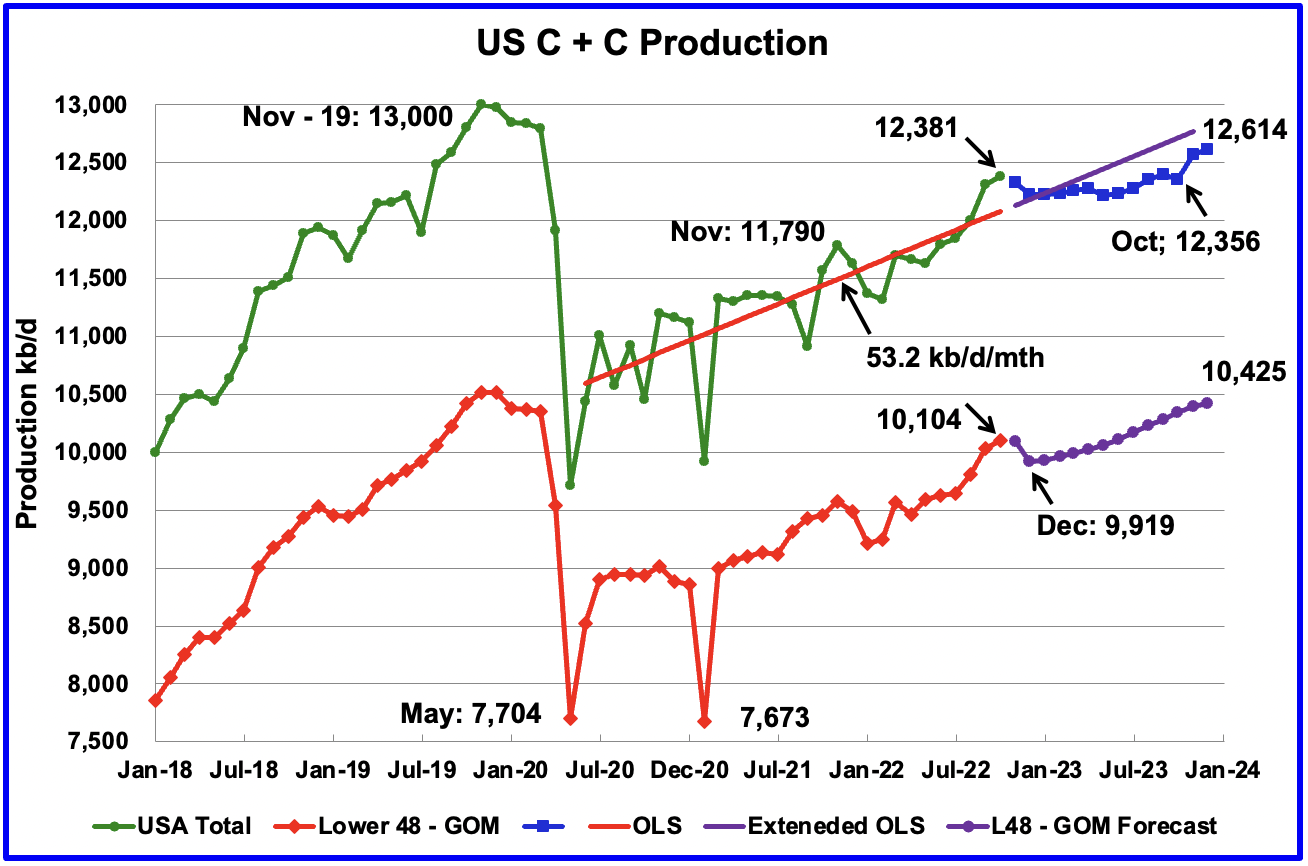
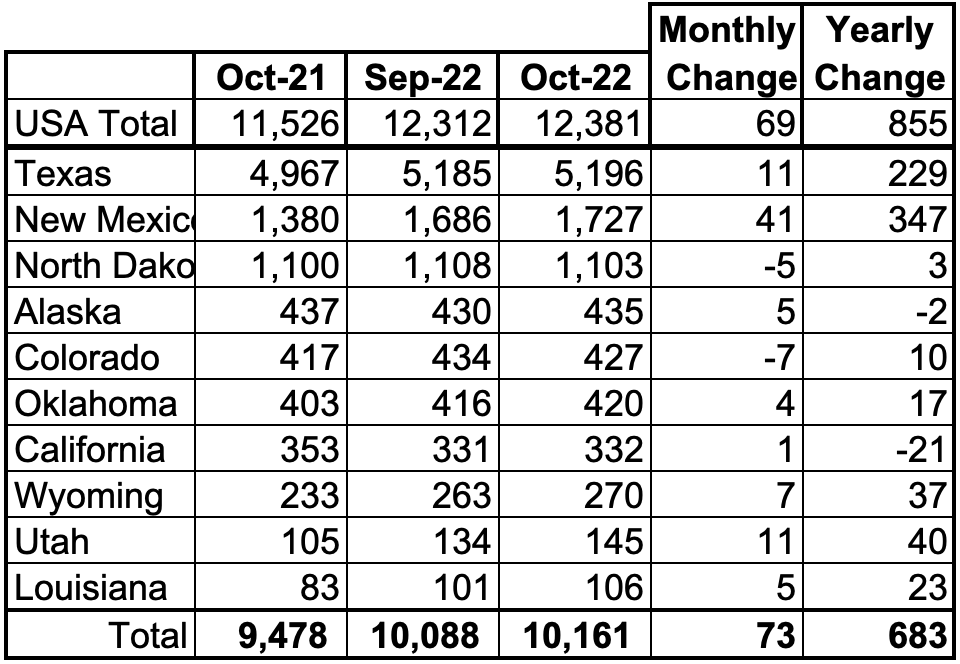
U.S. October production increased by 69 kb/d to 12,381 kb/d to a New post pandemic high. It should be noted that September’s oil production increase of 289 kb/d to 12,268 kb/d which was reported last month and was considered high, was revised further up by 44 kb/d to 12,312 kb/d in the current October report. For September, the state with the largest increase was New Mexico 41 kb/d, along with a number of small increases from the smaller producing states.
While overall US oil production increased, a clearer indication of the health of US production can be gleaned by looking more closely at the Onshore L48 states. In the Onshore L48, October production increased by 69 kb/d to 10,104 kb/d. This means that 100% of the increase in US production came from the Onshore L48.
The blue graph, taken from the December 2022 STEO, is the production forecast for the U.S. from November 2022 to December 2023. Output for December 2023 is expected to be 12,614 kb/d, 34 kb/d higher than reported last month.
Note that production in October 2023 is forecast to be lower than in October 2022. The flatness in overall US output up to October 2023 is because the production increase in the Onshore L48 of 506 kb/d from December 2022 to December 2023 is offset by declining production in the GOM. See GOM chart further down.
The red OLS line from June 2020 to October 2022 indicates a monthly production increase of 53.2 kb/d/mth over that period. The first portion of red line stops at October because that is the range covered by the OLS analysis. The second portion is the same OLS line extended to see how well it fits the STEO forecast.
Oil Production Ranked by State
…click on the above link to read the rest…