The EIA’s Questionable Numbers
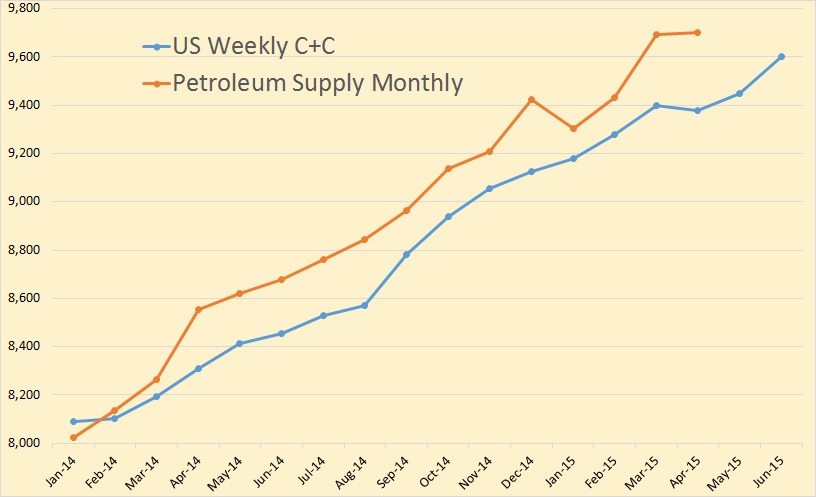
I averaged the weekly numbers and converted them to monthly data. They were pretty close for the first three months of 2014 but then they begin to diverge. Of course they were much closer earlier but in the Petroleum Supply Monthly has, over several months, been revised upward. The Weekly Petroleum Status Report is never revised.
In April, the Petroleum Supply Monthly shows US C+C production 322,000 barrels per day above the weekly average of the Weekly Petroleum Status Report.
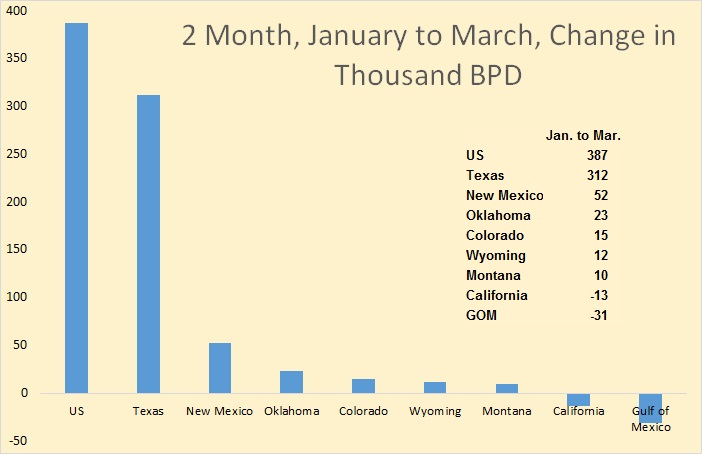
The Petroleum Supply Monthly shows US production increased 387,000 barrels per day in the two months January to March. That is an increase when oil rigs were being stacked by the dozens. They show Texas up 312,000 over those two months and New Mexico up 52,000 bpd. That means they think the Permian, which is mostly in Texas but partly in New Mexico, was really booming during those two months.
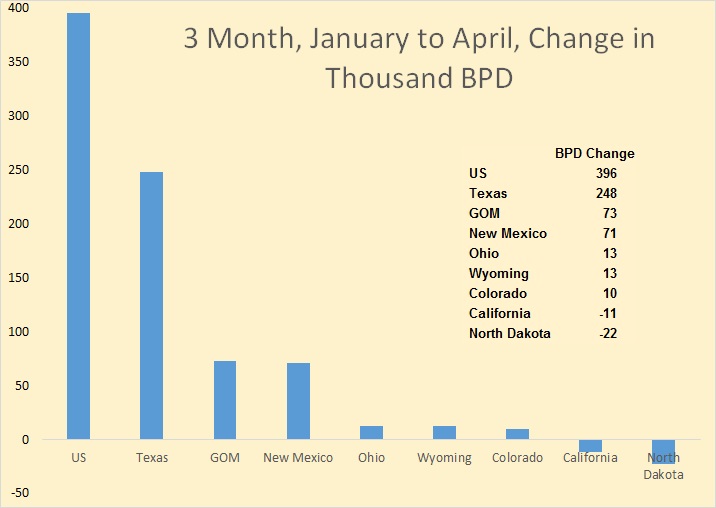
The EIA has crude production continuing to climb during April, up 396,000 bpd January to April. The Gulf of Mexico, which had been down slightly the previous three months, was shown up 104,000 in April, giving them a gain of 71,000 bpd over the three months.
But obviously Texas is where all the action is.
…click on the above link to read the rest of the article…