Texas Oil and Gas Production Declining
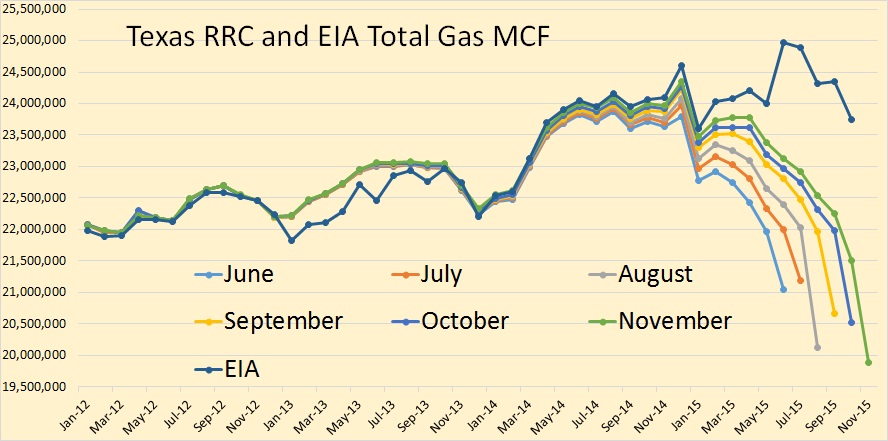
All RRC data is through November 2015 but the EIA data is only through October. The oil data is in barrels per day.
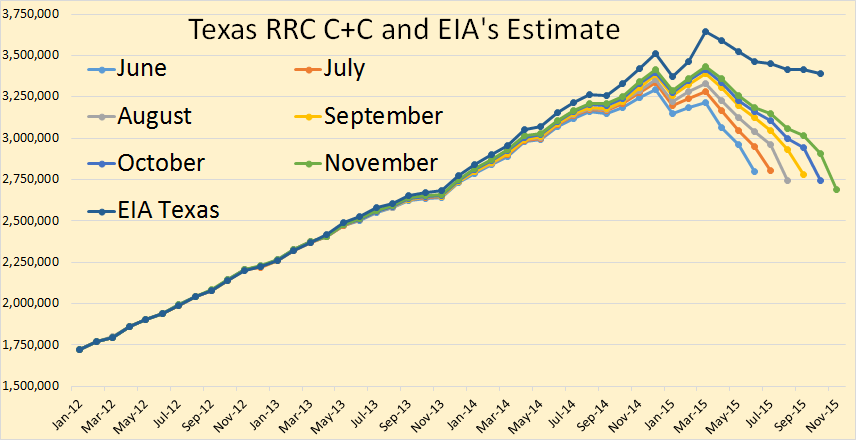
The trend is definitely down. The scale makes it difficult to gauge the month to month change but I have the exact month to month change here in barrels per day. Of course this only gives you a general idea of what is happening. The final change could be either less or greater than the numbers indicate here. But the EIA data should be very close.
Jun. to Jul. 7,245
Jul. to Aug. -63,827
Aug. to Sep. 34,507
Sep. to Oct. -33,486
Oct. to Nov. -52,802
Jun. to Nov. -108,363
EIA Dec. to Oct. -121,000
Dr. Dean Fantazzini has developed an algorithm that gives a very close estimate of what the final data will look like. His data and the EIA data track each other pretty close.
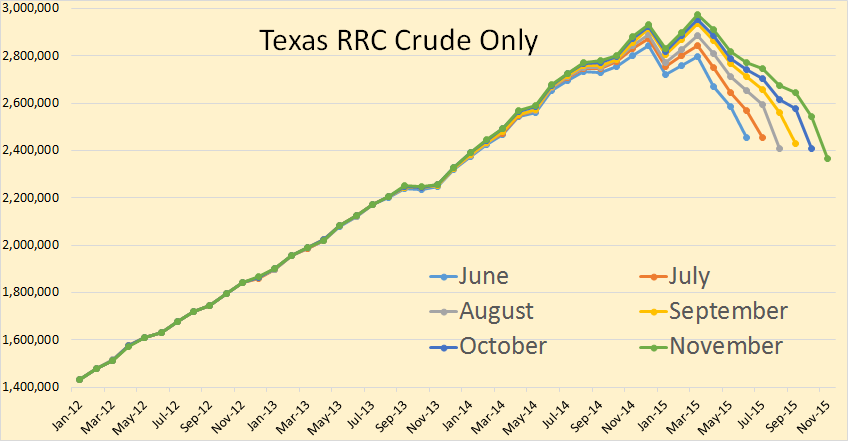
Crude only has had the lions share of the decline, the incomplete data is down 91,000 bpd since June.
Dr. Dean Fantazzini’s corrected data indicates that crude only will actually be down about what the incomplete data indicates.
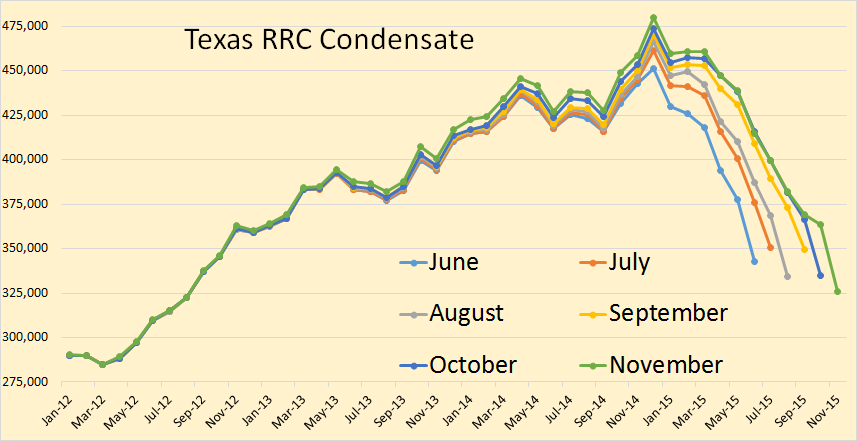
Condensate shows a slightly more erratic decline, down 17,000 bpd since June.
And Dean’s condensate chart disagrees slightly with what I would estimate. He has condensate up in October where the RRC incomplete data has it down.
…click on the above link to read the rest of the article…