Home » Posts tagged 'market crash' (Page 6)

Tag Archives: market crash

Olduvai
Click on image to purchase

Olduvai III: Catacylsm
Click on image to purchase

Post categories

Post Archives by Category

Blain: “Here’s Why This Gets Worse Before It Gets Better”

Wobble continues. Does a Correction morph into a Crash?

“They would never evolve. They shouldn’t have survived.…. Evolution was something that happened to other species..”

Not looking like a positive morning out there. Stocks are down 10% – so officially it’s a correction! Markets are still wobbling. Folk who thought they’d survived Monday’s carnage intact are new beginning to wonder if they should press the panic-button, or pull the dump-lever just in case this gets worse and liquidity dries up. The US has managed to shut itself down again. Our best hope at the Winter Olympics has broken her heel. If this all feels sickeningly familiar – Welcome to 2008 Part 2. Market wobbles, you heave a sigh of relief, and then it pukes massively all over you.

Early this morning it was raining. A storm is coming. And I must have dropped my wallet after paying for a Taxi early this morning.

My gut feel – based on active participation in every single market Donnybrook/Stamash since 1987 – is this gets worse before it gets better. And that’s a good thing – because this is when the great opportunities present themselves!! Cry Havoc and unleash the brokers…

But first we need to talk about my wallet. I appreciate most of you are more concerned with markets than my wallet, but does Life care? Losing my wallet is probably far less worse than will happen to most folk. Yet, its illustrative of something: I called my Amex card to cancel. Lots of help, new card with me early next week. Called my bank. Lots of unhelpful questions and the impression I was the 10 thousandth idiot to a lost my wallet this morning. Sympathy? Look for it in a dictionary is the best advice. New card after 6 business days? Perhaps.

…click on the above link to read the rest of the article…

Steve Keen: “Why Did It Take So Long For This Crash To Happen?”

As originally written at RT, outspoken Aussie economist Steve Keen points out that everyone who’s asking “why did the stock market crash Monday?” is asking the wrong question; the real question, Keen exclaims, is “why did it take so long for this crash to happen?

The crash itself was significant – Donald Trump’s favorite index, the Dow Jones Industrial (DJIA) fell 4.6 percent in one day. This is about four times the standard range of the index – and so according to conventional economics, it should almost never happen.

Of course, mainstream economists are wildly wrong about this, as they have been about almost everything else for some time now. In fact, a four percent fall in the market is unusual, but far from rare: there are well over 100 days in the last century that the Dow Jones tumbled by this much.

Crashes this big tend to happen when the market is massively overvalued, and on that front this crash is no different.

It’s like a long-overdue earthquake. Though everyone from Donald Trump down (or should that be “up”?) had regarded Monday’s level and the previous day’s tranquillity as normal, these were in fact the truly unprecedented events. In particular, the ratio of stock prices to corporate earnings is almost higher than it has ever been.

More To Come?

There is only one time that it’s been higher: during the DotCom Bubble, when Robert Shiller’s “cyclically adjusted price to earnings” ratio hit the all-time record of 44 to one. That means that the average price of a share on the S&P500 was 44 times the average earnings per share over the previous 10 years (Shiller uses this long time-lag to minimize the effect of Ponzi Scheme firms like Enron).

…click on the above link to read the rest of the article…

ECB “In Touch With Market Participants” Over Market Crash; White House “Concerned”

In a double whammy of panic about the fate of the artificial “wealth effect” created thanks to $20 trillion in central bank liquidity, officials at both the White House and Europe’s largest hedge fund expressed concerns about the market rout that saw the Dow suffer its biggest point drop in history.

According to Bloomberg, ECB staff “have been in contact with market participants over the current selloff in stocks to gauge if there is any risk to financial stability.”

As Bloomberg adds, the latest communications are part of the ECB’s regular interactions with financial institutions and the central bank isn’t yet overly concerned by the global equity rout. The underlying assumption is that “it’s simply a correction because valuations may have become overstretched.”

Of course, if the VIX explosion continues, the ECB will be far more worried.

As a result, staff are “watching for signs the downturn might enter a self-reinforcing spiral or spread from equities to bonds.”

One worry is that the selloff was triggered by strong U.S. economic data that led to expectations of faster interest-rate increases, a symptom that financial markets are still  relying on monetary support, one of the people said.

Meanwhile, across the Atlatnic, White House Spokeswoman Mercedes Schlapp said on Fox that “obviously we’re concerned about setbacks that happened in the stock market” however, she was quick to hedge that “with that being said, we’re looking at the long term strong economic fundamentals.”

Seeking to distance the White House from Trump’s relentless boasting about every uptick and sudden silence now that stocks have crashed, she instead decided to sound like your typical, worthless sellside analyst, and said that people should focus on “improving fundamentals” instead:

…click on the above link to read the rest of the article…

So What Do I Think about the “Crash” in Stocks?

So What Do I Think about the “Crash” in Stocks?

A lot more will have to happen before this turns into a crash; and markets are not there yet.

With all this wailing in the media about stocks, you’d think there’s at least some blood in the streets. But no. Not a drop.

The Dow fell 4.6% today to 24,345. This 1,175-point drop, as it was endlessly repeated, was the biggest point-drop in history – but irrelevant given how relentlessly inflated the industrial average had become. The percentage drop today, combined with the drops of last week, took the Dow down just 8.5% from its all-time high on January 26.

For the year, the Dow is down merely 1.5%. I mean, what horror. The last time this sort of debacle happened was way back in ancient history of January and early February 2016.

The Dow is not even in a correction (defined as -10% from its recent high). But that messy Friday and Monday, following a record 410-day streak without a 5% decline, did break the recently pandemic illusion that you cannot lose money in stocks.

When the Dow gained 1,000 points in the shortest time ever, after having already booked the fastest-ever 1,000-point gains in prior months and years, no one was complaining about it. These rapid-fire 1,000-point-gains had become the new normal. So today, one of those 1,000-point gains has been unwound.

The S&P 500 dropped 113 points, or 4.1%, to 2,648. This took the index back to December 8, 2017. The past six trading days were the worst decline since … well, since the weeks leading up to February 7, 2016, at which point the S&P 500 was off 19%, not quite enough for a dip into an official bear market.

The Nasdaq fell 272 points today, or 3.8%, to 6,967, below 7,000 for the first time since the end of December, but remains, if barely, in positive territory for the year.

…click on the above link to read the rest of the article…

Carmot Capital: “The Next Crisis Won’t Be A Flash Crash; It Will Be A Flash Flood”

THE STRAIGHT FLUSH CRASH

AN ILLUSION OF SIMPLICITY, AN ENTANGLEMENT OF COMPLEXITY

Lately, there has been talk of so-called “elevated” markets. Equity markets, real estate markets and bond markets are indeed reaching new highs regularly. But how long will this last? Can it last indefinitely? Or as is often said, “It’s different this time,”; is it really? We posit that it is not different this time. In fact, there are very real parallels that should concern every investor. What could catalyze the next global financial crisis (“GFC II”)? We suggest that it won’t be a “Flash Crash.” Instead it will be a flash flood that could be caused by very real systemic risk. In other words, the system will flush itself of the market detritus accumulated over the last 8-9 years. We are calling it The Straight Flush Crash. This paper will explain why.

For anyone that has studied the sequence of events leading up to the Global Financial Crisis (“GFC”) of 2008-09, it would not be hard to put together the shape of the new crisis. The first GFC began with the New Century Financial bankruptcy that caused the first market hiccup on February 27, 2007 (when the VIX indicator jumped a record 60% in one day) and escalated to Bear Stearns, to Lehman Brothers, then to the whole GFC debacle. In our opinion, the market blip on August 24, 2015 (affectionately known as the ETF Flash Crash) was the first indication of the shape of things to come. During each crisis, a flashpoint has ignited the existing structure, which then toppled and in turn caused enormous losses for investors. For example, in the GFC of 2008-09, subprime lending was a small fraction of lending which ignited the whole structured finance pyramid and caused the liquidity crisis that bankrupted multiple banks.

…click on the above link to read the rest of the article…

It’s Looking A Lot Like 2008 Now…

It’s Looking A Lot Like 2008 Now…

Did today’s market plunge mark the start of the next crash?

Economic and market conditions are eerily like they were in late 2007/early 2008.

Remember back then? Everything was going great.

Home prices were soaring. Jobs were plentiful.

The great cultural marketing machine was busy proclaiming that a new era of permanent prosperity had dawned, thanks to the steady leadership of Alan Greenspan and later Ben Bernanke.

And only a small cadre of cranks, like me, was singing a different tune; warning instead that a painful reckoning in our financial system was approaching fast.

It’s fitting that I’m writing this on Groundhog Day, as to these veteran eyes, it sure has been looking a lot like late 2007/early 2008 lately…

The Fed’s ‘Reign Of Error’

Of course, the Great Financial Crisis arrived in late 2008, proving that the public’s faith in central bankers had been badly misplaced.

In reality, all Ben Bernanke did was to drop interest rates to 1%. This provided an unprecedented incentive for investors and institutions to borrow, igniting a massive housing bubble as well as outsized equity and bond gains.

It’s worth taking a moment to understand the mechanism the Federal Reserve used back then to lower interest rates (it’s different today). It did so by flooding the banking system with enough “liquidity” (i.e. electronically printed digital currency units) until all the banks felt comfortable lending or borrowing from each other at an average rate of 1%.

The knock-on effect of flooding the US banking system (and, really, the entire world) in this way created an echo bubble to replace the one created earlier during Alan Greenspan’s tenure (known as the Dot-Com Bubble, though ‘Sweep Account’ Bubble is more accurate in my opinion):

…click on the above link to read the rest of the article…

One of BofA’s “Imminent Market Crash” Indicators Was Just Triggered

Early last month, we showed that one of Bank of America’s “guaranteed bear market” indicators, namely the three-month earnings estimate revision ratio (ERR) which since 1988 has had a 100% hit rate of predicting upcoming bear markets, was just triggered. As Bank of America explained at the time, “since 1986, a bear market has followed each time that the ERR rule has been triggered.”

The only weakness of that particular indicator is that while a bear market always followed, the timing was unclear and the upcoming bear could arrive as late as two years after the trigger hit.

Well, fast forward to today when overnight another proprietary “guaranteed bear market” indicator created by the Bank of America quants was just triggered.

As we explained earlier today, as part of the unprecedented, historic rush to dump cash and buy any stocks that one can find, BofA’s “Bull & Bear indicator” surged to 7.9 – effectively 8 – a level that is indicative of broad market euphoria, and the highest it has been since March of 2013, or nearly 5 years ago.

There is another, far more important, reason why the triggering of the Bull and Bear Indicator is a remarkable event: according to Bank of America back-tests, not only does this particular indicator also have a 100% hit rate once triggered…

but on 11 out of 11 signals since 2002, the market dropped on average 12% after it was triggered.

And yes, it also works in the opposite direction: the last Bull & Bear indicator flashed was a buy signal of 0 on Feb 11th 2016. Since then the S&P has been up on 22 of the next 23 months.

Finally, and most importantly, unlike other “bear market” indicators which confirm if a crash is imminent but not when, this one gives an explicit time window: the market always dumps within the next 3 months once a Sell signal has been trigerred.

…click on the above link to read the rest of the article…

The Coming Market Crash Will Set Off The Biggest Gold Panic Buying In History

The Coming Market Crash Will Set Off The Biggest Gold Panic Buying In History

The leverage in the economic system has become so extreme; investors have no idea of the disaster that is going to take place during the next stock market crash.  The collapse of the U.S. Housing and Investment Banking Industry in 2008 and ensuing economic turmoil was a mere WARM-UP for STAGE 2 of the continued disintegration of the global financial and economic system.

While the U.S. and the global economy have seemingly continued business as usual since the Fed and Central Banks stepped in and propped up the collapsing markets in 2008, this was only a one-time GET OUT OF JAIL free card that can’t be used again.  What the Fed and Central Banks did to keep the system from falling off the cliff in 2008 was quite similar to a scene in a science fiction movie where the commander of the spaceship uses the last bit of rocket-fuel propulsion in just the nick of time to get them back to earth on the correct orbit.

Thus, the only way forward, according to the Central banks, was to increase the amount of money printing, leverage, asset values, and debt.  While this policy can work for a while, it doesn’t last forever.  And unfortunately, forever is now, here….or soon to be here.  So, it might be a good time to look around and see how good things are now because the future won’t be pretty.

To give you an idea the amount of leverage in the markets, let’s take a look at a chart posted in the article, A Market Valuation That Defies Comparison.  The article was written by Michael Lebowitz of RealInvestmentAdvice.com.  I like to give credit when credit is due, especially when someone puts out excellent analysis.  In the article, Lebowitz stated the following:


…click on the above link to read the rest of the article…

Goldman Shows What A Market Crash Will Do To The Economy

There is a simple reason why for the past decade, despite all the rhetoric central bankers have been focusing on just one thing – reflating risk assets in general and the stock market in particular – because if you get stocks higher, everything else will eventually follow; call it the “wealth effect and confidence pass thru channel.

This observation forms the basis of a report released overnight by Goldman’s economics team, which claims that the 26% increase in the stock market since the start of 2017 “has been the most important driver of the recent easing in financial conditions, which are now at their easiest level since 2000”, something we showed yesterday.

So what has been the stock market’s contribution to the economic rebound since the Trump election? Here Goldman estimates that “higher equity prices are currently boosting GDP growth by nearly +0.6pp, and account for about two thirds of the +1pp growth impulse from overall financial conditions.” 

Of course, the market impulse has to continue – i.e., the market has to keep rising – or else the economic response becomes muted: “Our base case is that the equity impulse to growth decelerates to +0.3pp by Q4 as equity price gains slow” Goldman explains.

For the econometricians, here are some further insights from Goldman on the favorable economic effect from rising stocks

We have argued that the most important reason for the acceleration in growth last year and for growth optimism in 2018 is the sharp positive swing in the impulse from financial conditions, which are now at their easiest level since April 2000. The run-up in the equity component of the FCI has accounted for rughly half of the 137bp index easing in 2017 and 80% of the of 32bp easing year-to-date (Exhibit 1).

…click on the above link to read the rest of the article…

The Leveraged Economy BLOWS UP In 2018

The Leveraged Economy BLOWS UP In 2018

Enjoy the good times while you can because when the economy BLOWS UP this next time, there is no plan B.  Sure, we could see massive monetary printing by Central Banks to continue the madness a bit longer after the market crashes, but this won’t be a long-term solution.  Rather, the U.S. and global economies will contract to a level we have never experienced before.  We are most certainly in unchartered territory.

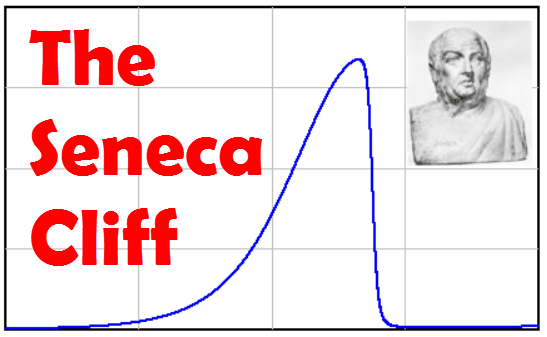
Before I get into my analysis and the reasons we are heading towards the Seneca Cliff, I wanted to share the following information.  I haven’t posted much material over the past week because I decided to spend a bit of quality time with family.  Furthermore, a good friend of mine past away which put me in a state of reflection.  This close friend was also very knowledgeable about our current economic predicament and was a big believer in owning gold and silver.  So, it was a quite a shame to lose someone close by who I could chat with about these issues.

While some of my family members know about my work, I don’t really discuss it with them.  If they ever have a question, I will try to answer it, but I found out years ago that it was a waste of time to try and impose my knowledge upon them.  Which is the very reason I started my SRSrocco Report website… LOL.  So, now I have a venue to get my analysis out to the public.  I don’t care about reaching everyone, but rather to provide important information to those who are OPEN to it.

…click on the above link to read the rest of the article…

The ghost of Gann: Another crash is coming

The original wizard of Wall Street, W.D Gann was a finance trader and wealthy speculator that spent decades investigating cyclical trends in equity market patterns and found that prices could be predicted long in advance. He successfully predicted the crashes in the 1929 and Dot-Com stock market bubbles.  And according to his analysis, the US stock market is due for another crash in 2020.

Every movement in the market is the result of a natural law and of a Cause which exists long before the Effect takes place and can be determined years in advance. The future is but a repetition of the past, as the Bible plainly states…

After suffering through the worst economic and financial crisis since the 1930s depression when the real estate and stock markets crashed in 2007, the United States’ bubble economy is back into full swing. Residential and commercial real estate prices are growing strongly, along with equities.

The US stock market, as defined by the S&P500 index, has boomed after collapsing to a trough in 2009. The market ‘recovered’ more quickly than anyone thought it would, and has continued surging from thereon in.

This has led to a lot of commentary and media coverage that the S&P500 is in the thrall of yet another bubble that will burst. Despite the many predictions of collapse, the bubble has powered on unhindered.

Like all asset bubbles, the primary cause is speculators taking on debt to bid up prices to ever-higher levels, generating a stream of greater fools willing to purchase at inflated valuations. In the case of equities, the type of debt used is margin debt.

The trends in the S&P500 index and margin debt are obvious. The name of the game is capital gains; income is increasingly sidelined as yields become compressed to record lows.

…click on the above link to read the rest of the article…

Market Red Flag: Stocks May Be About To Tank: “If There’s One Thing That You Need To Pay Attention To It’s This…”

Market Red Flag: Stocks May Be About To Tank: “If There’s One Thing That You Need To Pay Attention To It’s This…”

stock-crash-dynamite

Stock and bond markets may be teetering on the edge of a widespread crash following a stellar year that has seen all-time highs across just about every major asset class. Earlier today Zero Hedge reported that Bloomberg market commentator Mark Cudmore says markets could be in for a violent downside break in the weeks ahead.

It’s a sentiment also shared by Traders Choice analyst Greg Mannarino, who up until this point has been generally bullish on short-term market movements. On Thursday, however, Mannarino reports that bond buying, which has been used to prop up stocks through massive cash injections in recent weeks and months, failed to keep stocks from falling.

This, says Mannarino, is a major red flag that could signal a reversal going forward:

If there’s one thing that you need to pay attention to it’s this… savage bond buying occurred today in an attempt to re-prop up the stock market and it didn’t work…

They’re trying to play a game here and it’s been working time and time again…

Without fail every single time… except for today… that has worked.

I am not sounding the alarm saying ‘this is it… this is the market crash.’ What I am saying is that you need to exercise caution right here… there’s a divergence going on and when you see divergences like this your eyes should open up… maybe it’s time to pull profits… maybe it’s time to hedge positions…

If we continue to see this action… the one thing we need to watch for is a simultaneous sell-off which will occur in the bond market and the stock market at the same time… when these things start to fall in tandem get out of the market…

…click on the above link to read the rest of the article…

Warning: ‘They Need The Markets To Implode’ To Usher In Cashless System

Warning: ‘They Need The Markets To Implode’ To Usher In Cashless System

stockmarketcrash

Market analyst Lynette Zang predicts in the next market meltdown, “real estate, stocks, and bonds will all crash.” When asked when this will happen, Zang says, “Enjoy your Christmas,” but in 2018, all bets are off.

Greg Hunter interviewed Lynette Zang, Chief Market Strategist at ITMtrading.com, and her assessment of the 2018 economy is dire.  Zang predicts, “In 2018, I don’t think they can hold these things together. I think we will see a major market correction in 2018. When that happens, that will cause the derivative implosion. We have to feel a lot of pain. . . . I think we are going to go into hyperinflation, and I think we will start to see that in 2018 because I think we will see these markets implode. I think we will see QE4 (money printing) for sure. . . . We have QE right now propping it up, according to the Fed’s own documents.”

Zang says ever since the 2008 meltdown, the elite have just been buying time to set up a debt reset.

“I am 100% certain we are in the middle of a money standard shift.  Ultimately, they need the markets to implode. . . . In 2008, the debt based system broke.  It died, it was done.  The central banks, globally, put it on life support, and they have to create a new system.  In my opinion, they want us cashless, and they want everything in digital form.  They want to dematerialize wealth at least for the masses.  I am 100% certain that this Bitcoin craze, and all of this, is about getting people used to digital currencies.  So, when they shift us from the debt based system to the digital system, we are more comfortable with it and more familiar with it.”

…click on the above link to read the rest of the article…
Government Watchdog Warns Market Crash Risk Rising: “One-Sixth Of All Hedge Funds Are 15x Leveraged”

Government Watchdog Warns Market Crash Risk Rising: “One-Sixth Of All Hedge Funds Are 15x Leveraged”

One wonders if the Fed ever reads the reports issued by the Office of Financial Stability, which does a surprisingly good job of laying out the risks facing the market at any one time, which incidentally are far greater than various Fed presidents would care to admit. If it did, it would learn from the just published annual report, that “market risks — risks to financial stability from movements in asset prices — remain high and continue to rise” and that “low volatility and persistently low interest rates” both of which have been caused by the Fed and other central banks “may promote excessive risk-taking and create vulnerabilities.”

While the OFR said that strong earnings growth, steady economic growth, and increased expectations for stimulative fiscal policy have provided further support to asset valuations, this “increase in
already-elevated asset prices and the decrease in risk premiums may leave some markets vulnerable to a large correction,” a polite government term synonymous with “crash.” It then notes that “such corrections can trigger financial instability when important holders or intermediaries of the assets employ high degrees of leverage or rely on short-term loans to finance long-term assets.”Furthermore, echoing Minsky, the OFR did its best paraphrase of “stability is destabilizing” by noting that “historically low volatility levels reflect calm markets, but could also suggest that the financial system is more fragile and prone to crisis.”

Speaking of valuations, the OFR was clear to warn that these are “high by historical standards. The cyclically adjusted price-to-earnings ratio of the S&P 500 is at its 97th percentile relative to the last 130 years. Other equity valuation metrics that the OFR monitors are also elevated.”

…click on the above link to read the rest of the article…

Global Gold Investment Demand To Overwhelm Supply During Next Market Crash

Global Gold Investment Demand To Overwhelm Supply During Next Market Crash

When the next market crash occurs, global gold investment demand will likely overwhelm supply.  When this occurs, we could finally see the gold price surpass its previous high of $1,900.  Now, this isn’t mere speculation, as we already have seen this taking place in the past.  When the broader markets crashed to the lows in Q1 2009 and the 10% correction in Q1 in 2016, these periods were to two highest quarters of Gold ETF investment demand.

I don’t really care on whether the physical gold is actually in the Gold ETF’s, rather I like to look at it as an important indicator that shows us how much investor fear there is in the market.  Moreover, with the amount of leverage and debt now in the system, when the market crashes this time around, it will push gold investment demand up to a record we have never seen before.

The chart below shows the amount of physical global gold investment demand over the past 14 years.  As the gold price increased, so did amount of gold bar and coin demand:

As we can see, during the U.S. Banking and Housing Market crash in 2008, gold bar and coin demand doubled to 868 metric tons (mt), up from 434 mt in 2007.  That was quite a lot of gold bar and coin demand as it totaled nearly 28 million oz (1 metric ton = 32,150 oz).  Furthermore, as the gold price jumped to $1,571 in 2011, gold bar and coin demand shot up to nearly 1,500 mt (48 million oz).

Now, the reason for the huge spike in physical gold investment in 2013 was due to the huge price smash as the gold price fell from nearly $1,700 in the beginning of the year to a low of $1,380 by the middle of April.  Investors thought this was a huge sale on gold so demand for bars and coins reached a new record of 1,716 mt.

…click on the above link to read the rest of the article…

Olduvai IV: Courage
Click on image to read excerpts

Olduvai II: Exodus
Click on image to purchase

Click on image to purchase @ FriesenPress