Home » Posts tagged 'credit' (Page 5)

Tag Archives: credit

Olduvai
Click on image to purchase

Olduvai III: Catacylsm
Click on image to purchase

Post categories

Post Archives by Category

Economic Downturn: Credit Cards Aren’t Being Paid, Accounts Are Being Closed

Economic Downturn: Credit Cards Aren’t Being Paid, Accounts Are Being Closed

A new report is shining some light on an indicator that the economy is about to take a major downturn. Credit card accounts are not being paid and some accounts are being closed in anticipation for an upcoming recession.

Credit-card delinquencies, application rejections, and involuntary account closures are all on the upswing, according to a report from the Federal Reserve Bank of New York. According to Business Insider, The Fed says these developments reported are “potentially concerning” given the strength of the economy and comparatively low interest rates. Does the Fed not remember that they themselves have been jacking up the interest rates for months now? Sure, they are still relatively low, but that’s little consolation for the person who lives paycheck to paycheck and just saw another rate hike.

The Fed released the results of this report this week. It’s called the “Credit Access Survey” which is a quarterly report on United States borrowers. It brought to the surface a couple of alarming trends that suggest credit-card issuers are getting skittish and paring back risk: Both credit-card rejection rates and involuntary account closures are on the rise.

A separate New York Fed report released last month, the “Quarterly Report on Household Debt and Credit,” produced a similar finding. The report, which mines Equifax consumer credit reports for data, showed an uptick in the past year and a half in account closures, again primarily from credit cards.

The reason credit card companies may be closing accounts and rejecting borrowing increases is that they may be spooked by the increasing number of people who already aren’t paying off their cards. Credit-card delinquency rates began to climb sharply toward the end of 2016, a trend that hasn’t reversed in 2018, according to Fed data.

… click on the above link to read the rest of the article…


The Art of Defaulting

… the debt-financed overspending of the 1960s had continued into the early 1970s. The Fed had funded this spending with easy-credit policies, but by paying back its debts with depreciated paper money instead of gold-backed dollars, the U.S. effectively defaulted.

Ray Dalio

Principles for navigating big debt crises

Ray Dalio of Bridgewater Associates is one of my role models in life and, when he writes a new book, I would normally visit Amazon.co.uk more quickly than you can count to ten, but not this time!

What? Have I fallen out of love with Ray’s way of thinking? Not at all, but I found out that his new book – Principles for Navigating Big Debt Crises – can actually be downloaded for free. Ray, being the class act he is, has decided that everybody should know how to navigate a debt crisis; hence he has chosen to make it freely available (as a PDF copy).

Much (but not all) of the content below is inspired by Ray’s thinking. He is not as explicit in his new book as I am below (and as he has been before) in terms of the timing of the next debt crisis, but it’s pretty clear that he also thinks the writing is on the wall.

If you want to read the wise words of a very smart man, I suggest you give yourself one for Christmas, which you can do here. Christmas presents rarely come cheaper than this.

Debt crises of different sorts

In the following, I will focus on what Ray calls major debt crises – crises that have caused a slump in GDP of at least 3% but, in reality, there are different types of major debt crises.

…click on the above link to read the rest of the article…

Stock-Market Margin Debt Plunges Most Since Lehman Moment

Stock-Market Margin Debt Plunges Most Since Lehman Moment

It gets serious. Margin calls?

No one knows what the total leverage in the stock market is. But we know it’s huge and has surged in past years, based on the limited data we have, and from reports by various brokers about their “securities-based loans” (SBLs), and from individual fiascos when, for example, a $1.6 billion SBL to just one guy blows up. There are many ways to use leverage to fund stock holdings, including credit card loans, HELOCs, loans at the institutional level, loans by companies to its executives to buy the company’s shares, or the super-hot category of SBLs, where brokers lend to their clients. None of them are reported on an overall basis.

The only form of stock market leverage that is reported monthly is “margin debt” – the amount individual and institutional investors borrow from their brokers against their portfolios. Margin debt is subject to well-rehearsed margin calls. And apparently, they have kicked off.

In the ugliest stock-market October anyone can remember, margin debt plunged by $40.5 billion, FINRA (Financial Industry Regulatory Authority) reported this morning – the biggest plunge since November 2008, weeks after Lehman Brothers had filed for bankruptcy:

During the stock market boom since the Financial Crisis, this measure of margin debt has surged from high to high, reaching a peak in May 2018 of $669 billion, up 60% from the pre-Financial Crisis peak in July 2007, and up 117% since January 2012. Since the peak in May, margin debt has dropped by $62 billion (-9.2%). Note the $40.5-billion plunge in October:

In the two-decade scheme of things, the relationship between stock market surges and crashes and margin debt becomes obvious.

Back during the dot-com bubble, dot-com stocks, traded mostly on the Nasdaq, included what today are booming survivors like Amazon [AMZN], barely hangers-on like RealNetworks [RNWK], or goners like eToys.

…click on the above link to read the rest of the article…

Does China Have Enough Gold to Move Toward Hard Currency?

Does China Have Enough Gold to Move Toward Hard Currency?

yuangold1.PNG

Are the Chinese Keynesian?

We can be reasonably certain that Chinese government officials approaching middle age have been heavily westernised through their education. Nowhere is this likely to matter more than in the fields of finance and economics. In these disciplines there is perhaps a division between them and the old guard, exemplified and fronted by President Xi. The grey-beards who guide the National Peoples Congress are aging, and the brightest and best of their successors understand economic analysis differently, having been tutored in Western universities.

It has not yet been a noticeable problem in the current, relatively stable economic and financial environment. Quiet evolution is rarely disruptive of the status quo, and so long as it reflects the changes in society generally, the machinery of government will chug on. But when (it is never “if”) the next global credit crisis develops, China’s ability to handle it could be badly compromised.

This article thinks through the next credit crisis from China’s point of view. Given early signals from the state of the credit cycle in America and from growing instability in global financial markets, the timing could be suddenly relevant. China must embrace sound money as her escape route from a disintegrating global fiat-money system, but to do so she will have to discard the neo-Keynesian economics of the West, which she has adopted as the mainspring of her own economic advancement.

With Western-educated economists imbedded in China’s administration, has China retained the collective nous to understand the flaws, limitations and dangers of the West’s fiat money system? Can she build on the benefits of the sound-money approach which led her to accumulate gold, and to encourage her citizens to do so as well?

…click on the above link to read the rest of the article…

“A Daisy Chain Of Defaults”: How Debt Cross-Guarantees Could Spark China’s Next Crisis

On November 8, China shocked markets with its latest targeted stimulus in the form of an “unprecedented” lending directive ordering large banks to issue loans to private companies to at least one-third of new corporate lending. The announcement sparked a new round of investor concerns about what is being unsaid about China’s opaque, private enterprises, raising prospects of a fresh spike in bad assets.

A few days later, Beijing unveiled another unpleasant surprise, when the PBOC announced that Total Social Financing – China’s broadest credit aggregate – has collapsed from 2.2 trillion yuan in September to a tiny 729 billion in October, missing expectations of a the smallest monthly increase since October 2014.

Some speculated that the reason for the precipitous drop in new credit issuance has been growing concern among Chinese lenders over what is set to be a year of record corporate defaults within China’s private firms. As we reported at the end of September, a record number of non-state firms had defaulted on 67.4 billion yuan ($9.7 billion) of local bonds this year, 4.2 times that of 2017, while the overall Chinese market was headed for a year of record defaults in 2018. Since then, the amount of debt default has risen to 83 billion yuan, a new all time high (more below).

Now, in a new development that links these seemingly unrelated developments, Bloomberg reports that debt cross-guarantees by Chinese firms have left the world’s third-largest bond market prone to contagion risks, which has made it “all the tougher for officials to follow through on initiatives to sustain credit flows”, i.e., the growing threat of unexpected cross- defaults is what is keeping China’s credit pipeline clogged up and has resulted in the collapse in new credit creation.

…click on the above link to read the rest of the article…

The Broken Clocks’ Minute

The Broken Clocks’ Minute

Sometimes the reasons you’re wrong turn out to be the reasons you’re right.

Even a broken clock is right twice a day.

Old Wall Street adage

Anyone who has consistently sounded cautionary or outright bearish notes during the last nine years of relentlessly rising equity markets has been cast aside. Wall Street is bipolar. You’re either right or wrong, and wrong doesn’t buy mansions and Maseratis. Like that broken clock, the so-called permabears have had a couple of minutes when they were right, far outweighed by those 1438 minutes when they were wrong.

Or maybe it’s all a matter of perspective, and it’s the last nine years that amounts to two minutes. In geologic time nine years isn’t even a nanosecond. Perhaps even on time periods scaled to human lifetimes and history, the last nine years will come to be seen as an evanescent flash that came and ignominiously went.

Markets don’t listen to reasons. They’re exercises in crowd psychology and crowds are emotional and capricious. That doesn’t mean that reason is a useless virtue in market analysis, quite the opposite. It’s reason that allows the few who are consistently successful to separate themselves from the crowd and capitalize on its emotion and caprice.

Reason identifies rising stock markets as one symptom of a sugar high global economy. Since 2009, staring into the abyss of debt implosion, central banks acting in concert have promoted furious debt expansion as the finger-in-the-dike remedy. Governments expanded their fiat (aka out of thin air) debt, and central banks monetized that debt with their own fiat debt. Not only did that create loanable reserves within the banking system—private debt fodder—it drove interest rates so low that yield-deprived investors were herded into the stock market. Borrowers won, savers lost.

…click on the above link to read the rest of the article…

Real Canadian Mortgage Credit Growth Is Pointing To An Early 80s Style Meltdown

Real Canadian Mortgage Credit Growth Is Pointing To An Early 80s Style Meltdown

Canadian mortgage credit growth is falling, but how bad is it in real terms? People are comparing today’s low growth numbers to the mid-1990s. While there are some parallels, it more accurately resembles the early 1980s. Mortgage credit growth, when adjusted for inflation, is heading towards negative numbers. We haven’t actually experienced negative real growth in over 30 years.

Why Real Mortgage Credit Is Important

In order to more accurately observe trends, analysts will sometimes inflation adjust dollar amounts. Inflation is the decrease in power of money, caused by rising or falling prices in goods. Inflation tends to obfuscate the true trend over long periods of time. Did the currency go to s**t, or did we see a behavioral change? Was it low growth, or negative growth? To get a better picture, it’s sometimes (almost always) useful to adjust for inflation. When numbers are adjusted for inflation, they’re called real numbers.

Looking at real numbers allows us to observe the trend, without the distortion of currency value at the time. This is particularly important when looking at the early 1980s for Canada. During that period, inflation was totally out of control. Today we often think of that period as low growth, with a brief negative contraction. In actuality, it was a very large contraction in real terms.

Okay, no one thinks about the early 1980s rate of credit growth, but some of you should!

Canadian Mortgage Credit Growth Is Over 3%

Canadian mortgage credit growth is pretty weak when looking at unadjusted numbers. The annual pace of growth fell to 3.38% in September, down 38.76% from last year. This is the lowest pace since June 2001, and on target to head lower according to recent performance. It’s low growth, but at least it’s not negative is what most are thinking.

…click on the above link to read the rest of the article…

Understanding the Global Recession of 2019

Understanding the Global Recession of 2019

Isn’t it obvious that repeating the policies of 2009 won’t be enough to save the system from a long-delayed reset?

2019 is shaping up to be the year in which all the policies that worked in the past will no longer work. As we all know, the Global Financial Meltdown / recession of 2008-09 was halted by the coordinated policies of the major central banks, which lowered interest rates to near-zero, bought trillions of dollars of bonds and iffy assets such as mortgage-backed securities, and issued unlimited lines of credit to insolvent banks, i.e. unlimited liquidity.

Central governments which could do so went on a borrowing / spending binge to boost demand in their economies, and pursued other policies designed to bring demand forward, i.e. incentivize households to buy today what they’d planned to buy in the future.

This vast flood of low-cost credit and liquidity encouraged corporations to borrow money and use it to buy back their stocks, boosting per-share earnings and sending stocks higher for a decade.

The success of these policies has created a dangerous confidence that they’ll work in the next global recession, currently scheduled for 2019. But policies follow the S-Curve of expansion, maturity and decline just like the rest of human endeavor: the next time around, these policies will be doing more of what’s failed.

The global economy has changed. Demand has been brought forward for a decade, effectively draining the pool of future demand. Unprecedented asset purchases, low rates of interest and unlimited liquidity have inflated gargantuan credit / asset bubbles around the world, the so-called everything bubble as most asset classes are now correlated to central bank policies rather than to the fundamentals of the real-world economy.

…click on the above link to read the rest of the article…

The State of the American Debt Slaves, Q3 2018

The State of the American Debt Slaves, Q3 2018

Consumers are being lackadaisical again with their plastic.

Consumer debt – or euphemistically, consumer “credit” – jumped 4.9% in the third quarter compared to the third quarter last year, or by $182 billion, to almost, but no cigar, $4 trillion, or more precisely $3.93 trillion (not seasonally adjusted), according to the Federal Reserve this afternoon. As befits the stalwart American consumers, it was the highest ever.

Consumer debt includes credit-card debt, auto loans, and student loans, but does not include mortgage-related debt:

The nearly $4 trillion in consumer debt is up 49% from the prior peak at the cusp of the Financial Crisis in Q2 2008 (not adjusted for inflation). Over the same period, nominal GDP (not adjusted for inflation) is up 39% — thus continuing the time-honored trend of debt rising faster than nominal GDP.

But a hot economy is helping out: While over the past 12 months, consumer debt jumped by 4.9%, nominal GDP jumped by 5.5%. A similar phenomenon also occurred in Q2. This is rather rare. The last time nominal GDP outgrew consumer credit, and the only time since the Great Recession, was in the three quarters from Q1 through Q3 2015.

Auto loans and leases

Auto loans and leases for new and used vehicles in Q3 jumped by $41 billion from a year ago, or by 3.7%, to a record of $1.11 trillion. These loan balances are impacted mainly by these factors: prices of vehicles, mix of new and used, number of vehicles financed, the average loan-to-value ratio, and duration of loans originated in prior years.

The green line in the chart represents the old data before the adjustment in September 2017. These adjustments to consumer credit occur every five years, based on new Census survey data. Most of the adjustments affected auto-loan balances, reducing them by $38 billion retroactively to 2015.

…click on the above link to read the rest of the article…

“Ultra-FICO” to Boost Credit Scores Giving Millions More Access to Credit

Just in the nick of time not: Fair Isaac is launching a new type of credit score that will give millions more credit.

Just as the economy is peaking, consumers with a low FICO could get a higher “UltraFICO“, a new score that factors in bank-account activity as well as loan payments.

Credit scores for decades have been based mostly on borrowers’ payment histories. That is about to change.

Fair Isaac Corp., creator of the widely used FICO credit score, plans to roll out a new scoring system in early 2019 that factors in how consumers manage the cash in their checking, savings and money-market accounts. It is among the biggest shifts ever for credit-reporting and the FICO scoring system, the bedrock of most consumer-lending decisions in the U.S. since the 1990s.

The UltraFICO Score, as it’s called, isn’t meant to weed out applicants. Rather, it is designed to boost the number of approvals for credit cards, personal loans and other debt by taking into account a borrower’s history of cash transactions, which could indicate how likely they are to repay.

The new score, in the works for years, is FICO’s latest answer to lenders who have been clamoring for a way to boost loan approvals.

UltraFICO is the latest in a recent series of changes by credit-reporting and scoring firms that are helping boost consumers’ credit scores.

Equifax, Experian and TransUnion last year began deleting most tax-lien and civil judgment information from credit reports. They also have been removing certain accounts in collections, following settlements with state attorneys general dating back to 2015 over how they manage errors and certain negative information on credit reports.

…click on the above link to read the rest of the article…

China Changes Definition Of Aggregate Financing To Disguise Sharp Credit Slowdown

With investor attention increasingly focused on China’s credit pipeline to see if the recent crackdown on shadow lending has unlocked other sources of debt in a country where growth is always and only a credit phenomenon, and where both the housing and auto sectors are suddenly reeling, overnight’s latest credit data from the PBOC was closely scrutinized… and left China watchers with a very bitter taste.

What it showed was that traditional new RMB loans rose to RMB1,380bn in September, largely as expected (exp RMB1,360bn) from RMB1,280bn in August, with growth of outstanding loans unchanged at 13.2% Y/Y and up from 12.7% a year ago. New loans to the corporate sector rose to RMB677bn from RMB613bn in August, in which medium- to long-term loans rose to RMB380bn from RMB343bn in August. New loans to the household sector rose slightly to RMB754bn in September from RMB701bn in August, and the long-term loan component (mostly mortgage loans) remained largely flat at RMB431bn (August: RMB442bn). New loans to non-bank financial institutions were -RMB60bn in September versus -RMB44bn in August (average September level: RMB13bn). Also of note, M2 growth rose by 0.1% to 8.3% Y/Y in September, in line with market expectations, however as Nomura writes in a note this morning, monetary aggregate growth is no longer as important to the central bank’s policy making as it once was, and Beijing is focusing more on interbank liquidity conditions, aggregate financing and investment.

Where the data was especially interesting, however, was in the broader Total Social Financing category, which on the surface came in well stronger than expected printing at RMB2,205bn in September from RMB1,929bn in August, above the $1,550bn estimate, and the strongest month since January.

…click on the above link to read the rest of the article…

The Credit Cycle is on the Turn

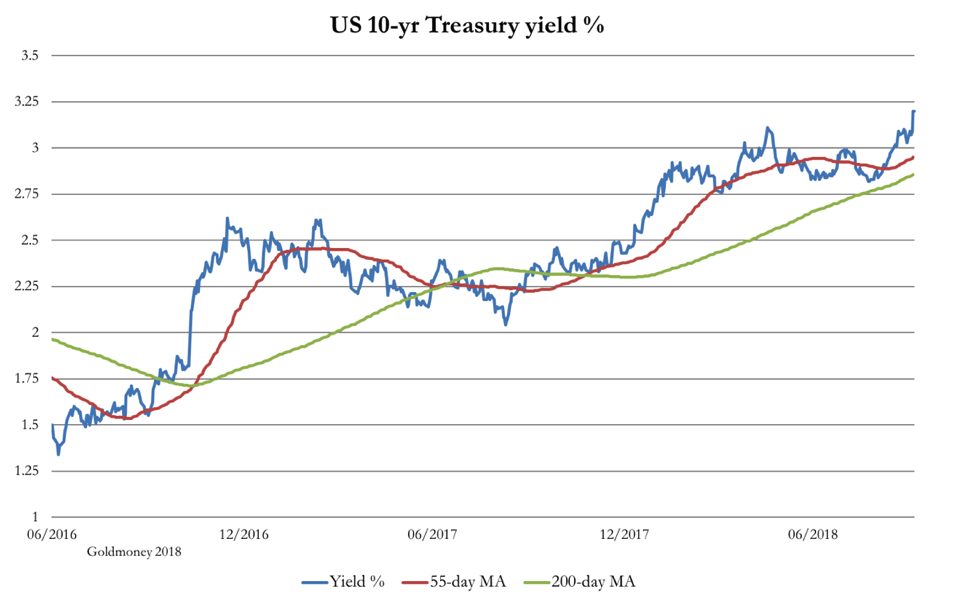
We are on the verge of moving into an era of high interest rates, so markets will behave differently from any time since the early-1980s. There are enough similarities with the post-Bretton Woods era of the 1970s to give us some guidance as to how markets are likely to evolve in the foreseeable future.

u turn 1

The chart above says much. Last week, the yield on the 10-year US Treasury bond broke new high ground for this credit cycle. The evolution of key moving averages in bullish sequence (for higher yields, but sharply lower bond prices) is a model example out of the chartist’s textbook. The underlying momentum looks so powerful that a quick rise to 3.5% and beyond appears to be a racing certainty. The credit cycle, transiting from a period of cheap finance into higher borrowing costs is clearly on the turn.

In the fiat-money world, everything takes its valuation cue from US Treasury bonds. For equities it is theoretically the long bond, which is also racing towards higher yields. Having ignored rising yields for the long bond so far, the S&P500 only recently hit new highs. It has been a fantasy-land for equities from which a rude awakening appears increasingly certain. It is likely that the current downturn in equity prices is the start of a new downtrend in all financial assets that have been badly caught on the hop by the ending of cheap credit.

At some stage, and this is why the bond-yield break-out is important, we will face a disruption in valuations that undermines the relationship between assets and debt. This has been a periodic event, with central banks taking whatever action was needed to rescue the commercial banks. When the crisis happens, they reduce interest rates to support asset valuations, propping up government bond markets and ultimately equities.

…click on the above link to read the rest of the article…

Fed Credit and the US Money Supply – The Liquidity Drain Accelerates

Fed Credit and the US Money Supply – The Liquidity Drain Accelerates

Federal Reserve Credit Contracts Further

We last wrote in July about the beginning contraction in outstanding Fed credit, repatriation inflows, reverse repos, and commercial and industrial lending growth, and how the interplay between these drivers has affected the growth rate of the true broad US money supply TMS-2 (the details can be seen here: “The Liquidity Drain Becomes Serious” and “A Scramble for Capital”).


The Fed has clearly changed course under Jerome Powell – for now, anyway.

Our friend Michael Pollaro* recently provided us with an update on outstanding Fed credit. As there are no longer any outstanding reverse repos with domestic banks, the liquidity drain is accelerating of late, with growth in net Fed credit contracting at fairly rapid rate of 3.4% year-on-year in September, the fourth consecutive month of decline:

The year-on-year contraction in net Fed credit accelerates. Since there are no longer any outstanding reverse repos with domestic financial institutions, the only force counteracting the negative effect on money supply growth is inflationary bank lending.

Michael also sent us a chart comparing the monthly trend in total net Fed credit in the course of 2017 with the trend in 2018 to date. When “QT” started in September of 2017, outstanding Fed credit initially kept growing well into 2018, largely because reverse repos with US banks ran off faster than securities held by the Fed decreased – but that has changed quite noticeably in the meantime:

Fed credit in 2017 (blue bars) vs. 2018 (red bars). The downtrend becomes more pronounced.

Keep in mind that the reverse repos mainly served to alleviate growing delivery fails due to a shortage in certain off-the run treasury securities which banks needed as collateral. As the Fed has stopped reinvesting all proceeds from maturing treasuries and MBS, banks no longer need to borrow securities from its portfolio.

…click on the above link to read the rest of the article…

The Global Distortions of Doom Part 1: Hyper-Indebted Zombie Corporations

The Global Distortions of Doom Part 1: Hyper-Indebted Zombie Corporations

The defaults and currency crises in the periphery will then move into the core.

It’s funny how unintended consequences so rarely turn out to be good. The intended consequences of central banks’ unprecedented tsunami of stimulus (quantitative easing, super-low interest rates and easy credit / abundant liquidity) over the past decade were:

1. Save the banks by giving them credit-money at near-zero interest that they could loan out at higher rates. Savers were thrown under the bus by super-low rates (hope you like your $1 in interest on $1,000…) but hey, bankers contribute millions to politicos and savers don’t matter.

2. Bring demand forward by encouraging consumers to buy on credit now.Nothing like 0% financing to incentivize consumers to buy now rather than later. Since a mass-consumption economy depends on “growth,” consumers must be “nudged” to buy more now and do so with credit, since that sluices money to the banks.

3. Goose assets based on interest rates by lowering rates to near-zero. Bonds, stocks and real estate all respond positively to declining interest rates. Corporations that can borrow money very cheaply can buy back their shares, making insiders and owners wealthier. Housing valuations go up because buyers can afford larger mortgages as rates drop, and bonds go up in value with every notch down in yield.

This vast expansion of risk-assets valuations was intended to generate a wealth effectthat made households feel wealthier and thus more willing to binge-borrow and spend.

All those intended consequences came to pass: the global economy gorged on cheap credit, inflating asset bubbles from Shanghai to New York to Sydney to London. Credit growth exploded higher as everyone borrowed trillions: nation-states, local governments, corporations and households.

While much of the hot money flooded into assets, some trickled down to the real economy, enabling enough “growth” for everyone to declare victory.

…click on the above link to read the rest of the article…
Weekly Commentary: Q2 2018 Z.1 Flow of Funds

Weekly Commentary: Q2 2018 Z.1 Flow of Funds

Non-Financial Debt (NFD) expanded at a seasonally-adjusted and annualized rate (SAAR) of $2.283 TN during the quarter. While this was down from Q1’s booming SAAR $3.681 TN, it nonetheless puts first-half Credit growth at an almost $3.0 TN pace. Annual NFD growth has exceeded $2.0 TN only one year in the past decade (2016’s $2.05 TN). NFD expanded $2.509 TN in 2007, second lonely to 2004’s record $2.910 TN.
NFD ended Q2 at a record $50.710 TN, up $2.674 TN over the past four quarters and $4.868 TN over two years. NFD has increased $15.65 TN, or 45%, since the end of 2008. NFD ended the quarter at 248% of GDP. This compares to 231% at the end of 2007 and 189% to end 1999. It’s worth noting that Q2 y-o-y GDP growth of 5.4% was the strongest since Q2 2006.

The historic federal government borrowing binge runs unabated. Federal debt rose SAAR $1.186 TN during Q2, huge borrowings yet down from Q1’s blistering SAAR $2.828 TN. For the quarter, Federal Expenditures were up 6.0% y-o-y, while Federal Receipts were down 2.0%. Over the past year, outstanding Treasury Securities increased $1.292 TN to a record $17.091 TN. Since the end of 2007, Treasuries have ballooned $11.040 TN, or 182%.

But let’s not forget the government-sponsored enterprises (GSEs). Agency Securities expanded SAAR $236bn during Q2 to a record $8.962 TN. Over the past year, Agency Securities jumped $295 billion, with a two-year jump of $638 billion. This has been the strongest GSE growth in more than a decade. Combined Treasury and GSE Securities expanded to 128% of GDP (vs. 92% at the end of ’07 and 80% in 2000).

Total Debt Securities expanded SAAR $1.579 TN during the quarter. Washington continues to completely dominate securities issuance. Federal government accounted for SAAR $1.186 TN, the GSEs SAAR $80 billion, and Agency/GSE-MBS SAAR $161 billion. With net corporate debt issuance grinding to a halt during the quarter, little wonder corporate Credit spreads remain compressed.

…click on the above link to read the rest of the article…

Olduvai IV: Courage
Click on image to read excerpts

Olduvai II: Exodus
Click on image to purchase

Click on image to purchase @ FriesenPress