Exxon Mobil’s refinery closure in Australia: peak oil context
Exxon Mobil’s Melbourne refinery is closing and will be converted into a fuel import terminal. The Australian public broadcaster has found the right title for its article:
Australia loses another oil refinery, leaving our fuel supply vulnerable to regional crises
11/2/2021
https://www.abc.net.au/news/2021-02-11/australia-loses-another-oil-refinery-risking-fuel-supply/13139648
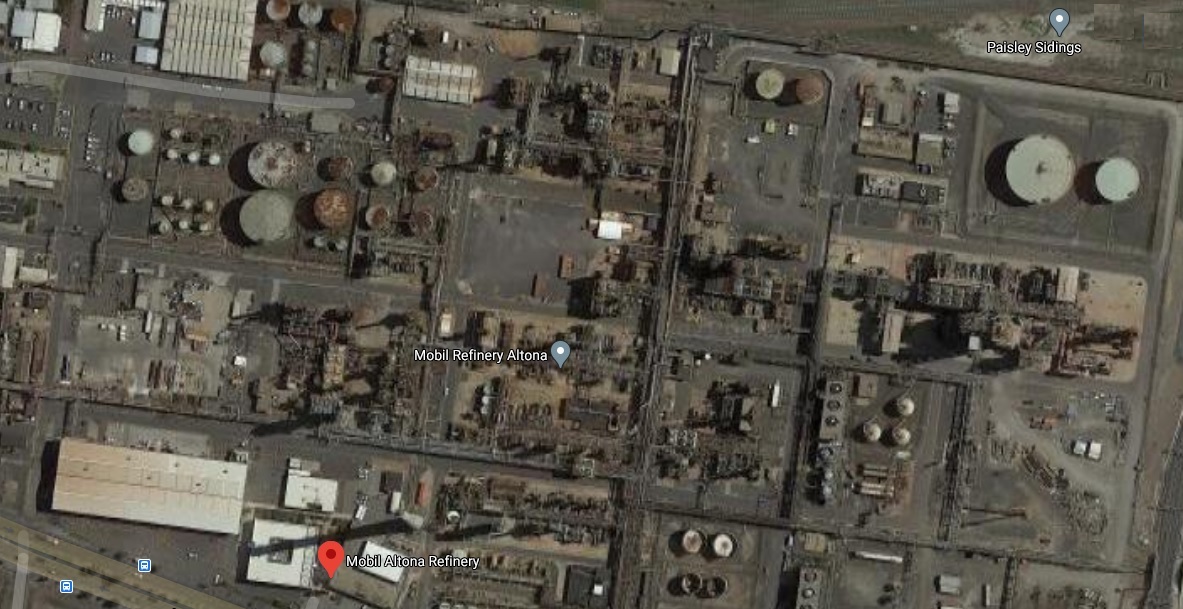 Fig 1: Exxon-Mobil Altona refinery in Melbourne
The refinery has a capacity of 86 kb/d, around 10% of Exxon Mobil’s Asia Pacific capacity.
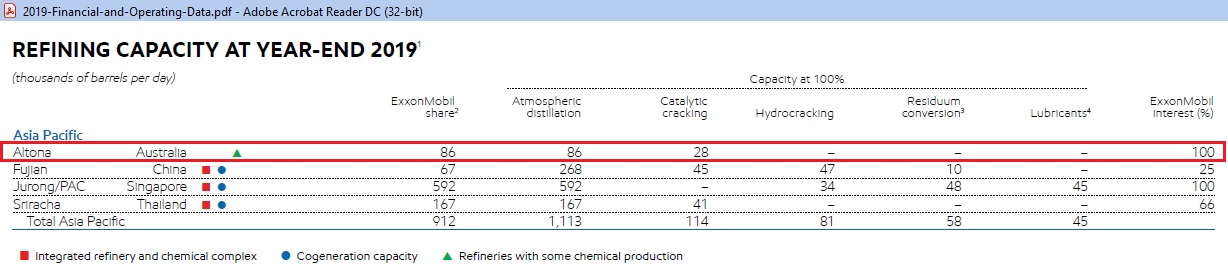 Fig 2: Exxon Mobil’s refineries in Asia Pacific
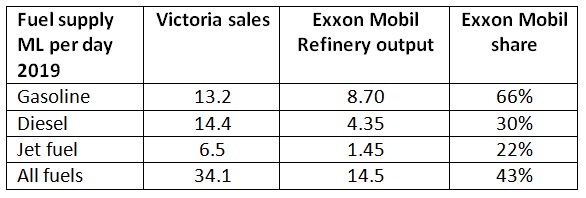
“The Altona refinery produces up to 14.5 million litres of refined products per day.
Petrol represents approximately 60 percent of production [8.7 ML/d], with diesel representing a further 30 percent [4.35 ML/d] and jet fuel around 10 percent [1.45 ML/d]. The percentage of each product depends on the type of feedstock used – different types of crude oil, for example, will produce more or less LPG from the refining process.
Around 90 percent of products are transported by pipeline from the refinery to Mobil’s Yarraville terminal and other industry terminals for distribution by road.
The refinery supplies feedstock for the nearby Altona chemical complex, which in turn supplies feedstocks to a number of petrochemical manufacturing plants at Altona. These plants produce the raw material from which a multitude of consumer products are made.”
How much is that compared to Victoria’s fuel sales?
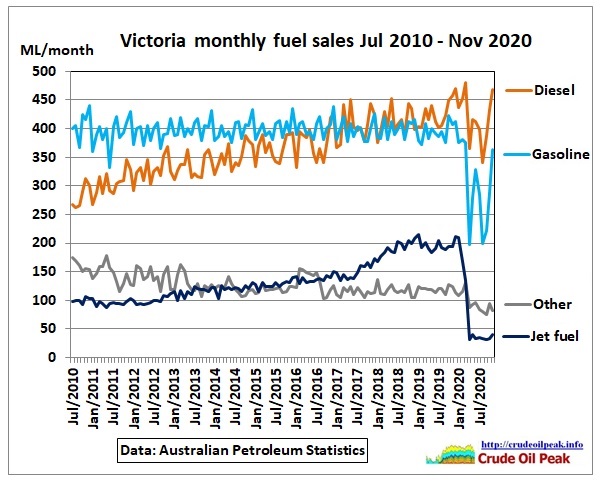 Fig 3: Victoria’s petroleum sales by product
Between 2010 and December 2019 Victoria gasoline sales were practically flat at 400 ML/month or 13.2 ML/day. In contrast, Diesel sales increased by a whopping 5.5% pa from a trend average of 290 ML/month in July 2010 to 440 ML/month or 14.4 ML/day by end 2019. Jet fuel sales increased from 100 ML/month in 2010/11 to 200 ML/month or 6.5 ML/day in 2018/19 (jump due to international flights)
Let’s stack it all up:
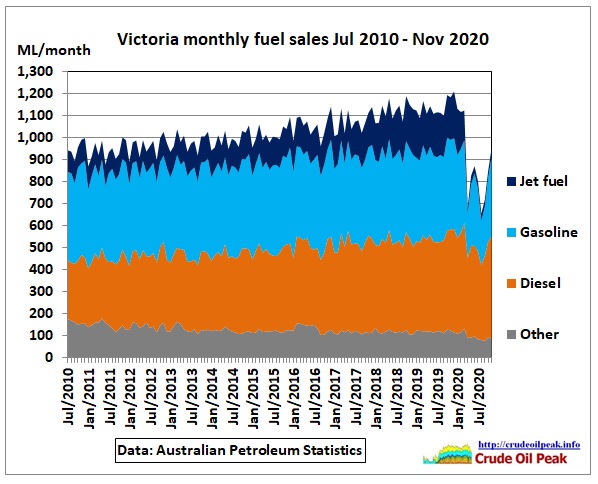 Fig 4: Total Victoria fuel sales
…click on the above link to read the rest of the article…