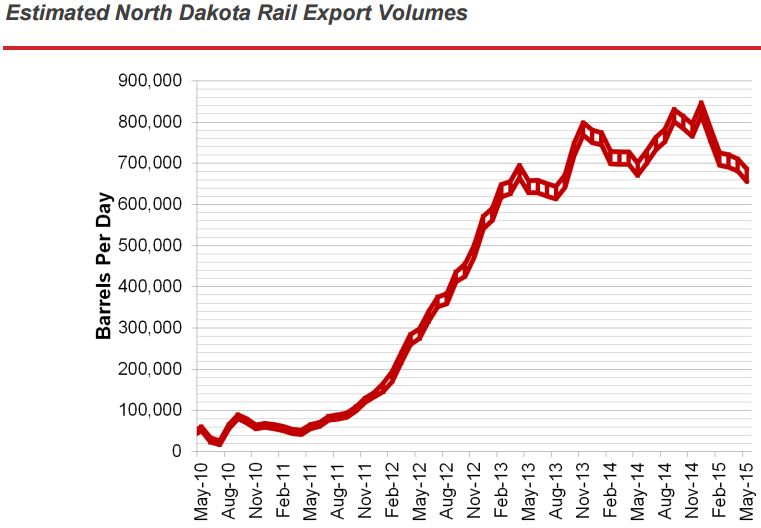
Oil Shipments by Rail Declining
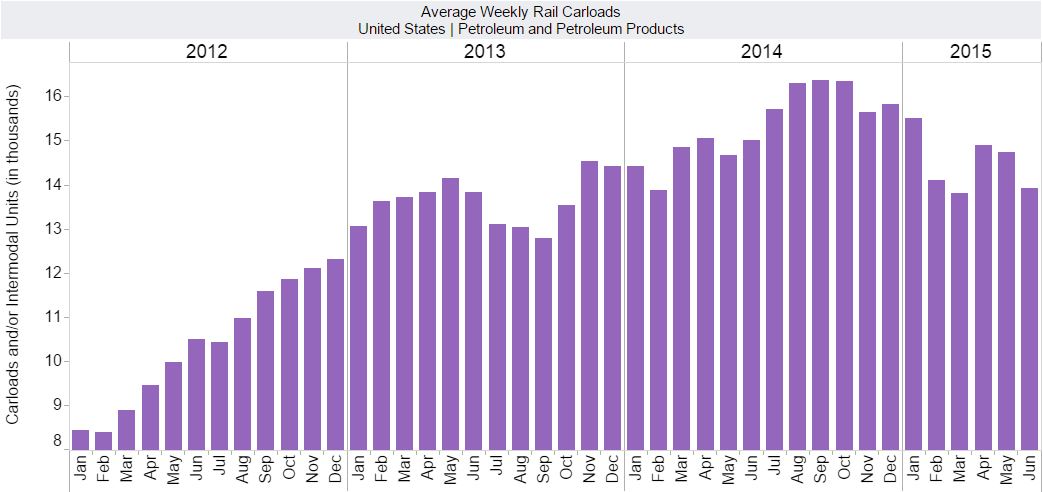
Weekly oil shipments by rail can be found on the web at Weekly Carload Reports. And a summation of that data with charts can be found at Association of American Railroads Freight Rail Traffic Data.
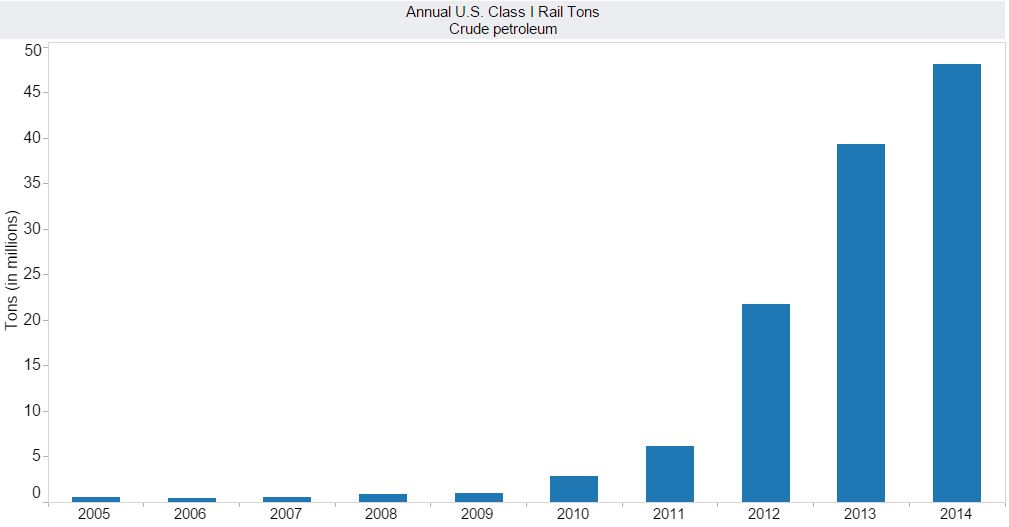
Crude oil by rail basically started with the shale boom. Prior to that almost all oil was shipped by pipeline. Of course a lot of oil was trucked to the pipelines. The EIA says in the first seven months of 2014 8 percent of all us crude and refined products was shipped by rail. It looks like that percentage was increased somewhat in the second half of 2014.
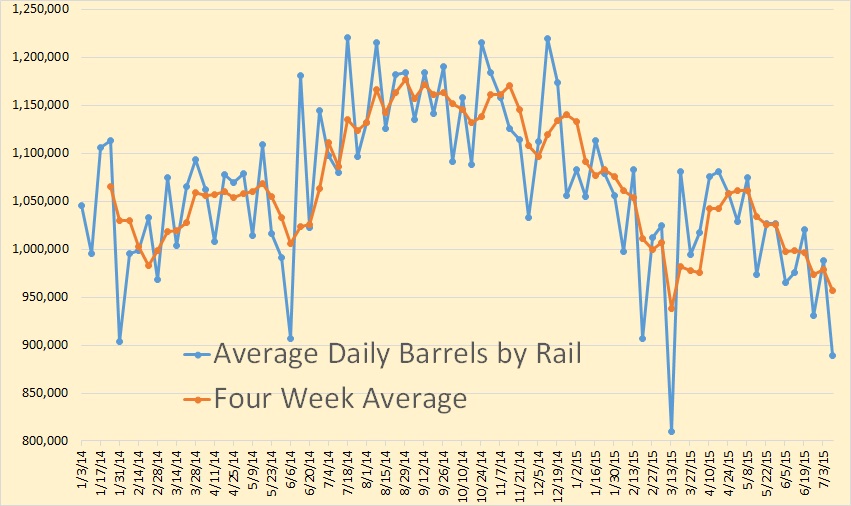
Oil by rail, for the entire USA, peaked in August, September and October of 2014 and has declined since.
I have converted the weekly carloads to daily then converted carloads to barrels. There are about 700 barrels per carload. That gives us the average barrels per day by rail.
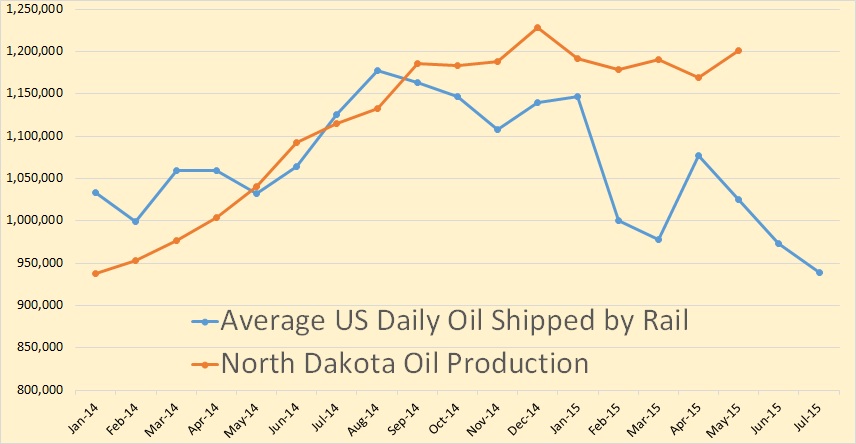
I have converted the weekly “daily average” to monthly “daily average” and plotted it against the North Dakota production. The EIA says: Between 60% and 70% of the more than 1 million barrels per day of oil produced in the state has been transported to refineries by rail each month in the first half of 2014, according to the North Dakota Pipeline Authority.
As we can see from this chart the volume of oil shipped by rail changes from month to month. The chart is barrels per day per month. The peak, for North Dakota, is December 2014. Oil by rail for the USA peaked about three months earlier.
…click on the above link to read the rest of the article…
