Home » Posts tagged 'us federal reserve' (Page 9)

Tag Archives: us federal reserve

Olduvai
Click on image to purchase

Olduvai III: Catacylsm
Click on image to purchase

Post categories

Post Archives by Category

Response: Money and Payments: The US Dollar in the Age of Digital Transformation

Implications from the Federal Reserve’s Paper

Our first comment is that every monetary change from the Founding of America through present has been to move away from free markets, and to adulterate our currency. An analogy could be made to the Ship of Theseus, with each good plank replaced with an unsound board. A Zombie Ship of Theseus, decaying, but still afloat.

Let’s walk through the Fed’s paper. The very firstparagraphon page 1 says, “The Federal Reserve, as the nation’s central bank, works to maintain the public’s confidence by fostering monetary stability, financial stability…”

Monetary stabilityis defined as2% debasement per annum, an Orwellian twist. Andfinancial stabilityin the Fed’s regime is a myth.Interest rates shot the moon between 1947 and 1981, and since then have been falling—with volatility—into the black hole of zero.Meanwhile debt grows exponentially, and the marginal productivity of debt—how much GDP is added for each new dollar of debt—falls decade after decade. It is not only unstable, but unsustainable, heading towards an ultimate heat death of the economic universe.

“CBDC is defined as a digital liability of a central bank that is widely available to the general public.” In other words, it’s like holding a paper dollar bill except it’s digital. Which implies several things:

  • The Fed could muscle out the banks from the demand deposits business
  • The Fed could buy all the assets, which the banks now finance with demand deposits
  • Thus, money and payment services could become more socialized
  • The government could declare paper is no longer legal tender, thus forcing everyone into CBDC
  • The government could track who spends their CBDC, and what they buy
  • This spending data could be used in a social credit score system

…click on the above link to read the rest of the article…

Inflation Is The Kryptonite That Will End Our Decades-Long Monetary Policy Ponzi Scheme

Inflation Is The Kryptonite That Will End Our Decades-Long Monetary Policy Ponzi Scheme

“It means buckle your seatbelt Dorothy, because Kansas is going bye-bye.”

The linchpin that allows the world’s nefarious central banking model to be so effective is that the commonfolk – the plumber, the electrician, the teacher, the bartender, bus driver or barber – don’t understand it.

Countless times, I have reminded my readers and listeners that the inflationary “machinery of night” blankets the most regressive tax possible upon the people who can least afford it, and does so in an extraordinarily convenient way for elites, politicians, central bankers and central planners whose titles and “jobs” hinge upon nobody questioning them and/or figuring out how the system works in the first place.

Today, the fabric of our modern banking world is held together by a logical fallacy of a system, wherein central banks are afforded the asinine luxury of being able to print infinite amounts of “money”, which is then disproportionately distributed toward the ruling class, billionaires, and elites, instead of the people who need it the most.

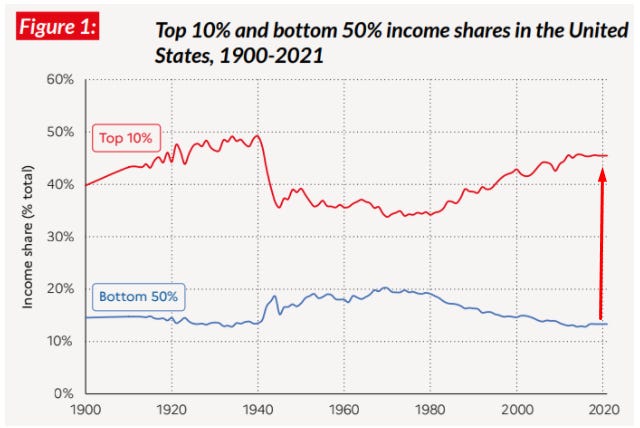
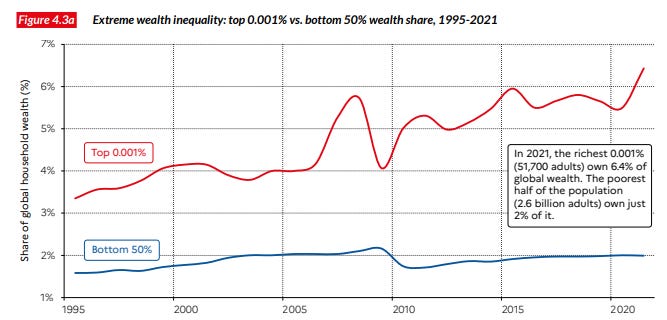
This shows up, literally, as a widening gap between the “haves” and the “have nots” that has widened consistently since the late 1970’s.

As a result of the most recent re-distribution of purchasing power disguised as “monetary stimulus” during the Covid-19 “crisis”, billionaires amassed an additional $4.1 trillion of wealth during a period of time in which the World Bank estimates that “some 100 million people have fallen into extreme poverty,” Bloomberg reported, in conjunction with the World Inequality Report, in December.

As I have asked many times, when the Fed considers stimulating by printing trillions: why not just divide up the money evenly amongst everybody in the country? Why must it be re-balanced and then deployed in a fashion that benefits those who already own financial assets?

…click on the above link to read the rest of the article…


The Mayhem Below the Surface of the Stock Market Seeps to the Surface: Now it’s the Giants that Topple

The Mayhem Below the Surface of the Stock Market Seeps to the Surface: Now it’s the Giants that Topple

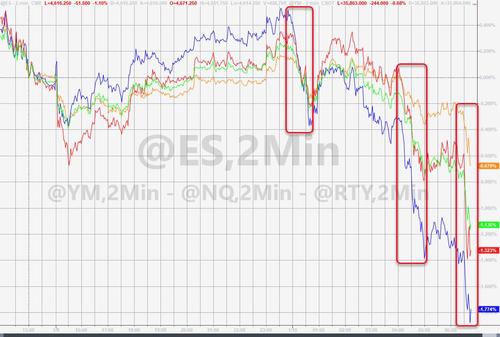
The market finally gets it: The Fed is going to tighten to get a handle on its massive inflation problem.

Since February last year, the hottest most hyped stocks, many of them recent IPOs and SPACS, have been taken out the back and brutalized, either one by one or jointly. The stocks that have by now crashed 60%, 70%, 80%, or even 90% from their highs include luminaries such as Zoom, Redfin, Zillow, Compass, Virgin Galactic, Palantir, Moderna, BioNTech, Peloton, Carvana, Vroom, Chewy, the EV SPAC & IPO gaggle Lordstown Motors, Nikola, Lucid, and Rivian, plus dozens of others. Some of these superheroes are tracked by the ARK Innovation Fund, which has crashed by 55% from its high last February.

This mayhem has been raging beneath the surface of the market since February last year, and in March, I mused, The Most Hyped Corners of the Stock Market Come Unglued. They have since then come unglued a whole lot more. But the surface itself remained relatively calm and the S&P 500 Index set a new high on January 3 this year because the biggest stocks kept gaining or at least didn’t lose their footing.

But now even the giants too are going over the cliff. Combined by market cap, the seven giants, Apple [AAPL], Amazon [AMZN], Meta [FB], Alphabet [GOOG], Microsoft [MSFT], Nvidia [NVDA], and Tesla [TSLA] peaked on January 3, and in the 13 trading days since then have plunged 13.4%. $1.6 trillion in paper wealth vanished (stock data via YCharts):

This is obviously still no big deal, a 13.4% decline, after this huge gigantic run-up. During the March 2020 crash, these giants plunged 28%. But it’s the first time since then that this unappetizing event has occurred.

…click on the above link to read the rest of the article…
Choose One, But Only One: Defend the Billionaire’s Bubble or the U.S. Dollar and Empire

Choose One, But Only One: Defend the Billionaire’s Bubble or the U.S. Dollar and Empire

The Empire is striking back, protecting what really counts, and the Billionaire Bubble sideshow is folding its tents.

One of the most enduring conceits of the modern era is that the Federal Reserve acts to goose growth and therefore employment while keeping inflation moderate (whatever that means–the definition is adjustable). This conceit is extremely handy as PR cover: the Fed really, really cares about little old us and expanding our ballooning wealth.

Nice, except it doesn’t. The Fed’s one real job is defending the U.S. dollar, which is the foundation of America’s global hegemony a.k.a. The Empire.

One thing and one thing alone enables global dominance: being able to create “money” out of thin air and use that “money” to buy real stuff in the real world. The nations that can create “money” out of thin air and trade it for magnesium, oil, semiconductors, etc. have an unbeatable advantage over nations that must actually mine gold or make something of equal value to trade for essentials.

The trick is to maintain global confidence in one’s currency. There is no one way to manage this, as confidence in a herd animal such as human beings is always contingent. Once the herd gets skittish, all bets are off.

The herd is exquisitely sensitive to movements on the edge of the herd, where threats arise. There are various tricks one can deploy to maintain confidence: pay a higher rate of interest on bonds denominated in one’s currency, so global capital flows into your currency; treat this capital well with a transparent set of tax laws and judiciary / regulatory oversight, maintain a deep pool of liquidity so capital can enter and exit without stampeding the herd, and having at least a semi-productive, diverse economy that generates goods, services and income streams to support the currency.

…click on the above link to read the rest of the article…
Peter Schiff: The Fed Made This Bed and Now We Have to Lie In It

Peter Schiff: The Fed Made This Bed and Now We Have to Lie In It

Inflation is running hot. Economic data is running cold. Stocks and bonds are under pressure. The Fed is scrambling. In his podcast, Peter Schiff talked about the trajectory of the economy. He said we’re on the cusp of the most obvious crisis that virtually nobody saw coming. The Federal Reserve made this bed. Now we have to lie in it.

Stocks and bonds are off to a rough start in 2022 with the expectation of rate hikes on the horizon. In fact, many analysts now think that the Fed could raise interest rates five times in 2022. And some also think the first hike in March could be 50 basis points.

Hedge fund manager Bill Ackman called a .5% rate hike “shock and awe.”

Peter called this “ridiculous.”

It’s not shock and awe. When you’re talking about 7% inflation, a move from zero to 50 basis points is still recklessly low interest rates. And for a Fed that’s actually serious about fighting inflation, raising interest rates to 50 basis points is not nearly enough for the task at hand.”

Even so, a .5% rate hike could have a profound impact and pop the bubble economy.

Given the incredible amount of leverage that’s in the system, a 50 basis point rate hike can still do a lot of damage. And I think Bill Ackman is underestimating the extent of the damage. But not just the damage from the initial hike, but from all the subsequent hike, which aren’t going to do any good about slowing down this inflation freight train.”

Peter noted the price of oil hit has continued its upward trajectory this week. The price of oil is at a seven-year high with plenty of room to keep running up. In 2021, a lot of producers ate their rising costs

…click on the above link to read the rest of the article…

Fed Chair Faces the Ultimate Lose-Lose Decision

Fed Chair Faces the Ultimate Lose-Lose Decision

Photo by Vadim Sadovski

The U.S. economy teeters between two catastrophes: wild and untamed hyperinflation that turns cash into wallpaper, or an epic crash that would make 2008 look like a day at the beach. Federal Reserve Chairman Jerome Powell has led the U.S. government’s monetary policy to this point.

Now he’s attempting a nearly impossible feat…

He will need to thread the needle between the two economic disasters, between the frying pan and the fire, to return the U.S. economy to any form of sustainable prosperity.

Is that kind of miracle even possible?

The frying pan: 40-year-record-high inflation

We will start with the obvious issue: December’s inflation report of 7% year-over-year price increases. That’s at the end an entire year where inflation rose steadily for eleven of twelve months. August, the exception, saw a 0.1% decline.


Source

In addition, what Powell endlessly assured us was merely “transitory” inflation, a “blip,” caused by “supply chain snarls” and so on? It’s the highest we’ve seen in 40 years.

Most of our readers who have a little gray in their hair may remember how grim the stagflationary crisis of the late 70s and early 80s was. However, the average American is only 38 years old. They most likely have no idea what we’re facing, even while watching their personal expenses go up month after month.

And make no mistake, those expenses have gone up quite a bit for virtually everyone.

The Bureau of Labor and Statistics (BLS) report revealed the prices that rose the most in December 2021 :

  • Gasoline +49.6%
  • Fuel oil, and other fuels for heating +48.9% (just in time for the coldest days of winter, too)
  • Natural gas: +24.1%
  • Meats, poultry, fish, and eggs: +12.5%
  • Electricity: +6.3%
  • Housing +4.1%

If you find this list depressing, I’m afraid your solace isn’t immune to this trend… Distilled spirits (excluding whiskey) rose 3.4% in price.

…click on the above link to read the rest of the article…

Is Powell Again Pulling Strings From “The Shadows”?

Is Powell Again Pulling Strings From “The Shadows”?

Recently, we have seen stocks rally while the dollar falls. Some of us are wondering why the dollar is falling at the same time currency traders are busy penciling in as many as four interest rate increases. The ICE U.S. Dollar Index, a measure of the currency against a basket of six major rivals, was down 0.1% on Thursday hitting a two-month low. This drop leaves the dollar with a loss of 1.2% since the start of the new year.A more aggressive tightening of monetary policy and “hawkish” central bank intent on slowing inflation is generally seen as supportive to a currency. Is it possible Powell dropped the dollar to kick the stock market back up? I contend this is what is happening. Such a move has been used in the past. In volatile markets, like we have today ruled at times by emotions, the fear of missing out, and a slew of traders trained to buy the dip, it doesn’t take much to turn an ugly selling streak into a buying panic.

The combination of a sudden drop in the dollar just as the Fed starts talking about tapering and raising rates is difficult to understand. With most seasoned investors allergic to risk, logic would tend to make them view the coming Fed action as a strong headwind to markets going higher. At the same time, higher interest rates and less expansion of the Fed’s balance sheet generally moves the dollar higher.

While it could be argued the falling dollar simply reflects the coming recession into which the Fed is tightening, again I point to Powell as the great enabler…

…click on the above link to read the rest of the article…

It Has Been 7% Inflation Since 1996

It Has Been 7% Inflation Since 1996

And so finally, now fiat $USD financial authorities are being forced to admit we have at a minimum 7% price inflation annualized.

The issue, as per usual, is the real value loss truth is like twice that amount in terms of real purchasing power disappearances over the last twelve months.

To attain shreds of credibility, even some in the mainstream financial media now have to report how rigged the Bureau of Labor and Statistics (BLS) inflation tracking methodology is.

Of course, yet another deflationary global bankruptcy phase is likely to come about this decade.

Look for perhaps some cyber-attack excuse to cover yet more derivative bet loss insolvencies to come.

And when it does, it will likely turn these increasing-price inflationary pressure downwards for a brief timeframe as it did during the 2008 GFC and briefly, and too at the start of the 2020 pandemic.

Yet our financial authority’s most predictable response mechanism will likely be more seemingly ∞fiat currency∞ creation.

Ultimately and also by major central banks’ pre-meditated ‘Go Direct‘ actions. Secular inflation should remain persistent, reaching levels already now larger than perhaps ever before experienced in most of our lifetimes until significant structural issues of too much record-level fiat currency-denominated debt and unsaved promise piles get reckoned.

Over 7% Inflation Since 1996

The Fed Just Guaranteed a Stagflation Crisis in 2022 – Here’s How

The Fed Just Guaranteed a Stagflation Crisis in 2022 - Here Is How

Chair Powell leads a two day meeting of the Federal Open Market Committee (FOMC) held January 29-30th, 2019. Public domain photo courtesy of the Federal Reserve

I don’t think I can overstate the danger that the U.S. economy is in right now as we enter 2022. While most people are caught up in the ongoing drama of Covid-19, a real threat looms over the nation in the form of a stagflationary tidal wave. The mainstream media is attempting to place the blame on “supply chain disruptions,” but this is a misrepresentation of the issue.

The two factors are indeed intertwined, but the reality is that inflation is the cause of supply chain disruptions, not the result of supply chain disruptions. If we look at the underlying stats for price rises in essential products, we can get a clearer picture.

Before I get into my argument, I really want to stress that this is a truly dangerous time and I suggest that people prepare accordingly. In just the past few months I have seen personal expenses rise at least 20% overall, and I’m sure it’s the same or worse for most of you. Safe-haven investments with intrinsic value like physical precious metals are a good choice for protecting whatever buying power your dollars have left…

Higher prices everywhere

The Consumer Price Index (CPI) is officially at the highest levels in 40 years. CPI measurements often diminish the scale of the problem because they do not include things like food, energy and housing which are core expenses for the public. CPI calculations have also been “adjusted” over the past few decades by the government to express a more positive view on inflation…

…click on the above link to read the rest of the article…

Peter Schiff: The Fed Can’t Do What It’s Saying It Will Do

Peter Schiff: The Fed Can’t Do What It’s Saying It Will Do

The Fed FOMC minutes came out last week, signaling tighter monetary policy. Peter Schiff talked about the minutes in his podcast, arguing that the Fed can’t do what it says it’s going to do. If it does, it will crash the markets and the economy. And it won’t lower inflation.

The Fed minutes were widely viewed as even more hawkish than the messaging coming out of the December meeting. Peter said the minutes even surprised him a bit. But he reminded us that when he’s talking about a “hawkish” Fed, he’s not really talking about hawks.

They’re extinct. They may as well be the dodo bird at the Federal Reserve. Everybody is a dove. We’re just talking about degrees of dovishness. And so, the Fed was less dovish than the markets had expected.”

The minutes indicated we could now see four interest rate hikes this year. Three hikes were widely anticipated after the meeting. That would push rates up to about 1% by the end of the year. In the big scheme of things, and against the backdrop of the current economic data, that’s not a lot.

You cannot describe those itsy-bitsy moves in any way ‘hawkish.’”

But comments regarding quantitative tightening – shrinking the balance sheet – really roiled the markets.

In other words, they’re going to go from being a massive buyer in US Treasuries and mortgage-backed securities to a seller of those securities. And that’s what really spooked the markets. Because that sent the bond markets tanking.”

Yields on the 10-year Treasury hit a 52-week high and briefly pushed above 1.8%.

If the Fed is going to shift from buying bonds to selling, clearly, that will put heavy pressure on the bond market. But Peter said there is one thing that the markets don’t seem to comprehend.

…click on the above link to read the rest of the article…

“Minsky Moments Almost Certainly Await”: Nomura Fears ‘Collateral’ Damage From The QE-to-QT Transition

“Minsky Moments Almost Certainly Await”: Nomura Fears ‘Collateral’ Damage From The QE-to-QT Transition

“Minsky Moments” almost certainly await, warns Nomura’s Charlie McElligott in his latest note as he reflects on a massive week ahead for markets.

With Powell testimony and bunches of Fed speakers, along with US economic releases headlined by the market’s most important datapoint in the CPI release Wednesday, in addition to PPI, Retail Sales and Consumer Sentiment over the course of the week, plus two Duration-heavy auctions ($36B of 10Y and $22B 30Y, on top of tomorrow’s $52B 3Y),… and finally, US corporate earnings season kickoff (highlighted by JPM, C and WFC this upcoming Friday), it is no wonder that investors are degrossing still…

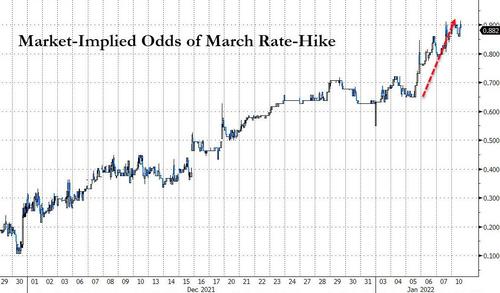
While the long-end of the curve is reversing modestly – after some more ugliness overnight – STIRs continue to grind hawkishly higher with March now consolidating around a 90% chance of a rate-hike

McElligott raises some worries of a rapid ‘reversal’ risk in bonds – via “market tantrum” forcing the Fed to yet-again “Bend the Knee” – as market positioning in bonds is extreme to say the least.

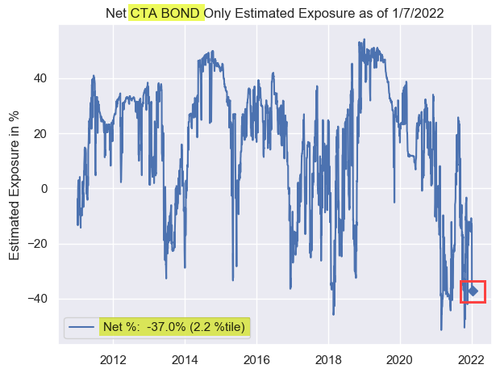
Looking at the QIS CTA Trend model to get a sense of the “bearish momentum” and asymmetry within Fixed-Income positioning, we currently see the net exposure across G10 Bonds is back to 10 year historical “extreme Short” at just 2.2%ile overall exposure since 2011; further, the aggregate $notional position across the agg G10 Bond positions is now greater that -2 SD rank (i.e. very “net Short”) dating all the way back to 2002.

Similarly, the Nomura MD notes that eventually, the more this selloff in legacy long / crowded hyper Growth Tech extends, there is ultimately a mounting risk of a sharp counter-trend rally in beaten-down Nasdaq, particularly considering the extremely magnitude of the Dealer “short Gamma” profile in QQQ ($Gamma -$476mm, 3.4%ile since 2013…

…click on the above link to read the rest of the article…

The Economy May Be Finally Peaking, and the Fed Won’t Help Matters

Here we go again it may seem to many. The Fed is preparing us for a policy tightening just when a powerful growth cycle upturn is faltering. Or is it in fact an example of another well-known type of error from Fed history—getting behind the curve of rising inflation? The most plausible answer is that it is neither.

Instead, the huge monetary inflation shock which the Fed has administered so far in this pandemic means that the “normalization steps” now in prospect for 2022 are all but irrelevant to macroeconomic prospects or asset market price trajectories.

The more Federal Reserve chief Jerome Powell has been huffing and puffing, since his renomination (November 22), about normalizing policy, the steeper has been the fall in long-term interest rates. In the first two trading weeks following the renomination, the ten-year yield on US Treasurys was down by thirty basis points to 1.35 percent. A coincidence, surely, explained in part by the possible Omicron menace? Yes, perhaps in part, but not altogether.

The chief’s performance is now in the theater of the absurd. Many in the marketplace have deserted the audience, though the noise still irritates them. Instead, they focus on the drama of monetary reality. The title? “Lost Illusions on the Journey from Mega Pandemic Inflation to Great Depression.” The evolving mood of the audience here will have a powerful effect on financial markets and ultimately the global economy.

Toward understanding the theater of the absurd and its triviality, recall the story of the natural history museum renowned for its dinosaur relics. The guardian there, quizzed by a child as to the age of those specimens, answers: 5 million years and 90 days. How so? Because when he started work there, around three months ago, he was told their age was 5 million years!

…click on the above link to read the rest of the article…

Weekly Commentary: 2021 Year in Review

Weekly Commentary: 2021 Year in Review

Books will be written chronicling 2021. I’ll boil an extraordinary year’s developments down to a few simple words: “Things Ran Wild”. Covid ran wild. Monetary inflation ran wild. Inflation, in general, ran completely wild. Speculation and asset inflation ran really wild. More insidiously, mal-investment and inequality turned wilder. Extreme weather ran wild. Bucking the trend, confidence in Washington policymaking ran – into a wall.
Covid running wild. With the hope for vaccines and a waning pandemic, few anticipated the tragedy of more than 475,000 Covid deaths (exceeding 2020). As the year comes to its conclusion, we are shocked by daily new cases exceeding 500,000 – and two million for the week. Globally, daily cases exceed two million.

Inflation running wild. CPI surged 6.8% y-o-y in November, the strongest consumer price inflation since June 1982. Core PCE, the Fed’s favored inflation gauge, rose above 6% for the first time since 1983. Surging food and energy prices, in particular, punish those who can least afford it.

Monetary inflation running wild. Federal Reserve Credit expanded $1.391 TN over the past year, or 19%, to a record $8.742 TN. The Fed’s balance sheet inflated an astonishing $5.015 TN, or 135%, in the 120 weeks since QE was restarted in September 2019. Federal Reserve Assets have now inflated 10-fold since the mortgage finance Bubble collapse.

M2 “money” supply inflated another $2.478 TN (12 months through November) to a record $21.437 TN – with egregious two-year growth of $6.185 TN, or 40.6%. Bank Deposits surged $1.957 TN over the past year (12.1%), with two-year growth of $4.812 TN (36%). Money Fund Assets rose another $408 billion y-o-y, or 9.5%, to $4.70 TN. The myth that QE effects remain well contained within Treasury and securities markets has been debunked.

In the seven pandemic quarters through Q3 2021, Non-Financial Debt surged $9.183 TN, or 16.8%, in history’s greatest Credit expansion.
…click on the above link to read the rest of the article…

The Economy May Be Finally Peaking, and the Fed Won’t Help Matters

Here we go again it may seem to many. The Fed is preparing us for a policy tightening just when a powerful growth cycle upturn is faltering. Or is it in fact an example of another well-known type of error from Fed history—getting behind the curve of rising inflation? The most plausible answer is that it is neither.

Instead, the huge monetary inflation shock which the Fed has administered so far in this pandemic means that the “normalization steps” now in prospect for 2022 are all but irrelevant to macroeconomic prospects or asset market price trajectories.

The more Federal Reserve chief Jerome Powell has been huffing and puffing, since his renomination (November 22), about normalizing policy, the steeper has been the fall in long-term interest rates. In the first two trading weeks following the renomination, the ten-year yield on US Treasurys was down by thirty basis points to 1.35 percent. A coincidence, surely, explained in part by the possible Omicron menace? Yes, perhaps in part, but not altogether.

The chief’s performance is now in the theater of the absurd. Many in the marketplace have deserted the audience, though the noise still irritates them. Instead, they focus on the drama of monetary reality. The title? “Lost Illusions on the Journey from Mega Pandemic Inflation to Great Depression.” The evolving mood of the audience here will have a powerful effect on financial markets and ultimately the global economy.

Toward understanding the theater of the absurd and its triviality, recall the story of the natural history museum renowned for its dinosaur relics. The guardian there, quizzed by a child as to the age of those specimens, answers: 5 million years and 90 days. How so? Because when he started work there, around three months ago, he was told their age was 5 million years!

…click on the above link to read the rest of the article…

My “Wealth Effect Monitor” & “Wealth Disparity Monitor” for the Fed’s Money-Printer Economy: December Update

My “Wealth Effect Monitor” & “Wealth Disparity Monitor” for the Fed’s Money-Printer Economy: December Update

Billionaires got more billions, bottom half of Americans got peanuts and inflation.

My “Wealth Effect Monitor” uses the data that the Fed releases quarterly about the wealth of households. The Fed, after having released the overall data for the third quarter earlier in December, has now released the detailed data by wealth category for the “1%,” the “2% to 9%,” the “next 40%” (the top 10% to 50%) and the “bottom 50%.”

Wealth here is defined as assets minus debts. The wealth of the 1% ($43.9 trillion, according to the Fed) is owned by 1% of the population. The wealth of the “bottom 50%” (only $3.4 trillion) gets split across half the population. My Wealth Effect Monitor takes this a step further and tracks the wealth of the average household in each category.

The average wealth in the 1% category ticked up by only $121,000 in Q3 from Q2, after skyrocketing over the prior five quarters, to $34,478,000 per household (red line). In the bottom 50% category, the average wealth ticked up by $6,800 $53,600 (green line). And get this: About half of that “wealth” at the bottom 50% is the value of consumer durable goods such as cars, appliances, etc. Even the top 2% to 9% (yellow), have been totally left behind by the explosion of wealth at the 1%:

Note the immense increase in the wealth for the 1% households, following the Fed’s money-printing scheme and interest rate repression in March 2020.

A household is defined by the Census Bureau as the people living at one address, whether they’re a three-generation family or five roommates or a single person. In the third quarter, there were 127.4 million households in the US, per Census estimates.

…click on the above link to read the rest of the article…

Olduvai IV: Courage
Click on image to read excerpts

Olduvai II: Exodus
Click on image to purchase

Click on image to purchase @ FriesenPress