European oil consumption after North Sea Peak Oil
Hors-d’oeuvre
On the streets of Paris: 24 Nov 2018
 Fuel price protests on the Champs Elysees
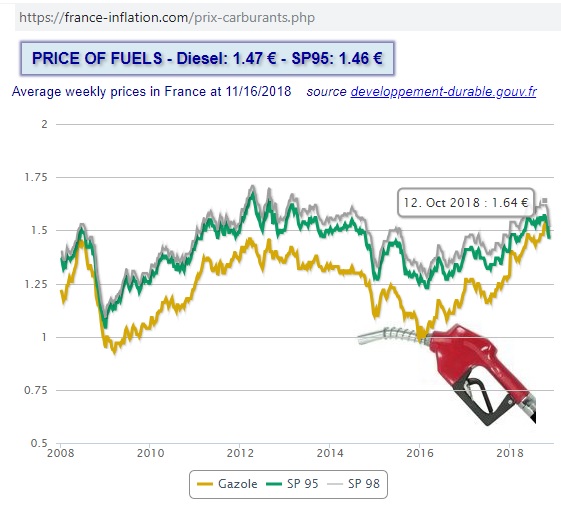 https://france-inflation.com/prix-carburants.php

20 Nov 2018: The “gilets jaunes” have a hard time to convince truck drivers to join their movement
https://www.francetvinfo.fr/economie/transports/prix-des-carburants/gilets-jaunes-les-routiers-divises_3045615.html
They were more successful on the French island of Réunion in the Indian Ocean, where blocked roads and petrol rationing resulted in empty supermarket shelves, highlighting how vulnerable our just-in-time society is.
 25/11/2018 Road blocks in Réunion
https://www.linfo.re/la-reunion/societe/barrages-le-point-sur-le-reseau-routier
 Petrol lines in St Denis, €20 rationing, shops closed, shelves emptying, medical supply disruptions
https://www.francetvinfo.fr/economie/automobile/essence/la-reunion-une-ile-asphyxiee_3048073.html
Oil statistics
European oil production peaked in 2000 at almost 7 mb/d, with a production plateau above 6.8 mb/d lasting for 7 years between 1996 and 2002. 17 years after the peak, production was around half of what it was at peak.
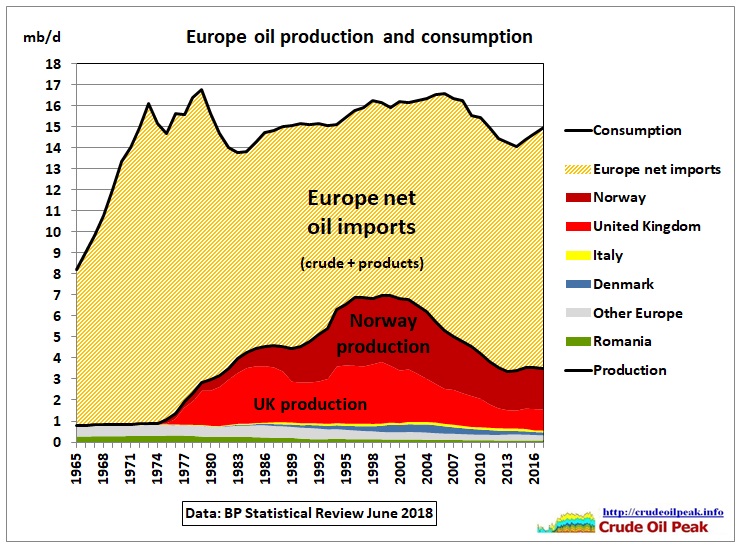 Fig 1: Europe oil consumption, net oil imports and production
BP’s definitions are as follows: “Oil production includes crude oil, shale oil, tar sands and NGLs (natural gas liquids – the liquid content of natural gas where this is recovered separately). It excludes liquid fuels from other sources such as biomass and derivatives of coal and natural gas.
Oil consumption is from inland demand plus international aviation and marine bunkers and refinery fuel and loss. Consumption of biogasoline (such as ethanol), biodiesel and derivatives of coal and natural gas are also included.
Notes: Differences between these world consumption figures and world production statistics are accounted for by stock changes, consumption of non-petroleum additives”
In Fig 1 and 3, net oil imports are calculated as the difference between production and consumption.
…click on the above link to read the rest of the article…