All Roads Lead To Peak Oil
I use the Canadian National Energy Base data for Canada instead of the strange numbers JODI has for Canada. And I use the EIA data for the few small producers that JODI does not report.
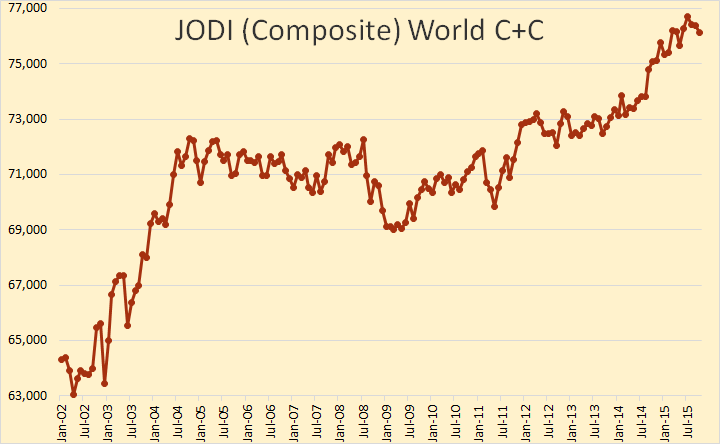
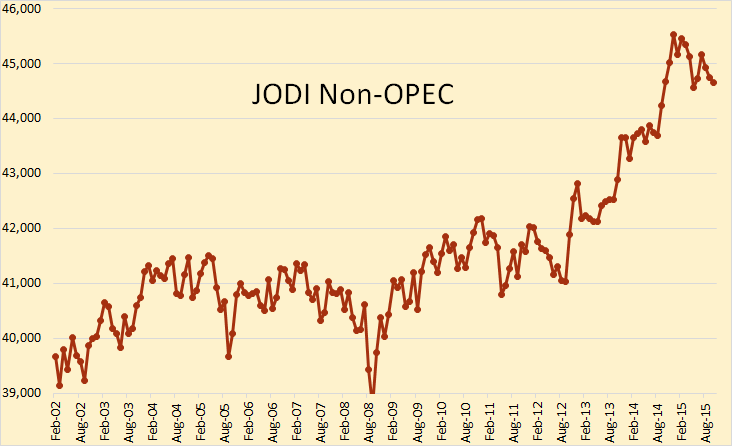
With these Changes I think I have composed an excellent World Oil Database from this composite data. And with the October data just released I have composed the below charts. The data is through October and is in thousand barrels per day.
World oil production peaked, so far, in July at 76,702,000 barrels per day and in October stood at 76,128,000 bpd or 574,000 bpd below the peak.
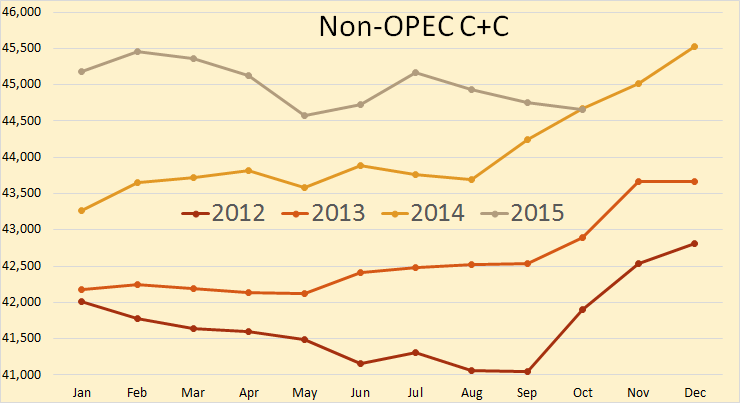
Non-OPEC peaked, so far, in December 2014 at 45,530,000 bpd and in October stood at 44,662,000, down 868,000 bpd or just under 2% in 10 months.
For the first time in 4 years Non-OPEC production has dropped below the level it was the same month the previous year. This means the 12 month trailing average has turned negative, though just barely.
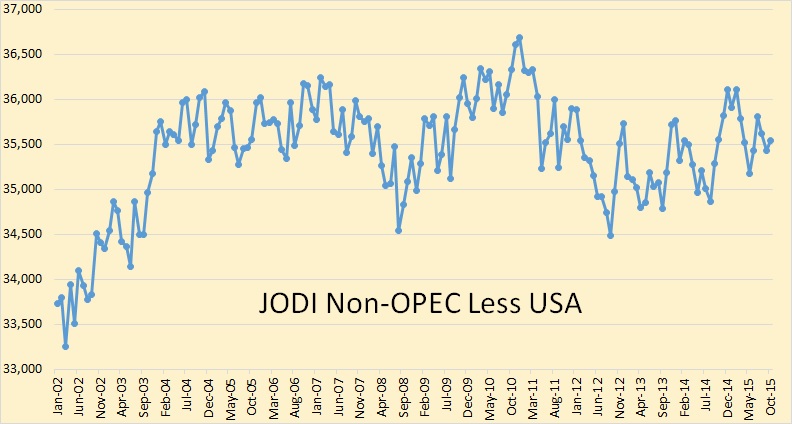
Non-OPEC less the USA has been on a 12 year bumpy plateau. In fact it stood at 35,422,000 barrels per day in October, 214,000 bpd less than the level reached in December 2003.
…click on the above link to read the rest of the article…


