Home » Posts tagged 'peak oil barrel' (Page 9)

Tag Archives: peak oil barrel

Olduvai
Click on image to purchase

Olduvai III: Catacylsm
Click on image to purchase

Post categories

Post Archives by Category

Bakken Flat but the EIA Predicts Decline

Bakken Flat but the EIA Predicts Decline

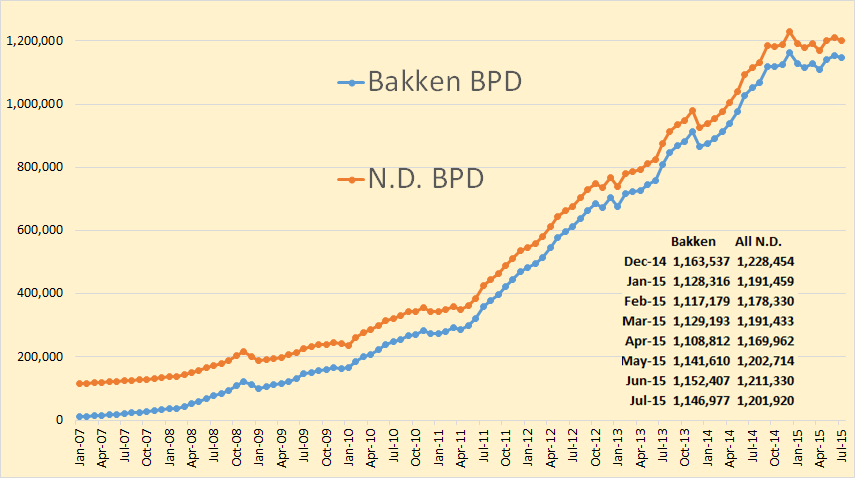
Bakken

Bakken production was down 5,430 barrels per day while all North Dakota was down 9,410 bpd.

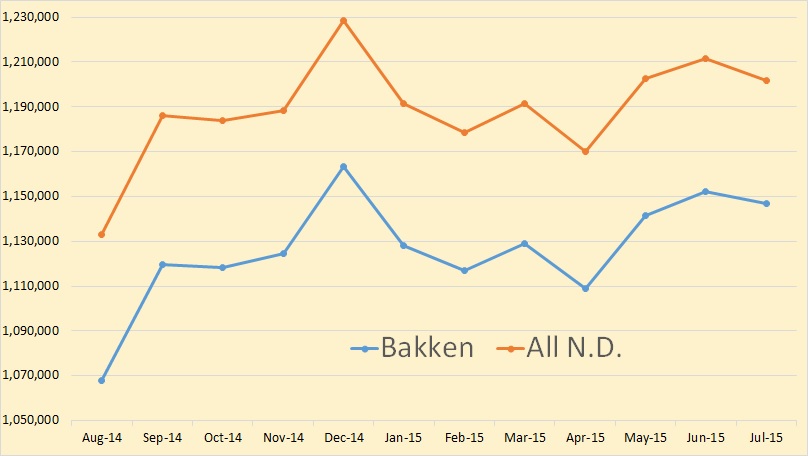
Bakken Amplified

Here is a more amplified view of what has happened during the last 12 months.

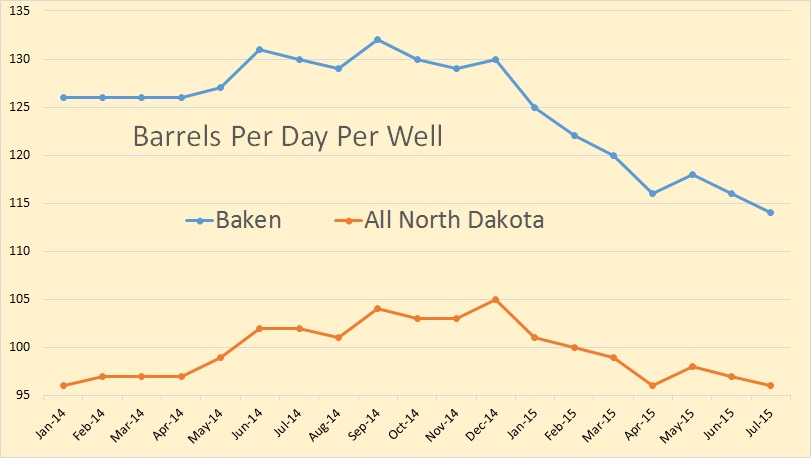
Bakken BPD Per Well

Bakken barrels per day per well has been falling faster than for all North Dakota. This is because a lot of very low producing conventional wells are being shut down.

…click on the above link to read the rest of the article…


OPEC August Production Flat

OPEC August Production Flat

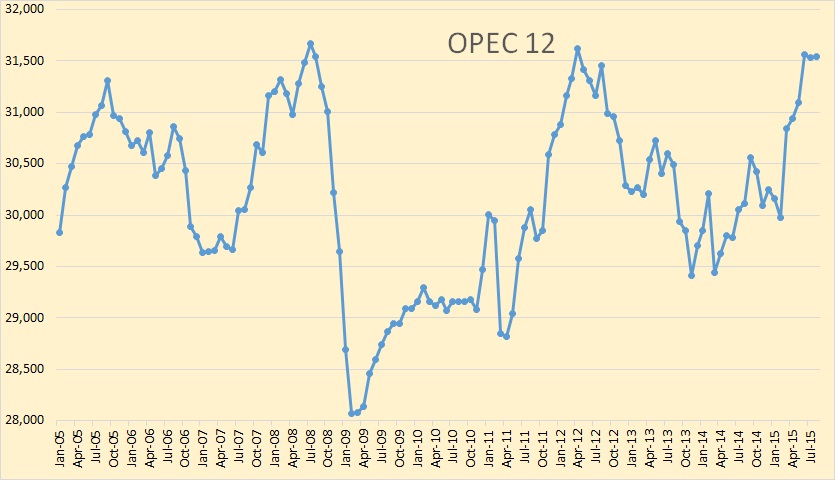
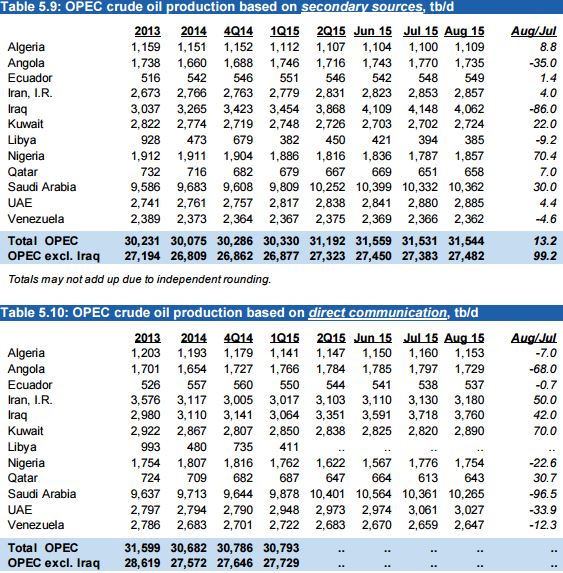
All charts below are in thousand barrels per day with the last data point August 2015.

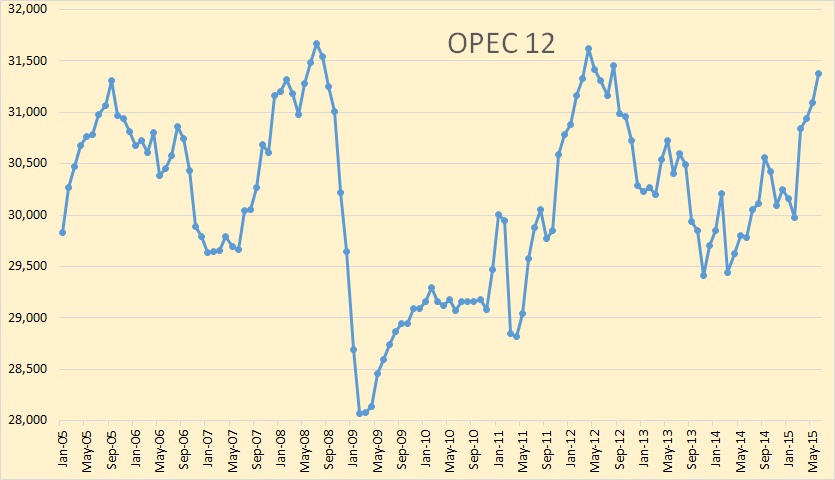
OPEC 12

Not much has happened since June, OPEC 12 production was up 12,000 bpd in August that is well within the margin of error.

Secondary Sources

All my charts are taken from what OPEC calls “secondary sources” OPEC nations, especially Iran and Venezuela, often lie about their production. But from the chart above you can see exactly who was up and who was down in August, and by how much.

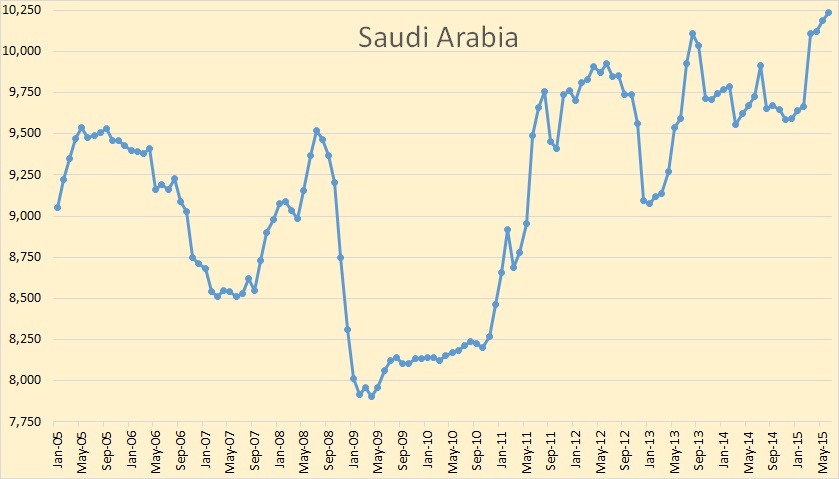
Saudi Arabia

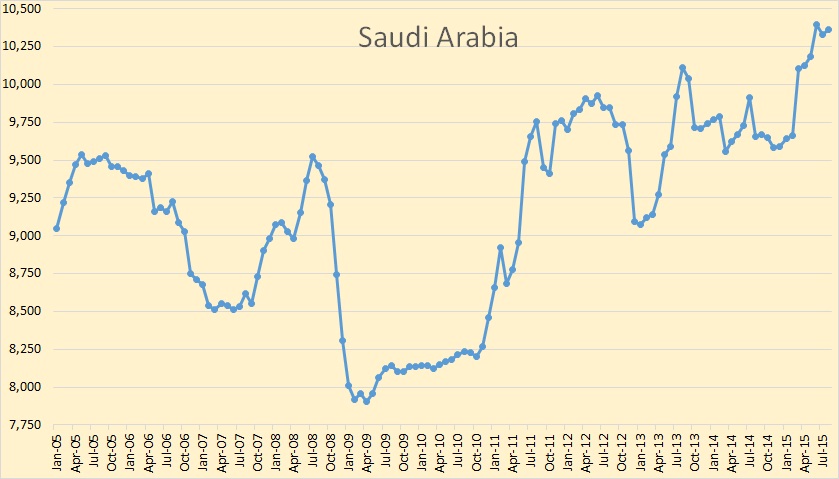
Saudi is holding steady, producing 10,362,000 barrels per day in August. However Saudi is up 700,000 bpd since February.


…click on the above link to read the rest of the article…

The EIA Changes Data Collection Methods

The EIA Changes Data Collection Methods

With the release of today’s  Petroleum Supply Monthly, EIA is incorporating the first survey-based reporting of monthly U.S. crude oil production statistics. Today’s Petroleum Supply Monthly includes estimates for June 2015 crude oil production using new survey data for 13 states and the federal Gulf of Mexico, and revises figures previously reported for January through May 2015.

From the EIA’s Monthly Crude Oil and Natural Gas Production webpage.

Beginning with the June 2015 data, EIA is providing estimates for crude oil production (including lease condensate) based on data from the EIA-914 survey. Survey-based monthly production estimates starting with January 2015 are provided for Arkansas, California, Colorado, Kansas, Louisiana, Montana, New Mexico, North Dakota, Ohio, Pennsylvania, Texas, Utah, Wyoming, and the Federal Gulf of Mexico. For two states covered by the EIA-914—Oklahoma and West Virginia—and all remaining oil-producing states and areas not individually covered by the EIA-914, production estimates are based on the previous methodology (using lagged state data). When EIA completes its validation of Oklahoma and West Virginia data, estimates for these states will also be based on EIA-914 data. For all states and areas, production data prior to 2015 are estimates published in the Petroleum Supply Monthly. Later in 2015, EIA will report monthly crude oil production by API gravity category for the individually-surveyed EIA-914 states.

This is great news for those of us who have been complaining for years about the EIA’s poor and misleading data collection methods.Petroleum Supply Monthly

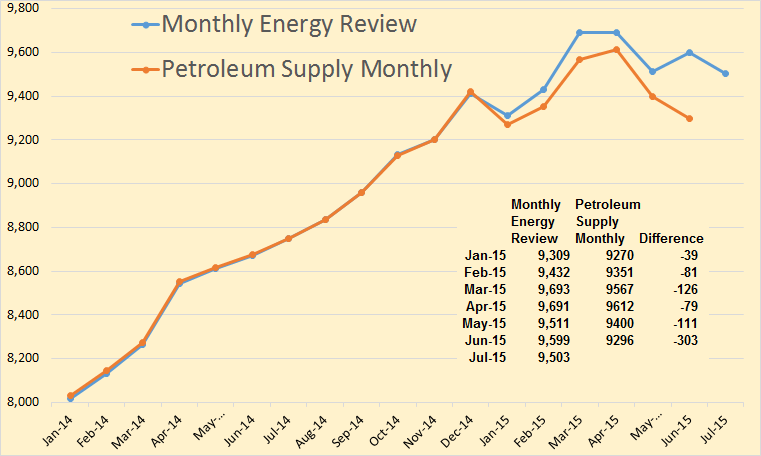
June C+C production, according to the Monthly Energy Review, was almost 9.6 million barrels per day. But the Petroleum Supply Monthly cuts that by 303,000 bpd. And they have production dropping by 316,000 barrels per day in the last two months, May and June.


…click on the above link to read the rest of the article…

US Oil Production Nears Previous Peak

US Oil Production Nears Previous Peak

Consumption

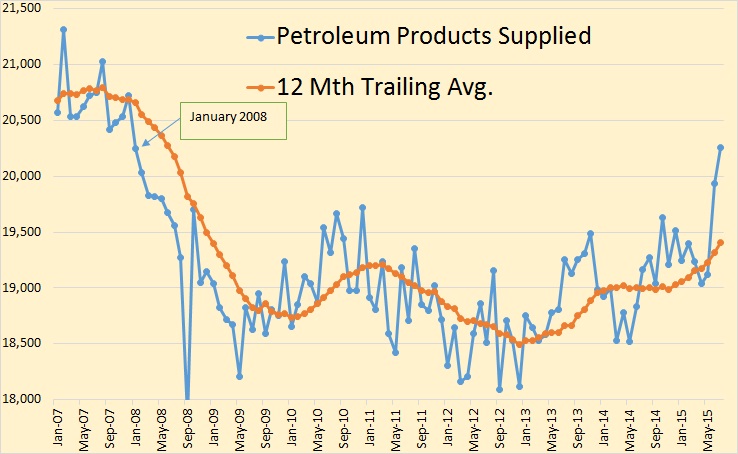
US consumption of total liquids, or as the EIA calls it, petroleum products supplied, reached 20,000,000 barrels per day for the first time since February of 2008.

Something I never noticed before, consumption started to drop in January 2008, seven months before the price, along with world production, started to drop in August 2008. This had to be a price driven decline. Could the current June and July increase in consumption be price driven also?
US Recent

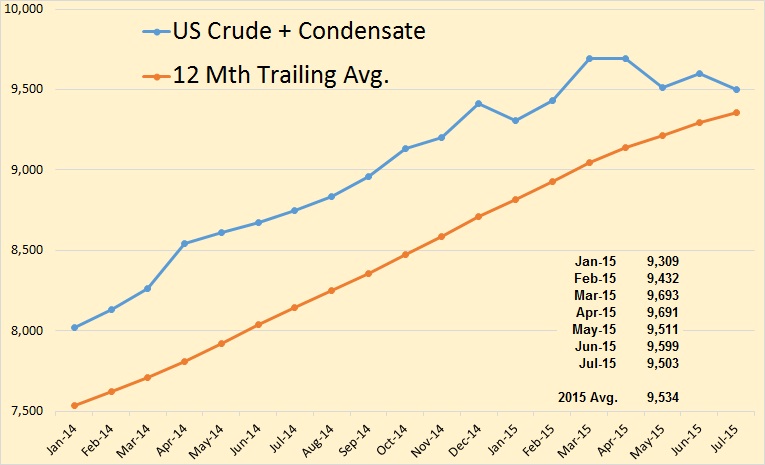
US Production was down 96,000 barrels per day in July to 9,503,000 bpd. That is 190,000 bpd below the March level of 9,693,000 bpd.
US Crude Oil Production

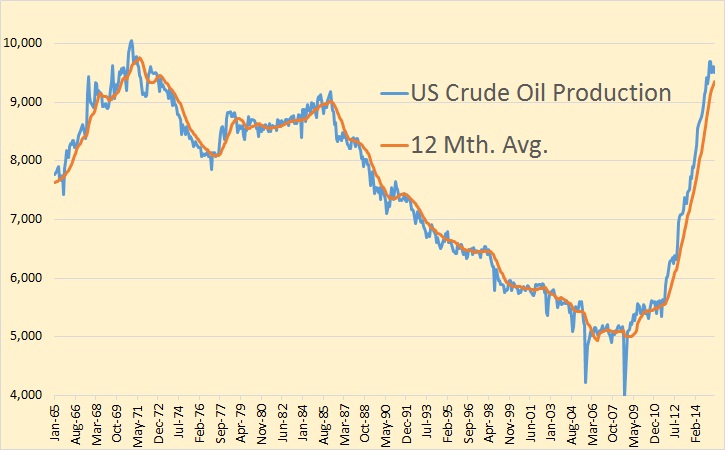
Here is what the last 50 years of US production looks like. The peak was in 1970 or 1971, depending on what you call the peak.
US 70 - 71

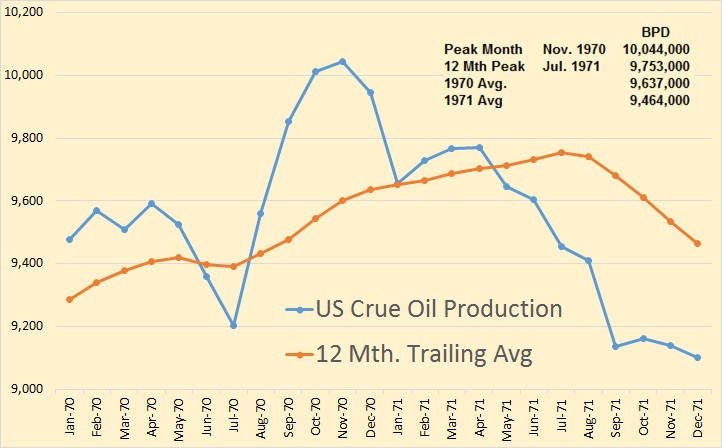
In March 2015 we were still 351,000 barrels per day below the peak month of 10,044,000 bpd in November of 1970. But right now we are headed in the wrong way to break that record. In July we were 541,000 bpd from that record. Right now the 2015 average, January through July, is 9,534,000 bpd. That is 103,000 barrels per day below the 1970 average. But the 2015 average is likely to get smaller as the year plays out.

I have another chapter from Peter Goodchild’s Tumbling Tide: Population, Petroleum, and Systemic CollapseI really like this book. The author comes closest to matching my sentiments than anyone I have read to date.

Tumbling Tide Chapter 10

The Pollyanna Principle

The problem of explaining peak oil does not hinge on the issue of peak oil as such, but rather on that of “alternative energy.” Most people now have some idea of the concept of peak oil, but it tends to be brushed aside in conversation because of the common incantation: “It doesn’t matter if oil runs out, because by then everything will be converted to [whatever] power.” Humanity’s faith in what might be called the Pollyanna Principle—the belief that everything will work out right in the end—is eternal.


…click on the above link to read the rest of the article…


Jean Laherrere’s Bakken Update

Jean Laherrere’s Bakken Update

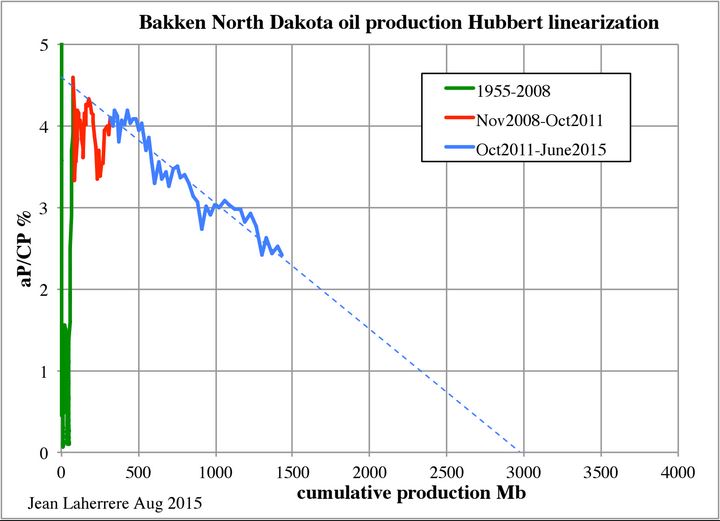
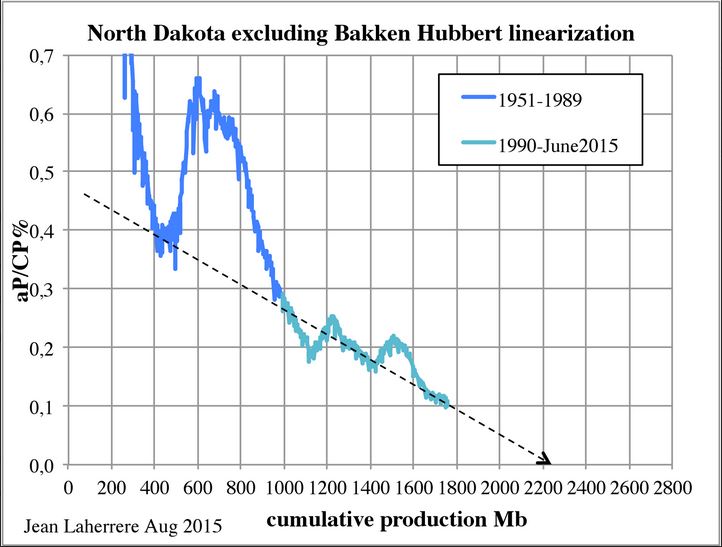
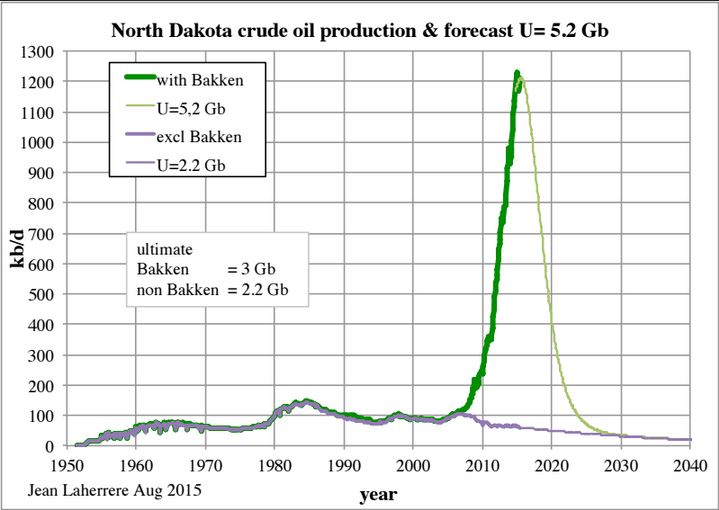
Jean Laherrere sent me the below charts the other day. I had planned on posting them with more Bakken data. But my schedule has been busy so I am posting them alone.

Jean’s interpretation for ND is as follows
Bakken ultimate = 3 Gb
Non Bakken ultimate = 2.2 Gb
ND ultimate 5.2 Gb
Detail
Quite symmetrical like the EIA drilling productivity data, but in contrary to EIA/AEO2015 with a peak in 2020
It will be interesting to see the evolution in the next few months

Jean 1

The Hubbert Linearization puts the Bakken about half way to the end.

Jean 2

The rest of North Dakota, less the Bakken, is just about finished.

Jean 3

With this chart Jean puts North Dakota production right at the peak.

…click on the above link to read the rest of the article…


US Shale Declining and OPEC Still Climbing

US Shale Declining and OPEC Still Climbing

First the Drilling Productivity Report. Of course most of the Drilling Productivity Report is projection, not history. And that projection goes through September 2015.

Bakken

The EIA has the Bakken peaking in December and declining 107 thousand barrels per day since that point. A secondary peak was reached in April and declining steadily since then.

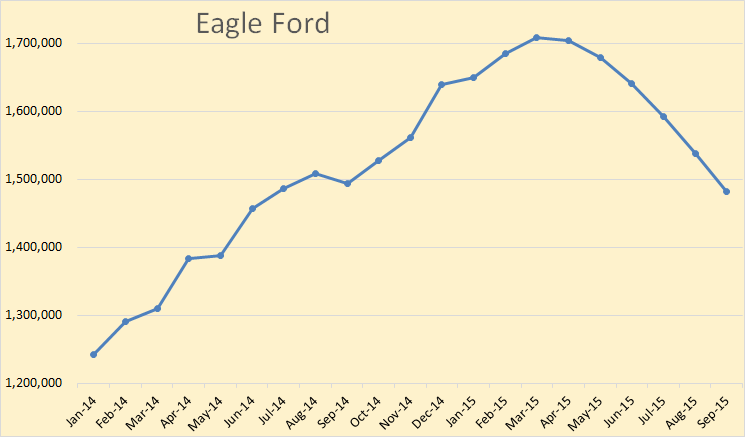
Eagle Ford

The EIA has Eagle Ford peaking in March and declining 226 thousand barrels per day since that point.

Niobrara

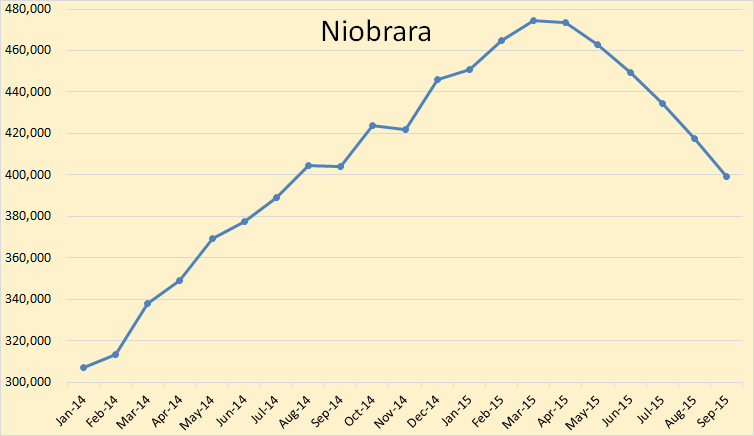
The EIA has Niobrara peaking in March, almost flat for one month then declining sharply after that for a total decline of 75 thousand barrels per day after that.

The Permian was the only major shale area with no decline so far. The EIA has the Permian up 29 thousand barrels per day since the rest of the field, combined, peaked in April.

Total Shale

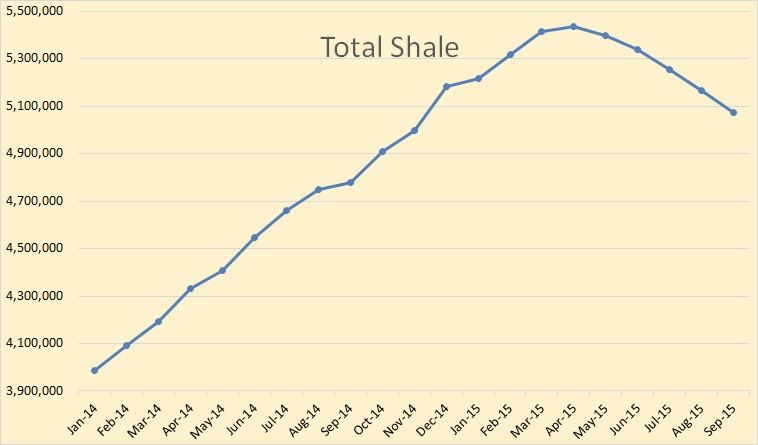
The EIA has total shale peaking in April at 5,434000 bpd and declining by 360 thousand barrels per day by September to 5,074000 bpd. 360,000 barrels per day is quite a decline by September.


…click on the above link to read the rest of the article…
International Rig Count Still Falling

International Rig Count Still Falling

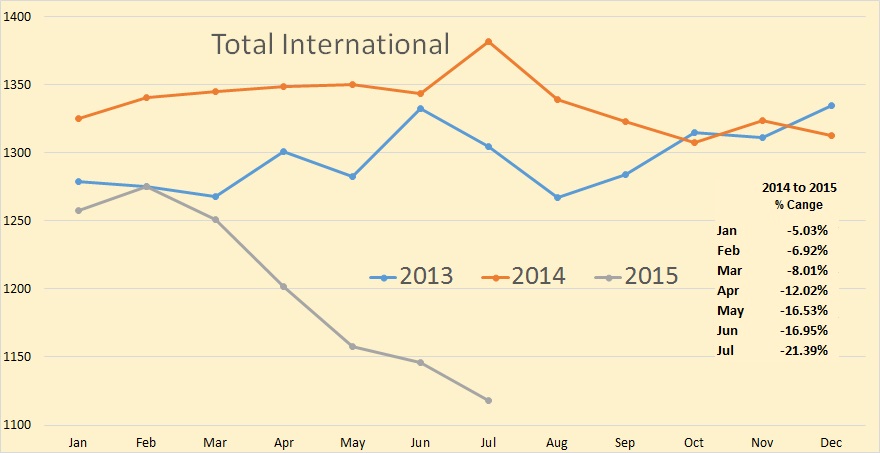
July usually sees a big jump in rig counts. This year there was a very tiny July increase, only a fraction of the increase we usually see for July.

Rig Count Total International

*The Total International rig counts does not include the USA, Canada or the FSU. The Total International rig count was down 28 in July to 1118. Last July it was up3 to 1344.


Rig Count Middle East

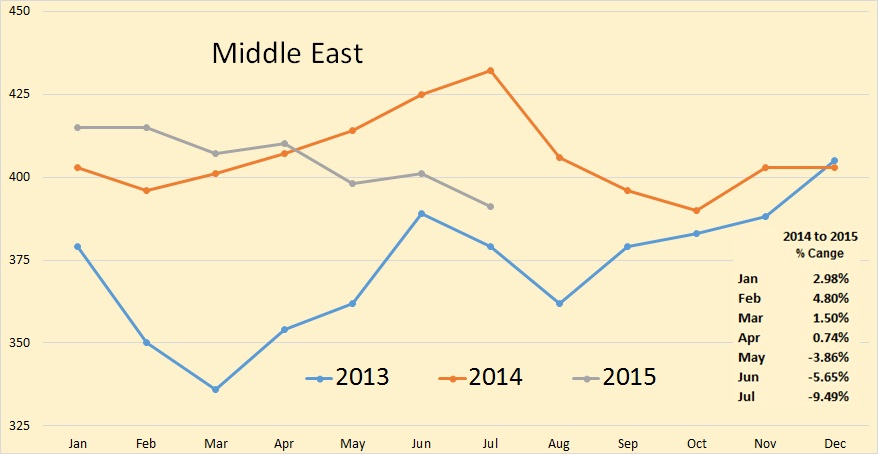
The Middle East is the only place that rig counts are holding up. Rig counts for July are down 32 to 391 but they are still above their 2013 levels.

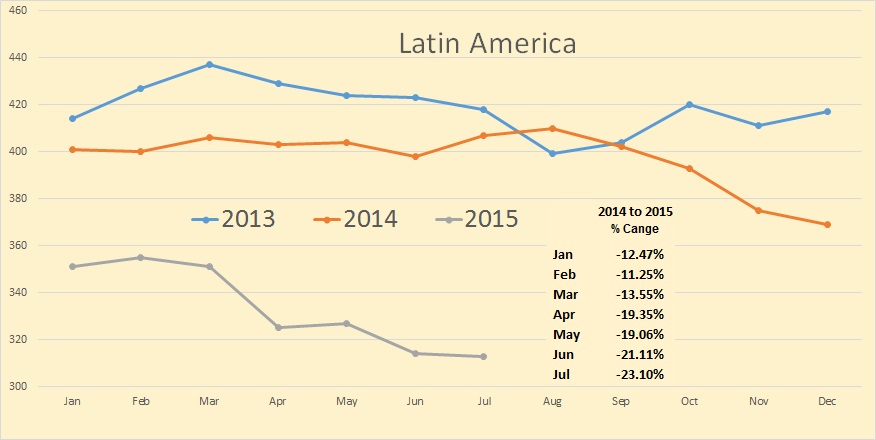
Rig Count Latin America

Latin American rigs fell 1 to 313 and are 23% below their 2014 level of 410.

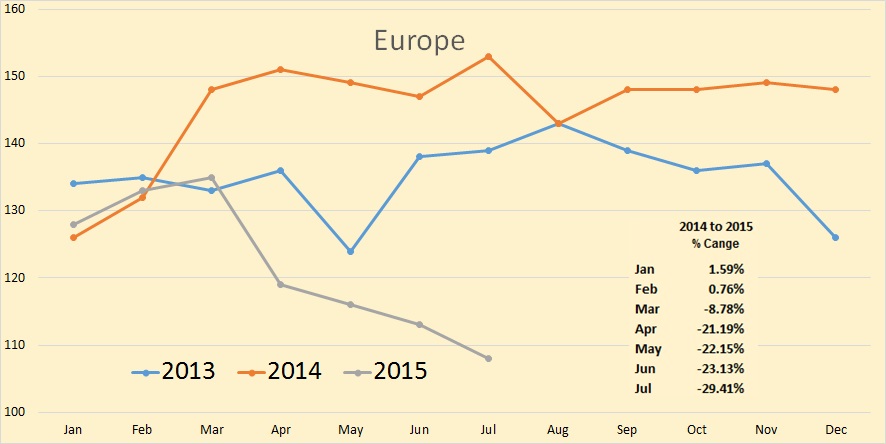
Rig Count Europe

Europe’s rig counts fell in July to 108. That is 45 rigs below last July’s count of 153.


US Oil Production Finally Starting to Decline

US Oil Production Finally Starting to Decline

A few days ago a very racist post was posted on this blog. I completely overlooked it as I seldom scan the posts because I get an email for every post so I just read the posts in the emails. But when there is a guest post, as the one last week was, I get no emails, the guest poster gets them instead. Anyway I deleted the post and banned the poster. I also banned another poster because he accused me of deliberately letting the post stay up. That outraged me. It was the same thing as accusing me of such racism.

Petroleum Supply Monthly

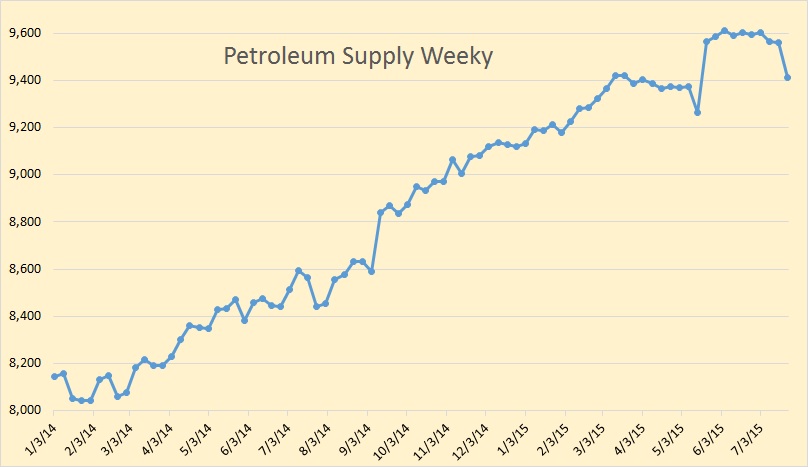
The Monthly Energy Review and the Petroleum Supply Monthly have US production peaking, so far, in March and April. The Petroleum Supply Weekly has US production peaking in June. In the chart above I have averaged the Petroleum Supply Weekly into monthly data. All data is in thousand barrels per day,

Petroleum Supply Weekly

Here we have the weekly data from the Petroleum Supply Weekly. The last data point is July 24th. The huge jumps you see are basically just revisions. The huge jump you see for the week of May 22nd, was not really a jump. The EIA explained that their prior numbers were too low and the sudden increase that week was merely an adjustment.

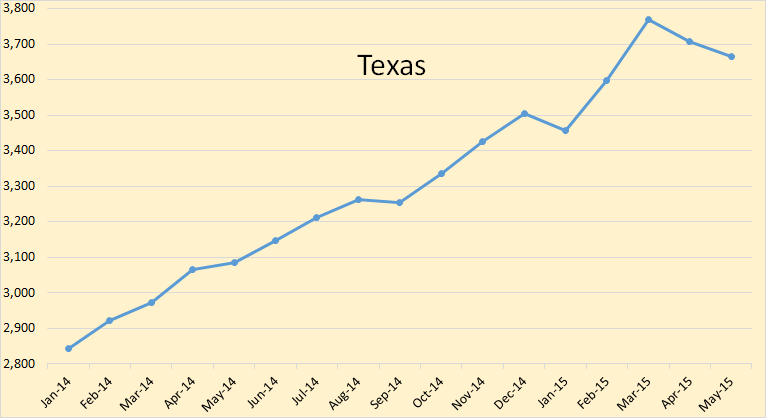
Texas C+C

The EIA is finally getting its act together as to Texas C+C production. They have Texas peaking in March at 3,770,000 bpd and declining 106,000 bpd since then.


…click on the above link to read the rest of the article…


World Natural Gas Shock Model

World Natural Gas Shock Model

For World Natural Gas URR Steve Mohr estimates 3 cases, with case 2 being his best estimate.

Case 1 URR= 14,000 TCF (trillion cubic feet)
Case 2 URR= 18,000 TCF
Case 3 URR= 27,000 TCF

Jean Laherrere’s most recent World natural gas URR estimate is close to Steve Mohr’s Case 1 at 13,000 TCF.

A Hubbert Linearization(HL) of World Conventional Natural Gas from 1999 to 2014 suggests a URR of 11,000 TCF, an HL from 1982-1998 points to a URR of 6000 TCF for conventional natural gas.

Note that “Conventional” natural gas subtracts US shale gas and US coal bed methane (CBM) from gross output minus reinjected gas for the World.

World Conventional Natural Gas HL (shale gas and CBM output from US deducted)

WorldshockNatgas/

Currently World cumulative conventional natural gas output (using gross minus reinjected gas following Jean Laherrere’s example) is 4200 TCF, about 38% of the URR.

When shale gas and coalbed methane gas output in the US are added to World Natural Gas, the HL points to a URR of 20,000 TCF, this implies that shale gas, tight gas and CBM might have a combined URR of as much as 9000 TCF. This matches well with the EIA’s 7000 TCF TRR estimate for shale gas and Steve Mohr’s 2500 TCF estimate for CBM.

I suspect the combined shale gas and CBM numbers will be lower(4000 TCF), but that conventional gas will be more than 11,000 TCF (about 15,000 TCF) .

World Natural Gas HL below (includes all types of natural gas)

…click on the above link to read the rest of the article…
 

Oil Shipments by Rail Declining

Oil Shipments by Rail Declining

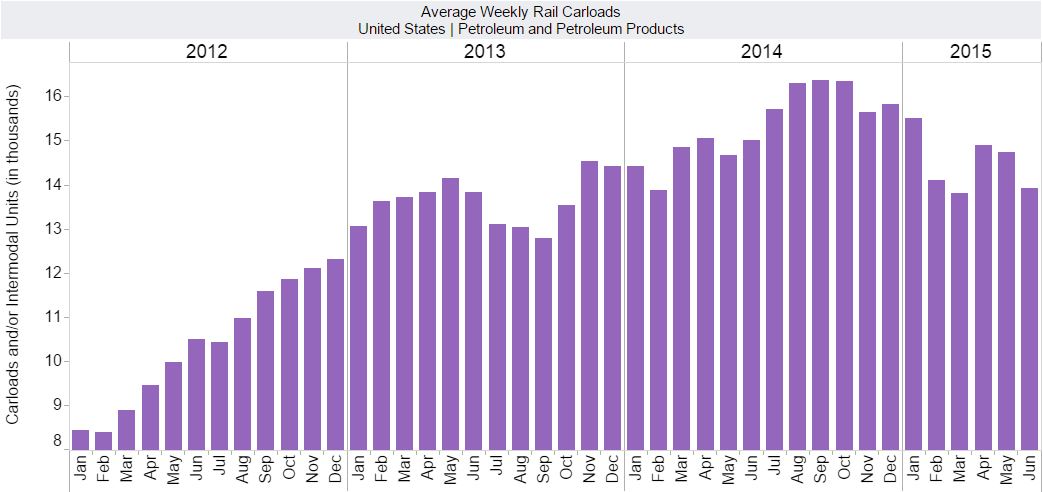
Weekly oil shipments by rail can be found on the web at Weekly Carload Reports. And a summation of that data with charts can be found at Association of American Railroads  Freight Rail Traffic Data.

Rail Oil Carloads 3

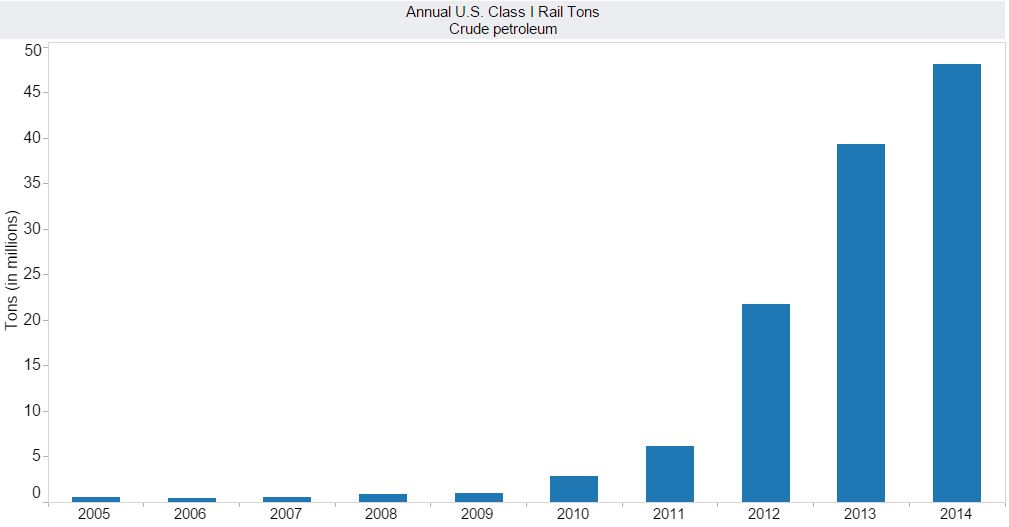
Crude oil by rail basically started with the shale boom. Prior to that almost all oil was shipped by pipeline. Of course a lot of oil was trucked to the pipelines. The EIA says in the first seven months of 2014 8 percent of all us crude and refined products was shipped by rail. It looks like that percentage was increased somewhat in the second half of 2014.

Rail Oil Carloads

Oil by rail, for the entire USA, peaked in August, September and October of 2014 and has declined since.

Daily Oil by Rail 2

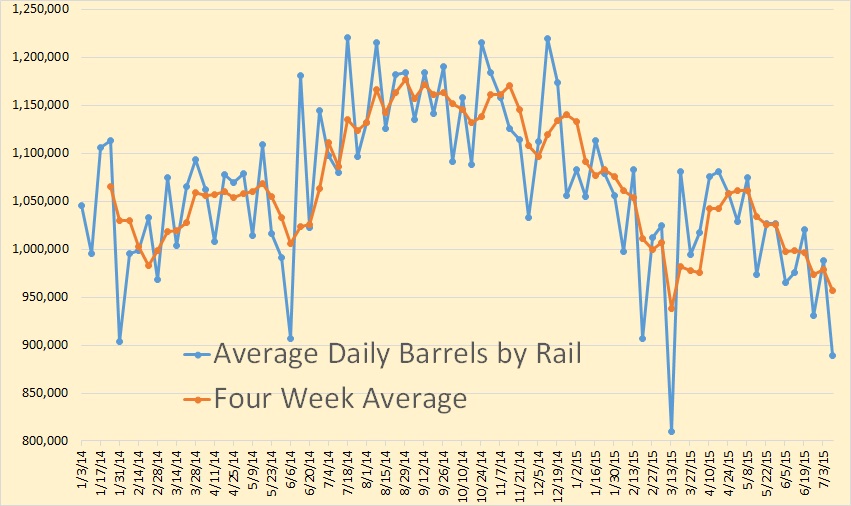
I have converted the weekly carloads to daily then converted carloads to barrels. There are about 700 barrels per carload. That gives us the average barrels per day by rail.

Daily Oil by Rail

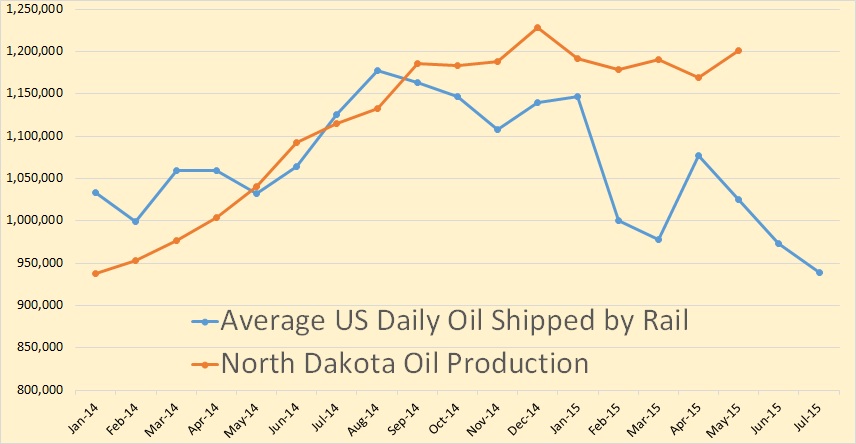
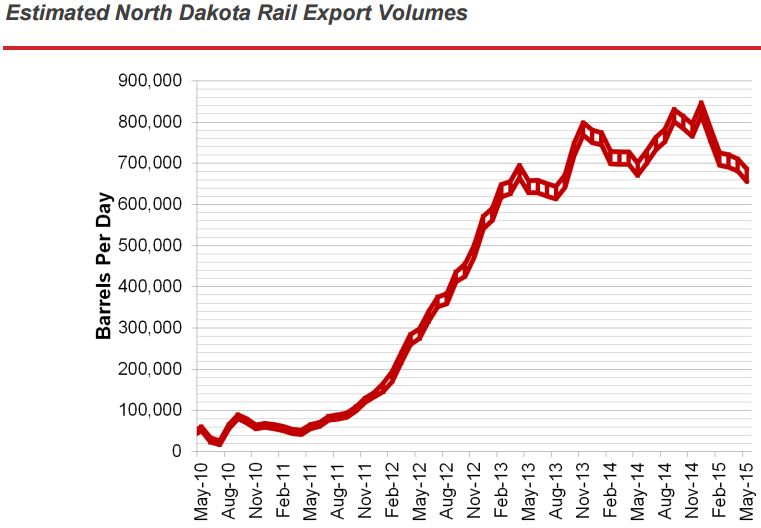
I have converted the weekly “daily average” to monthly “daily average” and plotted it against the North Dakota production. The EIA says: Between 60% and 70% of the more than 1 million barrels per day of oil produced in the state has been transported to refineries by rail each month in the first half of 2014, according to the North Dakota Pipeline Authority.

Rail Oil ND 1

As we can see from this chart the volume of oil shipped by rail changes from month to month. The chart is barrels per day per month. The peak, for North Dakota, is December 2014. Oil by rail for the USA peaked about three months earlier.


…click on the above link to read the rest of the article…
OPEC Production Still Increasing

OPEC Production Still Increasing

The July OPEC Monthly Oil Market Report is out with all OPEC Crude Only production data for June 2015.

OPEC 12

Crude Only production for the entire OPEC 12 as up 283,000 barrels per day in June to 31,378,000 bpd. But that was after May production had been revised up by 120,000 bpd. So counting May’s revisions and June’s numbers, OPEC production was up 403,000 bpd from what was originally reported last month.

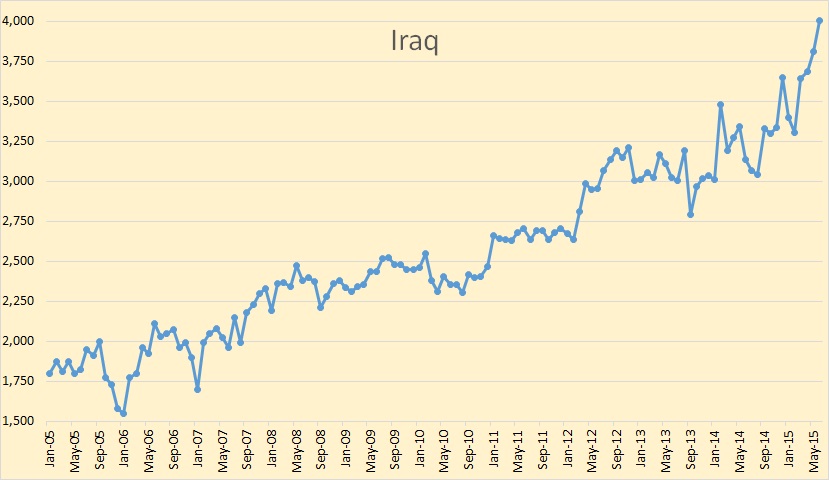
Iraq

The biggest gainer, by far, was Iraq, up 198,600 barrels per day over May to 4,007,000 bpd. It is interesting to note that Iraq via “Direct Communication” say they only produced 3,591,000 bpd in June, 416,000 bpd less than what “Secondary Sources” said they produced.

Saudi Arabia

Saudi Arabia was up 48,400 bpd in June to 10,235,000 bpd. That is just over one half million barrels per day above their 2014 average.


…click on the above link to read the rest of the article…
The EIA’s Short-Term Guessing Game

The EIA’s Short-Term Guessing Game

STEO N-O Liquids

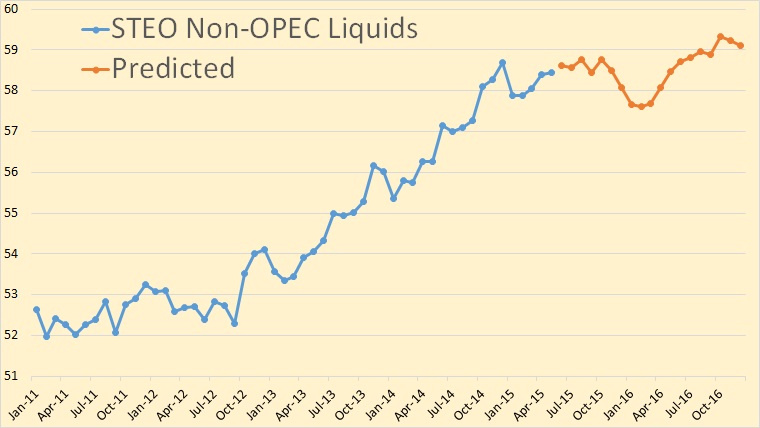
This chart is Non-OPEC Total Liquids in million barrels per day. Production of N.O Liquids surged upwards from September of 2012 until December 2014, gaining 6.38 million barrels per day in those 27 months. That’s an average increase of 236,000 barrels per day per month. But then in January 2015 there was a drop of 800,000 bpd.

Non-OPEC total liquids still have not reached that December high again but the EIA thinks they will by August. I have my doubts. I also think they have their April and May liquids production estimates a little too high here. I have their predictions here starting in June though the EIA starts their projection in July. But there is no way that June production is anything but a guess here, and a bad guess at that.

STEO US Liquids

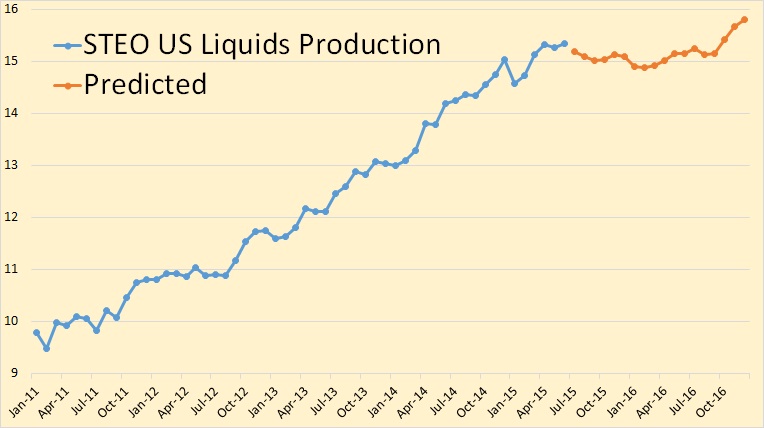
For four and one half years, US Total Liquids increased by an average of over 100,000 barrels per day per month. Now the EIA says US Liquids have reached a plateau where they will remain through September of 2016. Then for some unknown reason the US will resume it upward surge.

Notice the huge decline of 460,000 bpd in January 2015. But then there was an increase of 160,000 bpd in February, 390,000 bpd in March and 190,000 bpd in April. That’s an increase of 740,000 barrels per day over three months when the US rig count was falling dramatically. I look for those numbers to be revised in the next couple of months.


…click on the above link to read the rest of the article…
Oil Shock Models with Different Ultimately Recoverable Resources of Crude plus Condensate (3100 Gb to 3700 Gb)

Oil Shock Models with Different Ultimately Recoverable Resources of Crude plus Condensate (3100 Gb to 3700 Gb)

The views expressed are those of Dennis Coyne and do not necessarily reflect the views of Ron Patterson.

blog20150706/

The post that follows relies heavily on the previous work of both Paul Pukite (aka Webhubbletelescope) and Jean Laherrere and I thank them both for sharing their knowledge, any mistakes are my responsibility.

In a previous post I presented a simplified Oil Shock model that closely followed a 2013 estimate of World C+C Ultimately Recoverable Resources (URR) by Jean Laherrere of 2700 Gb, where 2200 Gb was from crude plus condensate less extra heavy oil (C+C-XH) and 500 Gb was from extra heavy (XH) oil resources in the Canadian and Venezuelan oil sands.

In the analysis here I use the Hubbert Linearization (HL) method to estimate World C+C-XH URR to be about 2500 Gb. The creaming curve method preferred by Jean Laherrere suggests the lower URR of 2200 Gb, if we assume only 200 Gb of future reserve growth and oil discovery.

Previously, I have shown that US oil reserve growth (of proved plus probable reserves) was 63% from 1980 to 2005. If we assume all of the 200 Gb of reserves added to the URR=2200 Gb model are from oil discoveries and that in a URR=2500 Gb, oil discoveries are also 200 Gb, then 300 Gb of reserve growth would be needed over all future years (we will use 90 years to 2100) or about 35% reserve growth on the 850 Gb of 2P (proved plus probable) reserves in 2010. I conclude that a URR of 2500 Gb for C+C-XH is quite conservative.

A problem with the Hubbert Linearization method is that there is a tendency to underestimate URR.

…click on the above link to read the rest of the article…
 

The EIA’s Questionable Numbers

The EIA’s Questionable Numbers

EIA Post 1

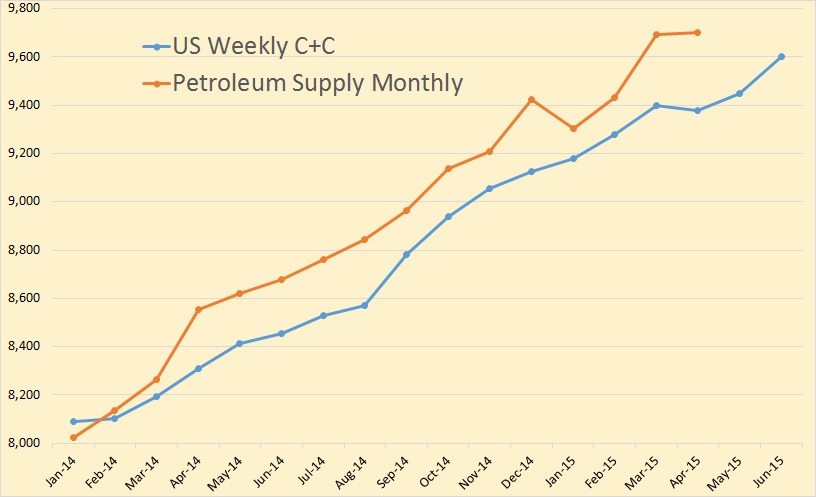
I averaged the weekly numbers and converted them to monthly data. They were pretty close for the first three months of 2014 but then they begin to diverge. Of course they were much closer earlier but in the Petroleum Supply Monthly has, over several months, been revised upward. The Weekly Petroleum Status Report is never revised.

In April, the Petroleum Supply Monthly shows US C+C production 322,000 barrels per day above the weekly average of the Weekly Petroleum Status Report.

EIA Post 2

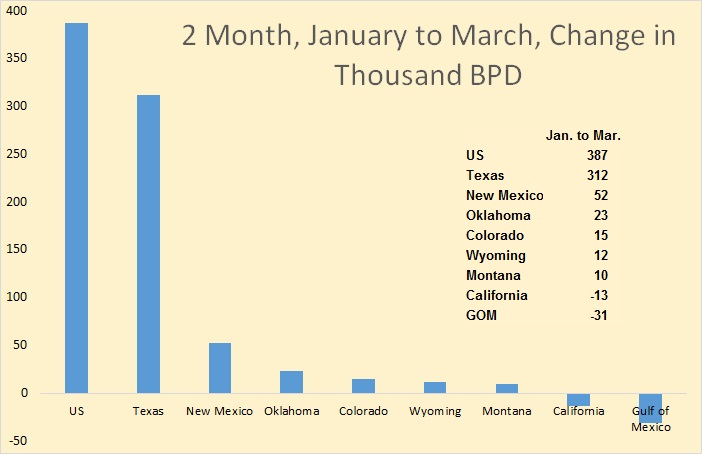
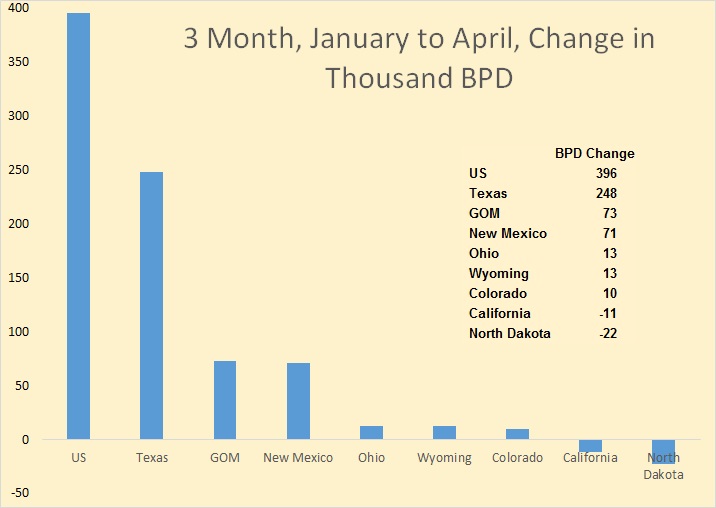
The Petroleum Supply Monthly shows US production increased 387,000 barrels per day in the two months January to March. That is an increase when oil rigs were being stacked by the dozens. They show Texas up 312,000 over those two months and New Mexico up 52,000 bpd. That means they think the Permian, which is mostly in Texas but partly in New Mexico, was really booming during those two months.


EIA Post 3

The EIA has crude production continuing to climb during April, up 396,000 bpd January to April. The Gulf of Mexico, which had been down slightly the previous three months, was shown up 104,000 in April, giving them a gain of 71,000 bpd over the three months.

But obviously Texas is where all the action is.


…click on the above link to read the rest of the article…

Bakken by County

Bakken by County

All charts are in barrels per day and are only for the last 16 months in order to get a better and expanded view of what each county is doing.

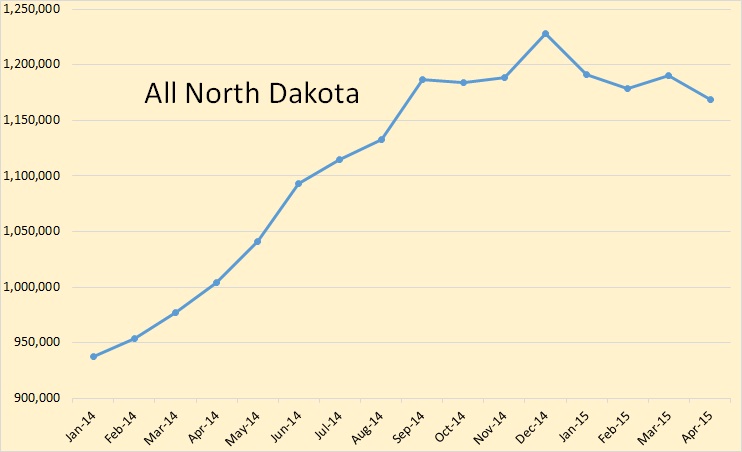
North Dakota Expanded

First a sixteen month view of all North Dakota production. North Dakota production, in April, stood at  1,168,636 bpd. That is 17,631 bpd below their production last September, seven months previous. North Dakota production is down 59,385 bpd since the high reached in December.

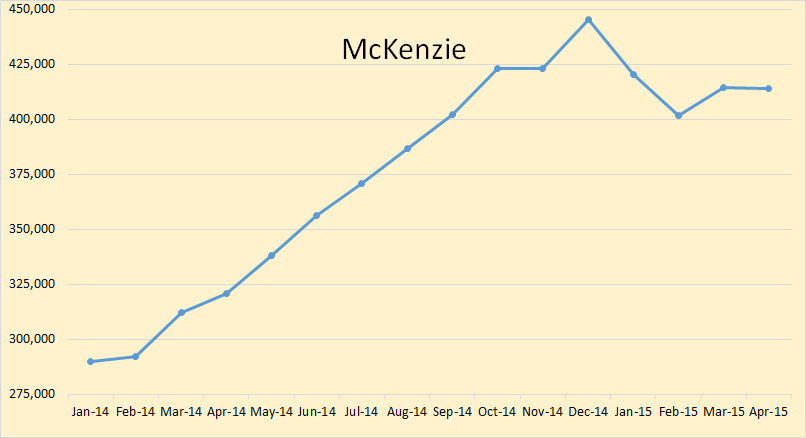
McKenzie

McKenzie County April production stood at 413,671 bpd, 31,555 bpd below their high in December.

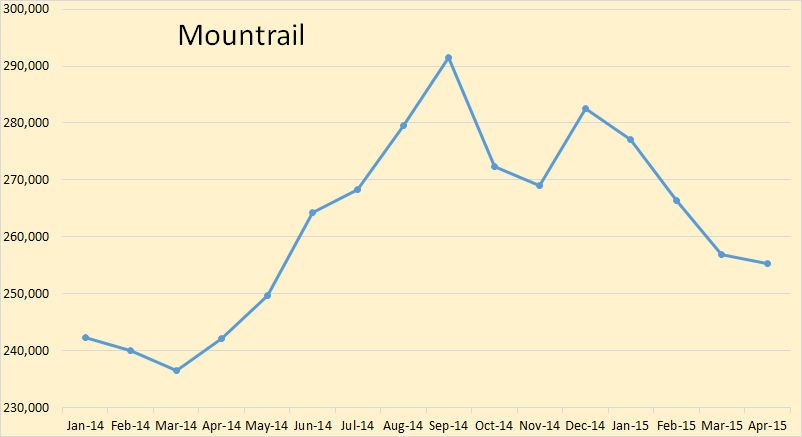
Mountrail

Mountrail County production stood at 255,384 bpd in April, 36,132 bpd below their peak in September.


…click on the above link to read the rest of the article…

Olduvai IV: Courage
Click on image to read excerpts

Olduvai II: Exodus
Click on image to purchase

Click on image to purchase @ FriesenPress