US Oil Production Finally Starting to Decline
A few days ago a very racist post was posted on this blog. I completely overlooked it as I seldom scan the posts because I get an email for every post so I just read the posts in the emails. But when there is a guest post, as the one last week was, I get no emails, the guest poster gets them instead. Anyway I deleted the post and banned the poster. I also banned another poster because he accused me of deliberately letting the post stay up. That outraged me. It was the same thing as accusing me of such racism.
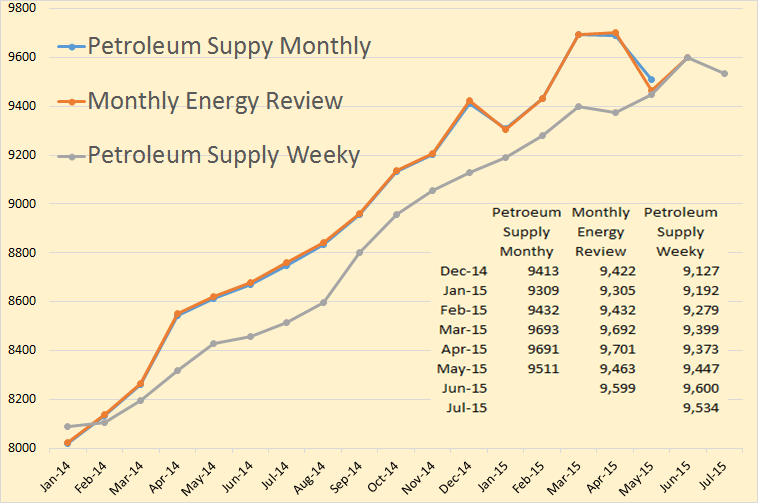
The Monthly Energy Review and the Petroleum Supply Monthly have US production peaking, so far, in March and April. The Petroleum Supply Weekly has US production peaking in June. In the chart above I have averaged the Petroleum Supply Weekly into monthly data. All data is in thousand barrels per day,
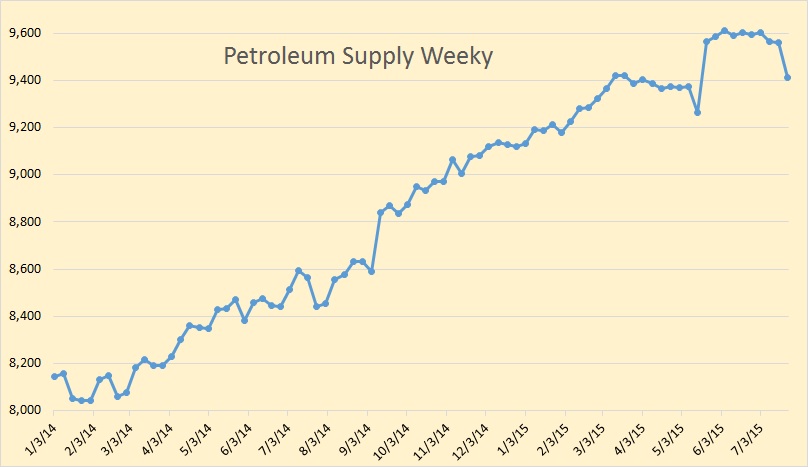
Here we have the weekly data from the Petroleum Supply Weekly. The last data point is July 24th. The huge jumps you see are basically just revisions. The huge jump you see for the week of May 22nd, was not really a jump. The EIA explained that their prior numbers were too low and the sudden increase that week was merely an adjustment.
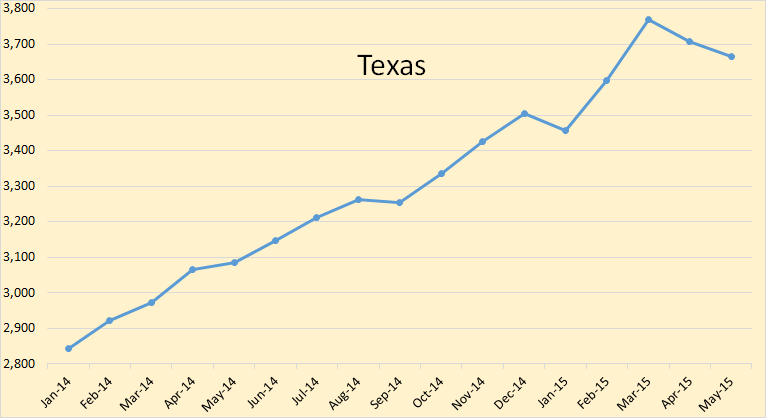
The EIA is finally getting its act together as to Texas C+C production. They have Texas peaking in March at 3,770,000 bpd and declining 106,000 bpd since then.
…click on the above link to read the rest of the article…


