Home » Posts tagged 'price inflation' (Page 18)

Tag Archives: price inflation

Olduvai
Click on image to purchase

Olduvai III: Catacylsm
Click on image to purchase

Post categories

Post Archives by Category

This is not 1997

This is not 1997

Not that minimum wages are anything new.  The USA introduced its Federal Minimum Wage as far back as 1938; although today each state sets its own rate.  And the general consensus is that minimum wages help raise wages in general with little or no impact on employment as a whole.  The broad theory being that by increasing wages at the bottom – where people’s propensity to spend is higher – we increase demand across the economy.  As the economy grows, demand for labour increases and forces wages up still further.  And so, demand rises and promotes further growth.Although introduced to the UK by a Labour government, the National Minimum Wage is closer to the Tory approach to economic policy.  This is because it passes the costs onto someone other than the state immediately.  In this case, Britain’s employers.  Labour governments, in contrast, have generally sought the politically easier approach of passing costs onto future generations via public borrowing… which was often the better policy if a combination of inflation and growth served to lower the real cost of the debt even as the state’s ability to repay it became easier.

This was no doubt the outcome desired by Tony Blair and Gordon Brown when they were elected in 1997.  After two decades of suppressed wages – first under James Callaghan, and then under Thatcher – and despite the deregulation of the City of London and the increasing revenues from North Sea oil and gas, it was hoped that a legal minimum wage would generate the growth needed to lift people out of poverty.  In neoliberal terms, it would “make work pay.”

…click on the above link to read the rest of the article…

“Transitory” Shortages & Inflation Are Actually Your Quality Of Life Being Stolen Right Before Your Eyes

“Transitory” Shortages & Inflation Are Actually Your Quality Of Life Being Stolen Right Before Your Eyes

The Washington Post published an op-ed urging Americans dealing with product shortages to lower their expectations. My response? Don’t settle. Failed policies have our country devolving.

There’s no doubt our country has all of a sudden slipped into the most precarious state we’ve been able to readily confirm with our own two eyes in decades.

We are suffering from runaway inflation, we have a monstrous labor shortage, and products we normally would have abundant access to are missing from store shelves. The country doesn’t produce anything anymore, we have doubled our Central Bank’s balance sheet in under two years and the money supply has gone parabolic.

Four reasons Americans are still seeing empty shelves and long waits for  many products | MinnPost
Source: Minn Post

And engineering solutions for these issues requires correctly identifying where the problem is coming from to begin with. It appears we can either go one of two directions when we try to deduce the cause of these issues.

The first direction we can go in is to point to monetary and fiscal policy and look at their direct effects on the state of the country and our economy. This, I believe, is the pragmatic approach to solving the issues our nation faces.

The second direction, according to a new Washington Post op-ed, is apparently to blame and shame ourselves for being greedy and assuming that we ever deserved such a quality of life to begin with.

The Post recently published a piece called “Opinion: Don’t rant about short-staffed stores and supply chain woes”, which put this argument on the table, basically telling people to shut up and be thankful for the little they have.

Source: WaPo

…click on the above link to read the rest of the article…

Shortages & Hyperinflation Lead to Total Misery

SHORTAGES & HYPERINFLATION LEAD TO TOTAL MISERY

At the end of major economic cycles, shortages develop in all areas of the economy. And this is what the world is experiencing today on a global basis. There is a general lack of labour, whether it is restaurant staff, truck drivers or medical personnel.

There are also shortages of raw materials, lithium (electric car batteries), semi-conductors, food,  a great deal of consumer products, cardboard boxes, energy and etc, etc. The list is endless.

SHORTAGES EVERYWHERE

Everything is of course blamed on Covid but most of these shortages are due to structural problems. We have today a global system which cannot cope with the tiniest imbalances in the supply chain.

Just one small component missing could change history as the nursery rhyme below explains:

For want of a nail, the shoe was lost.
For want of a shoe, the horse was lost.
For want of a horse, the rider was lost.
For want of a rider, the battle was lost.
For want of a battle, the kingdom was lost.
And all for the want of a 
horseshoe nail
.

Cavalry battles are lost if there is a shortage of horseshoe nails.

The world is not just vulnerable to shortages of goods and services.

BOMBSHELLS

Bombshells could appear from anywhere. Let’s just list a few like:

  • Dollar collapse (and other currencies)
  • Stock market crash
  • Debt defaults, bond collapse (e.g. Evergrande)
  • Liquidity crisis  (if  money printing stops or has no effect)
  • Inflation leading to hyperinflation

There is a high likelihood that not just one of the above will happen in the next few years but all of them.

Because this is how empires and economic bubbles end.

The Roman Empire needed 500,000 troops to control its vast empire.

Map of the Roman Empire.

Emperor Septimius Severus (200 AD) advised his sons to “Enrich the troops with gold but no one else”.

…click on the above link to read the rest of the article…
Meat Prices on the Rise

(Image from Statistics Canada: Prices for meat products rise year over year in September)

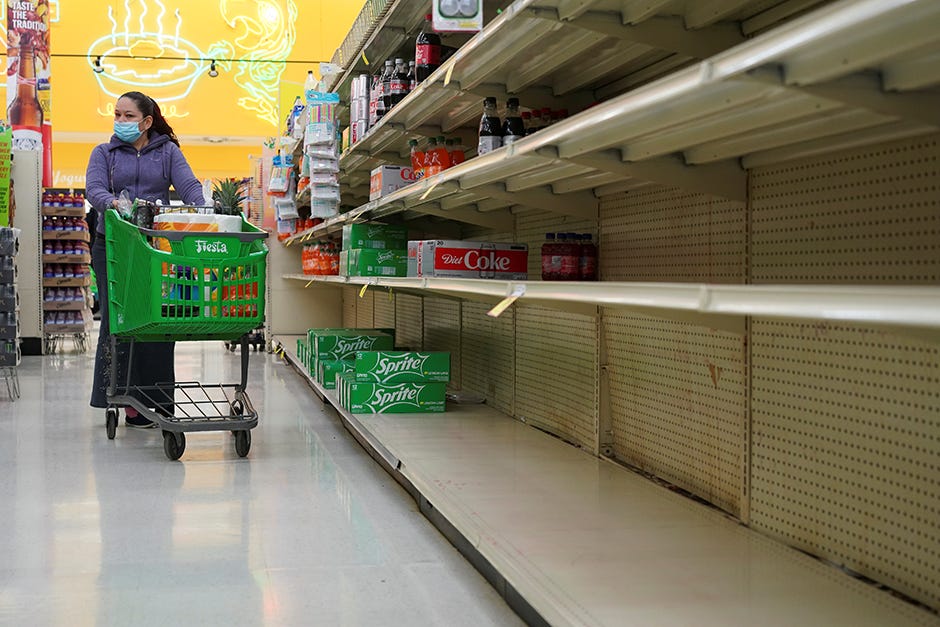
Canada’s CPI rose 4.4% YoY this September, according to Statistics Canada. Every major sector saw gains, but meat prices spiked 9.5%, marking the fastest pace of growth since April 2015. Canada’s Food Price Report for 2021, released in December 2020, predicted that meat prices would rise 4.5% to 6.5% in 2021, a drastic underestimate. Dr. Sylvain Charlebois, project lead and Director of the Agri-Food Analytics Lab at Dalhousie University warned people that they should develop “immunity” to rising prices. “Immunity to higher food prices requires more cooking, more discipline and more research. It’s as simple as that.” Gaslighting the people to believe they need to change their lives, rather than government change their policy, is at play once again.

Let me remind you that Bill Gates and others have been advocating for a move to 100% synthetic beef. But his logic only applies to the “rich” countries such as the US and Canada. “Weirdly, the US livestock, because they’re so productive, the emissions per pound of beef are dramatically less than emissions per pound in Africa,” Gates said in an interview in February 2021. “So no, I don’t think the poorest 80 countries will be eating synthetic meat. I do think all rich countries should move to 100% synthetic beef. You can get used to the taste difference, and the claim is they’re going to make it taste even better over time. Eventually, that green premium is modest enough that you can sort of change the [behavior of] people or use regulation to totally shift the demand.” This ties into the climate change agenda and the idea that starvation can help us shift to zero CO2…

…click on the above link to read the rest of the article…

Corporate Greed the ‘Real Culprit Behind Rising Prices,’ Researchers Say

Corporate Greed the ‘Real Culprit Behind Rising Prices,’ Researchers Say

“The more sway mega-corporations have over our economy, the more power they have to gouge customers, squeeze Main Street, and exploit workers.”

Amid mounting data showing that people are paying more for food at grocery stores around the United States, a new analysis out Wednesday reveals how corporate power is “the real culprit behind rising prices at the checkout line.”

“Addressing this crisis means recognizing these price increases for what they are: the result of deeply entrenched concentrated corporate power.”

After the U.S. Labor Department announced that the Consumer Price Index increased by 0.4% in September, researchers at the Groundwork Collaborative, a progressive think tank, explained the connections between “price hikes, monopoly, and corporate greed.”

“The more sway mega-corporations have over our economy, the more power they have to gouge customers, squeeze Main Street, and exploit workers,” Rakeen Mabud, chief economist at the Groundwork Collaborative, said in a statement.

Since September 2020, food prices overall have increased by 4.6%, with the price of meats, poultry, fish, and eggs surging the most over the past 12 months, at 10.5%.

The higher inflation rate in those industries, researchers noted, can be attributed to decades of consolidation, which has given a handful of corporations an ever-greater degree of market control and with it, the power to set prices.

According to the Groundwork Collaborative:

Just four meat processing conglomerates control more than 80% of the beef industry and more than 60% of the pork industry. This enables them to dictate prices that both flatten returns for farmers and ranchers and inflate prices for consumers at the meat counter. As a result, consumers have seen a 12% increase in the cost of beef and a nearly 10% increase in the cost of pork over the last year…

…click on the above link to read the rest of the article…

Inflationary Storm Forces Unilever To Raise Prices Fastest In Seven Years 

Inflationary Storm Forces Unilever To Raise Prices Fastest In Seven Years 

Rising consumer prices are not going away. The latest example of this is from British multinational consumer goods company Unilever PLC who announced Thursday soaring commodity prices had forced it to raise prices the most in years.

The multinational consumer goods company that produces food, beverages, cleaning agents, and personal care products said it raised prices 4.1% in the third quarter, the fastest in seven years, pushing soaring material costs onto consumers, which compensated for a drop in shipments to Southeast Asia during COVID outbreaks.

Unilever CEO Alan Jope said inflationary pressures would linger for at least another 12 months:

“Our current view of the future is that peak inflation will be in the first half of 2022, and it will moderate as we move towards the second half,” Jope said in a Bloomberg Television interview.

“We continue to take pricing responsibly, and that’s in relation to the very high levels of inflation we’re seeing,” CFO Graeme Pitkethly told reporters. He said that inflation in the consumer goods industry is in the “high teens,” with Unilever mitigating some of the inflationary impacts due to its negotiating power.

Pitkethly warned inflation could surge even higher next year, and the company would have to deal with spot prices as its hedges expire. He said 20 billion euros in raw materials and packaging costs and 3 billion euros worth of logistical costs had been impacted inflation.

Rivals, such as Nestlé warned Wednesday that “inflation costs are rising faster than we can roll forward through pricing . . . The situation has not improved. If anything, we are seeing further downsides compared to what we told you in the summer.”

…click on the above link to read the rest of the article…

Money Velocity and Prices

The yearly growth rate of US AMS jumped to almost 80% by February 2021 (see chart). Given such massive increase in money supply, it is tempting to suggest that this lays the foundation for an explosive increase in the annual growth of prices of goods and services sometime in the future

Some experts are of the view that what matters for increases in the momentum of prices is not just increases in money supply but also the velocity of money – or how fast money circulates. The velocity of AMS fell to 2.4 in June this year from 6.8 in January 2008. On this way of thinking, a decline in money velocity is going to offset the strong increase in money supply. Hence, the effect on the momentum of prices of goods is not going to be that dramatic. What is the rationale behind all this?

Popular view of what velocity is

According to popular thinking, the idea of velocity is straightforward.  It is held that over any interval of time, such as a year, a given amount of money can be used repeatedly to finance people’s purchases of goods and services.

The money one person spends for goods and services at any given moment, can be used later by the recipient of that money to purchase yet other goods and services.  For example, during a year a particular ten-dollar bill used as following: a baker John pays the ten-dollars to a tomato farmer George. The tomato farmer uses the ten-dollar bill to buy potatoes from Bob who uses the ten-dollar bill to buy sugar from Tom. The ten-dollar here served in three transactions. This means that the ten-dollar bill was used three times during the year, its velocity is therefore three.

…click on the above link to read the rest of the article…


How to Buffer the Fallout from America’s Third World Death Spiral

How to Buffer the Fallout from America’s Third World Death Spiral

“What the hell?!” – President Joe Biden, June 16, 2021

Out of Control

American workers are trying to make their way in an economy that’s rigged against them.  We made this claim many years ago.  Today, for fun and for free, we revisit this assertion…starting with the latest from those doing the rigging.

This week, after a two day meeting, the Federal Open Market Committee (FOMC) released their statement.  Nothing material changed.  The Fed will continue to hold the federal funds rate near zero.  The Fed will also continue to create at least $120 billion per month from thin air to buy Treasuries and mortgage-backed securities.

Bond yields spiked and the price of gold dropped because 13 Fed officials now plot dots that project two hikes to the federal funds rate in 2023.  Fed Chair Jay Powell also mentioned the Fed is “talking about talking about” bond tapering.  These technocrats likely know – though they won’t admit – they’ve already lost control.

Consumer price inflation is ‘officially’ rising at a 5 percent annualized rate.  However, the ‘unofficial’ rate of consumer price inflation, as calculated using methodologies in place in 1980, is about 13 percent.  This rate of inflation is remarkably destructive to household budgets.

‘Talking about talking about’ tapering and telegraphing federal funds rate increases some two years from now will do little to contain consumer price inflation.  The fact is, it has already veered out of control.  We expect gas prices to top $5 per gallon in California this summer.  Many Americans are not prepared for sustained, unrelenting price inflation.

Here’s the hard, back of the napkin math they are facing…

Sour Grapes

…click on the above link to read the rest of the article…

It Gets Ugly: Dollar’s Purchasing Power Plunged at Fastest Pace since 1982. It’s “Permanent” not “Temporary,” Won’t Bounce Back

It Gets Ugly: Dollar’s Purchasing Power Plunged at Fastest Pace since 1982. It’s “Permanent” not “Temporary,” Won’t Bounce Back

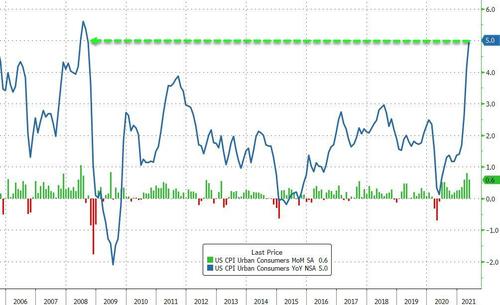
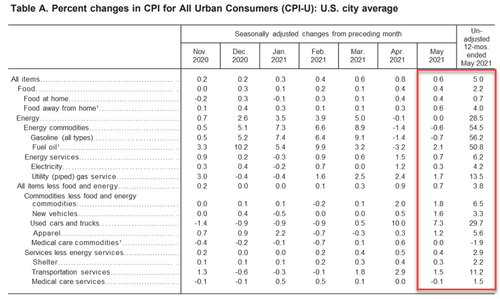
The Consumer Price Index jumped 0.6% in May, after having jumped 0.8% in April, and 0.6% in March – all three the steepest month-to-month jumps since 2009, according to the Bureau of Labor Statistics today. For the three months combined, CPI has jumped by 2.0%, or by an “annualized” pace of 8.1%. This current three-month pace of inflation as measured by CPI has nothing to do with the now infamous “Base Effect,” which I discussed in early April in preparation for these crazy times; the Base Effect applies only to year-over-year comparisons.

On a year-over-year basis, including the Base Effect, but also including the low readings last fall which reduce the 12-month rate, CPI rose 5.0%, the largest year-over year increase since 2008.

In terms of the politically incorrect way of calling consumer price inflation: The purchasing power of the consumer dollar – everything denominated in dollars for consumers, including their labor – has dropped by 0.8% in May, according to the BLS, and by 2.4% over the past three months, the biggest three-month plunge in purchasing power since 1982:

On an annualized basis, the three-month drop in purchasing power amounted to a drop of 9.5%, and this eliminates the Base Effect which only applies to year-over-year comparisons.

That plunge in purchasing power is “permanent” not “temporary.”

Yup, the current plunge in purchasing power is permanent. And the plunge in purchasing power in the future is also permanent.

The only thing that might make a small portion of it “temporary” is if there is a period of consumer price deflation, which has happened for only a few quarters in my entire life, for example in the last few months of 2008, which is indicated in the chart above. So I’m not getting my hopes up.

…click on the above link to read the rest of the article…

Core Consumer Prices Surge At Fastest Rate Since 1992

Core Consumer Prices Surge At Fastest Rate Since 1992

With the world’s eyes having moved on from China’s rip-roaring PPI (and post-data decision to unleash price controls), this morning’s CPI print has been heralded as the arbiter of “is it transitory or not” with some (BofA) even suggesting we are nearing a period of “transitory hyperinflation.” The answer for now is – inflation’s still accelerating as headline CPI soared 5.0% YoY (hotter than the +4.7% expected). That is the highest level of inflation since Aug 2008.

Source: Bloomberg

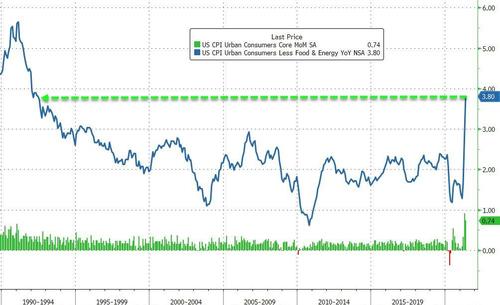
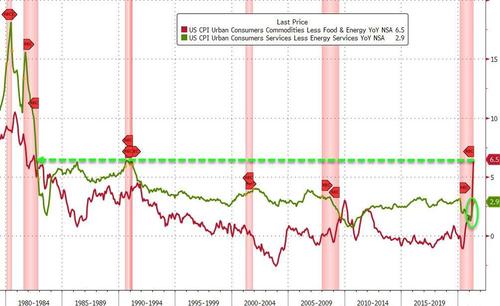
But it is core CPI that is the huge outlier, soaring 3.8% YoY – the hottest level of inflation since 1992…

Source: Bloomberg

Goods prices are up 6.5% YoY – the highest since 1982 – and services prices are also accelerating significantly.

Source: Bloomberg

Under the hood, many of the same indexes continued to increase,  including used cars and trucks, household furnishings and operations, new vehicles, airline fares, and apparel. The index for medical care fell slightly, one of the few major component indexes to decline in May

The index for used cars and trucks continued to rise sharply, increasing 7.3 percent in May. This increase accounted for about one-third of the seasonally adjusted all items increase.

The household furnishings and operations index increased 1.3 percent in May, its largest monthly increase since January 1976.

The index for new vehicles rose 1.6 percent in May, its largest 1-month increase since October 2009. The index for airline fares continued to increase, rising 7.0 percent in May after increasing 10.2 percent the prior month. The apparel index also rose in May, increasing 1.2 percent.

The index for car and truck rentals continued to rise, increasing 12.1 percent after rising 16.2 percent the prior month (and more than doubled over the past 12 months, rising 109.8 percent).

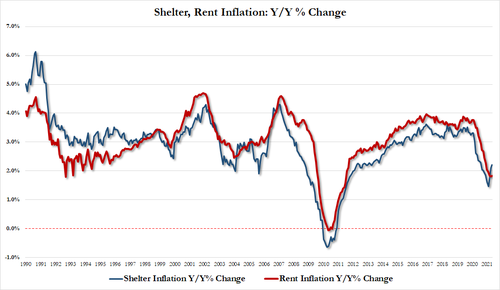
Finally, rent/shelter inflation remains subdued

  • MoM: The shelter index rose 0.3 percent in May. The index for rent rose 0.2 percent and the index for owners’ equivalent rent increased 0.3 percent
  • YoY:  The shelter index increased 2.2 percent over the last 12 months.

So, Transitory or not?

Where Will The Next Deflationary Shock Come From?

“Whenever I hear numbers like this, I look back to my childhood growing up in Hungary, where…[the] value of money meant nothing. I’m very worried this is an unstoppable situation because the longer the Fed waits, the more they will have to raise rates. So, we’re basically painting ourselves into a box, and I don’t see how we’re going to get out of it.
– Thomas Peterffy, chairman and founder of Interactive

______________________________________________________________________________________________________

Introduction

It seems as though wherever one looks, soaring prices are in the news. Everything from the rising price of lumber to oil, to housing, to food is dominating headlines. This week, key inflation data was released, and let’s just say it wasn’t pretty. The Consumer Price Index (CPI), which measures a basket of goods as well as energy and housing costs, rose 4.2% year-over-year, surpassing expectations from a Dow Jones survey that anticipated a 3.6% increase. The month-to-month gain was also much higher than expected – at 0.8% versus 0.2%. Additionally, the Producer Price Index (PPI) – another key inflation indicator – spiked 6.2% for the 12 months ended in April, which marked the largest increase since the Bureau of Labor Statistics started tracking the data in 2010. The PPI rose 0.6% month-over-month, which was twice the rate expected in a FactSet survey.

Markets were rattled by the data – as nearly everything sold off on Wednesday after CPI data was published. Markets gained back some of the losses on Thursday morning, before selling off slightly mid-day when PPI data was released. Despite these key inflation indicators signaling trouble ahead, economists and policy makers have attempted to quench fears by signaling that the rising prices are “transitory.” Federal Reserve Atlanta Fed President Raphael Bostic said Wednesday that he expects bouts of inflation volatility through September…

…click on the above link to read the rest of the article…

Fed’s Favorite Lowball Inflation Gauge is Red-Hot, Not Seen in Decades, Even Without the “Base Effect”

Fed’s Favorite Lowball Inflation Gauge is Red-Hot, Not Seen in Decades, Even Without the “Base Effect”

The majestic inflation overshoot has arrived.

The Fed’s favorite inflation measure, generally the lowest inflation measure the US government provides — tracking a lot lower than even the Consumer Price Index which already understates actual inflation — and therefore our lowest lowball inflation measure, and therefore the Fed’s favorite inflation measure, was released this morning, and it was a doozie, despite being the most understated inflation measure the US has so far come up with.

The Personal Consumption Expenditures Price index without food and energy, the “core PCE” index, jumped by 0.7% in April from March, after having jumped by 0.4% in March from February, according to the Bureau of Economic Analysis today. Those two months combine into an annualized core PCE inflation rate of 6.4%, meaning that if price-increases continue for 12 months at the pace of the past two months, then the annual inflation would be 6.4% as measured by the lowest lowball measure the US has.

This was the highest two-months annualized rate since 1985. And it shows to what extent inflation has suddenly heated up in March and April.

Over the past three months – so April, March, and February – the annualized increase of core PCE inflation was 4.9%, the highest since 1990.

The annualized PCE index eliminates the legitimate issue of the “Base Effect” that is now getting trotted out to brush off the inflation data (I discussed the Base Effect in early April to prepare for what would be coming).

The Base Effect applies only to year-over-year comparisons. In March last year, the core PCE price index dipped by 0.1% from February, and in April it dipped by 0.4% from March. So comparing today’s PCE index to that dip in April (the lower “base”) would include the Base Effect.

…click on the above link to read the rest of the article…
 

Suffering a sea-change

Suffering a sea-change

There is an established theoretical relationship between bonds and equities which provides a framework for the future performance of financial assets. It would be a mistake to ignore it, ahead of the forthcoming rise in global interest rates.Price inflation is roaring, and so far, central banks are in denial. But it is increasingly difficult to see how monetary policy planners can extend the suppression of interest rates for much longer. There can only be one outcome: markets, that is to say prices determined by non-state actors, will force central banks to capitulate on interest rates in the summer.

Hardly noticed, China is deliberately putting the brakes on its economy, which will cause an inflationary dollar to collapse, unless the US defends it by putting up interest rates. Deliberate? Almost certainly, as part of its strategy, China is taking the financial war with the US into the foreign exchanges.

Bond yields will rise, with the US Treasury 10-year bond leaving a 2% yield far behind. Equity markets will sense the danger, and it might turn out that the month of May marks a peak in financial asset values — following cryptocurrencies into substantial bear markets.
Introduction

There is an old stock market adage that you should sell in May and go away. It has already proved its worth in the case of cryptocurrencies, with Bitcoin more than halving at one point, and Ethereum losing 57% between 10—19 May. A sea-change in cryptocurrencies’ market sentiment has taken place.

As for equities, it could also turn out that 10 May, which so far has marked the S&P 500 Index’s high point, will mark the beginning of their decline. But it’s too soon to tell…

…click on the above link to read the rest of the article…
Surging Inflation Might Be the Rumblings of an Economic Tsunami

Inflation in the U.S. is on the rise, may have started heating up last year, and is now on the cusp of spiraling out of control.Gasoline prices pushing $5 per gallon are concerning bad, and will strain family budgets across the country following on the heels of the COVID-19 pandemic.

The 400% increase in lumber prices isn’t helping either, and as Business Insider reports: “Certain food items, household products, appliances, cars, and homes are all seeing prices surge” thanks to supply chain issues.

So the economic situation is already pretty dicey.

But what if the situation is much worse?

What if the Fed has played such a good “shell game” with inflation that something bigger is actually brewing?

Former Treasury Secretary Larry Summers is worried because of how fast inflation is heating up:

“I was on the worried side about inflation and it’s all moved much faster, much sooner than I had predicted,” Summers said in an interview with David Westin on Bloomberg Television’s “Wall Street Week.” “That has to make us nervous going forward.” [emphasis added]

And this fast-rising inflation still seems to be flying under the Fed’s radar. Robert Wenzel didn’t mince any words, calling Chairman Jerome Powell’s Federal Reserve “clueless.”

Based on Powell’s previous track record, Wenzel’s comment might be reasonable. That Powell seemed to be “ignoring” parts of the entire story behind inflation last year further supports Wenzel’s argument, and adds uncertainty.

Inflation surging and the Fed failing to even acknowledge it, let alone live up to their inflation-control mandate? This is a recipe for a frightening situation. Bloomberg spotlighted one fact that raises at least one serious question:

…click on the above link to read the rest of the article…
Monetary Inflation’s Game of Hide-and-Seek

The May 12, 2021, press release from the Bureau of Labor Statistics reporting on the Consumer Price Index (CPI) for the month of April sent the stock markets tumbling for two days and generated fodder for the news pundits with the announcement that the CPI measure of the cost-of-living had increased 4.2 percent at an annualized rate, or nearly 62 percent higher than in March when the annualized rate was 2.6 percent. The era of relatively low rate of price inflation was feared to be ending.

For almost a decade, despite significant increases in the money supply, CPI-measured price inflation remained “tame.” Between March 2011 and March 2021, the M-2 money supply (cash, checking accounts, and small savings) went from $8.94 trillion to $19.9 trillion, or a 222.5 percent increase. Just in 2020, M-2 expanded by nearly 25 percent.

Yet, despite this, the CPI only went up by a little less than 20 percent, from 223 to 266.8 (100 = 1982-1984) between 2011 and 2021. The annual rates of CPI price inflation for this ten-year period were mostly less than 2 percent. What is called “core” price inflation – the CPI minus energy and food prices – averaged each one of these ten years a bit higher most of the time, but not by much in this period. (See my article, “Dangerous Monetary Manipulations and Fiscal Follies”.)

But what, exactly, does the Consumer Price Index tell us? All price indexes, including the CPI, are statistical constructions created by economists and statisticians that, in fact, have very little to do with the actions and decisions of consumers and producers in the everyday affairs of market demand and supply. And they are certainly not accurate and precise guides for central bank monetary policy.

Overall versus “Core” Price Inflation

…click on the above link to read the rest of the article…
Olduvai IV: Courage
Click on image to read excerpts

Olduvai II: Exodus
Click on image to purchase

Click on image to purchase @ FriesenPress