Home » Posts tagged 'eia' (Page 10)

Tag Archives: eia

Olduvai
Click on image to purchase

Olduvai III: Catacylsm
Click on image to purchase

Post categories

Post Archives by Category

Has U.S. oil production started to turn down?

Has U.S. oil production started to turn down?

The plunge in oil prices last year led many to say that a decline in U.S. oil production wouldn’t be far behind. This was because almost all the growth in U.S. production in recent years had come from high-cost tight oil deposits which could not be profitable at these new lower oil prices. These wells were also known to have production declines that averaged 40 percent per year. Overall U.S. production, however, confounded the conventional logic and continued to rise–until early June when it stalled and then dropped slightly.

Anyone who understood that U.S. drillers in shale plays had large inventories of drilled, but not yet completed wells, knew that production would probably rise for some time into 2015–even as the number of rigs operating plummeted. Shale drillers who are in debt–and most of the independents are heavily in debt–simply must get some revenue out of wells already drilled to maintain interest payments. Some oil production even at these low prices is better than none. Only large international oil companies–who don’t have huge debt loads related to their tight oil wells–have the luxury of waiting for higher prices before completing those wells.

The drop in overall U.S. oil production (defined as crude including lease condensate) is based on estimates made by the U.S. Energy Information Administration (EIA). Still months away are revised numbers based on more complete data. But, the EIA had already said that it expects U.S. production to decline in the second half of this year.

What this first sighting of a decline suggests is that glowing analyses of how much costs have come down for tight oil drillers and how much more efficient the drillers have become with their rigs are off the mark. It was inevitable that oil service companies would be forced to discount their services to tight oil drillers in the wake of the price and drilling bust or simply go without work. And, it makes sense that the most inefficient uses of drilling rigs would be halted.


…click on the above link to read the rest of the article…

Oil Shipments by Rail Declining

Oil Shipments by Rail Declining

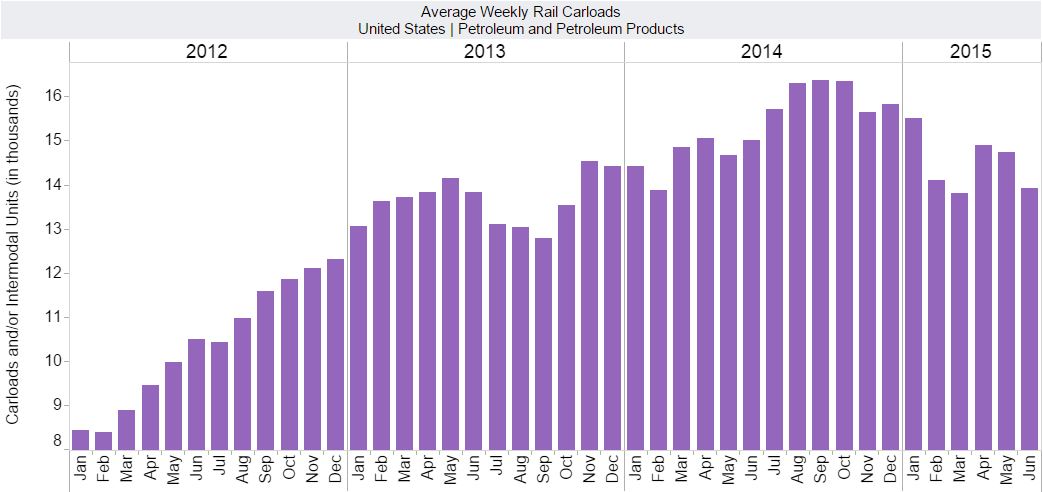
Weekly oil shipments by rail can be found on the web at Weekly Carload Reports. And a summation of that data with charts can be found at Association of American Railroads  Freight Rail Traffic Data.

Rail Oil Carloads 3

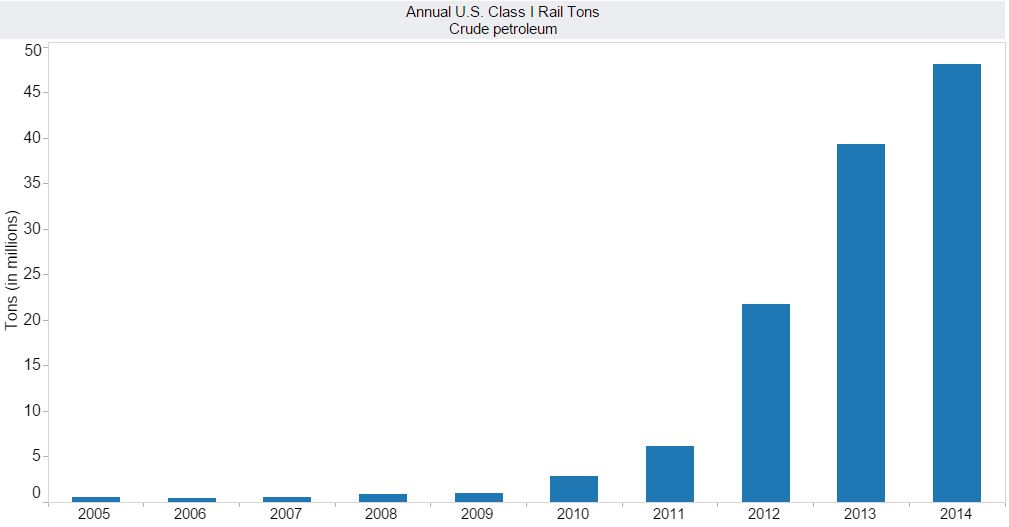
Crude oil by rail basically started with the shale boom. Prior to that almost all oil was shipped by pipeline. Of course a lot of oil was trucked to the pipelines. The EIA says in the first seven months of 2014 8 percent of all us crude and refined products was shipped by rail. It looks like that percentage was increased somewhat in the second half of 2014.

Rail Oil Carloads

Oil by rail, for the entire USA, peaked in August, September and October of 2014 and has declined since.

Daily Oil by Rail 2

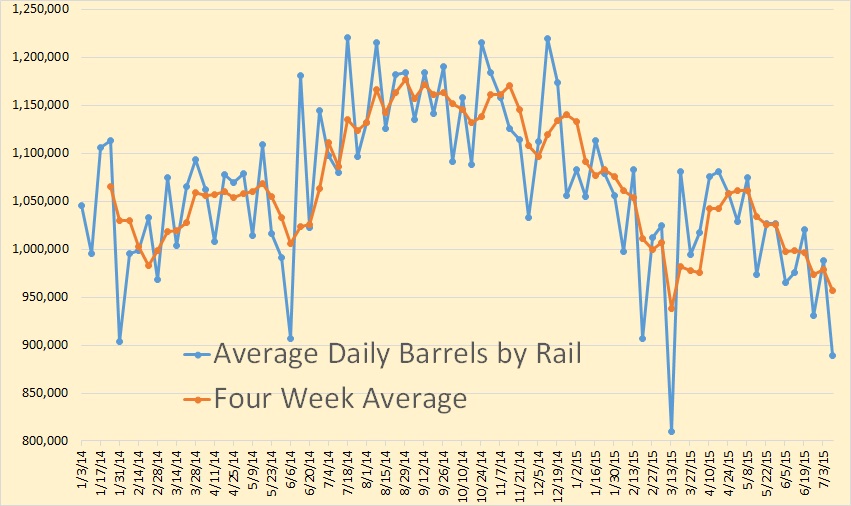
I have converted the weekly carloads to daily then converted carloads to barrels. There are about 700 barrels per carload. That gives us the average barrels per day by rail.

Daily Oil by Rail

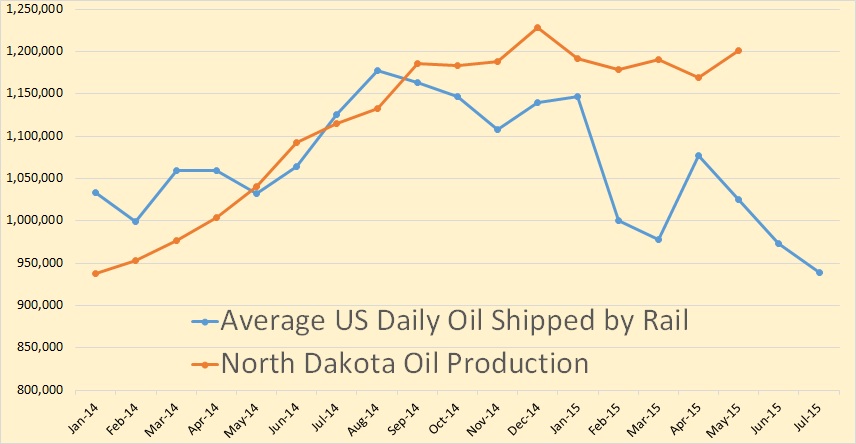
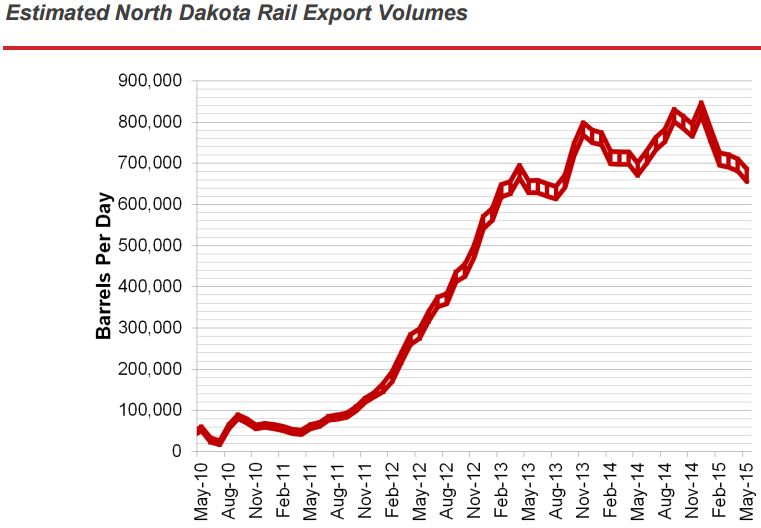
I have converted the weekly “daily average” to monthly “daily average” and plotted it against the North Dakota production. The EIA says: Between 60% and 70% of the more than 1 million barrels per day of oil produced in the state has been transported to refineries by rail each month in the first half of 2014, according to the North Dakota Pipeline Authority.

Rail Oil ND 1

As we can see from this chart the volume of oil shipped by rail changes from month to month. The chart is barrels per day per month. The peak, for North Dakota, is December 2014. Oil by rail for the USA peaked about three months earlier.


…click on the above link to read the rest of the article…

EIA Confirms: Oil Production Peaked

EIA Confirms: Oil Production Peaked

U.S. oil production has peaked…at least for now.

That is the conclusion from a new government report that concludes that U.S. oil production is on the decline. After questions surrounding the resilience of U.S. shale and when low oil prices would finally cut into production, the EIA says the month of April was the turning point.

In its Short-Term Energy Outlook released on July 7, the EIA acknowledged that U.S. oil production peaked in April, hitting 9.7 million barrels per day (mb/d), thehighest level since 1971. In May, production fell by 50,000 barrels per day, and EIA says that it will continue to decline through the early part of next year. Still, the declines won’t be huge, according to the agency’s forecast – production will average 9.5 mb/d in 2015 and 9.3 mb/d in 2016.

The EIA figures move a little closer to what some critics have been saying for some time. Data from states like North Dakota and Texas had pointed to slowing production for months while EIA posted weekly gains in production figures for the nation as a whole. Along with several consecutive weeks of inventory drawdowns, EIA figures started to look a little suspect. The latest report is sort of an acknowledgement that those figures were a little optimistic.

Nevertheless, as the EIA affirms peak production in the second quarter of 2015, the fall in output over the next few quarters should bring supply and demand back into balance, or at least close to it. Supply exceeded demand by more than 2.5 mb/d in the second quarter of this year, but that gap will narrow to 1.6 mb/d in the third quarter and just 500,000 barrels per day in 2016.

…click on the above link to read the rest of the article…


Top 5 Oil Producing Countries Could See Production Peak This Year

Top 5 Oil Producing Countries Could See Production Peak This Year

The EIA’s Short-Term Energy Outlook came out a few days ago. That is where they try to guess the future production and price for oil, for the USA as well as the world. As of late they seem to be getting a little timid with their predictions. They are saying not much growth is happening until the fourth quarter of 2016, and only a slight bump then.

(Click to enlarge)

This chart is Non-OPEC Total Liquids in million barrels per day. Production of N.O Liquids surged upwards from September of 2012 until December 2014, gaining 6.38 million barrels per day in those 27 months. That’s an average increase of 236,000 barrels per day per month. But then in January 2015 there was a drop of 800,000 bpd.

Non-OPEC total liquids still have not reached that December high again but the EIA thinks they will by August. I have my doubts. I also think they have their April and May liquids production estimates a little too high here. I have their predictions here starting in June though the EIA starts their projection in July. But there is no way that June production is anything but a guess here, and a bad guess at that.

(Click to enlarge)

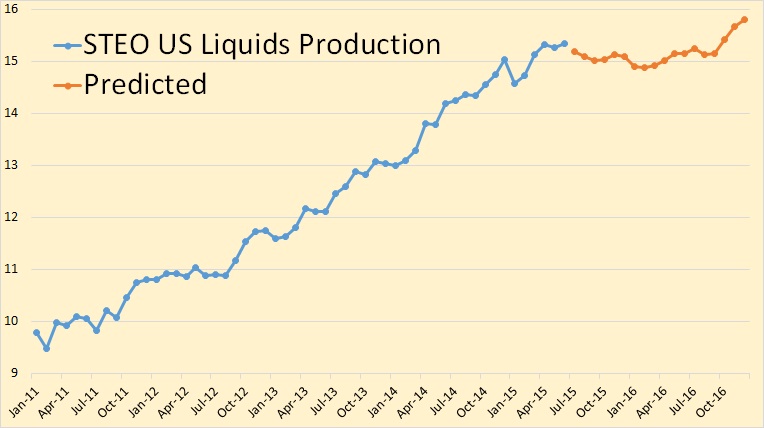
For four and one half years, US Total Liquids increased by an average of over 100,000 barrels per day per month. Now the EIA says US Liquids have reached a plateau where they will remain through September of 2016. Then for some unknown reason the US will resume it upward surge.

Notice the huge decline of 460,000 bpd in January 2015. But then there was an increase of 160,000 bpd in February, 390,000 bpd in March and 190,000 bpd in April. That’s an increase of 740,000 barrels per day over three months when the US rig count was falling dramatically. I look for those numbers to be revised in the next couple of months.


…click on the above link to read the rest of the article…

The EIA’s Short-Term Guessing Game

The EIA’s Short-Term Guessing Game

STEO N-O Liquids

This chart is Non-OPEC Total Liquids in million barrels per day. Production of N.O Liquids surged upwards from September of 2012 until December 2014, gaining 6.38 million barrels per day in those 27 months. That’s an average increase of 236,000 barrels per day per month. But then in January 2015 there was a drop of 800,000 bpd.

Non-OPEC total liquids still have not reached that December high again but the EIA thinks they will by August. I have my doubts. I also think they have their April and May liquids production estimates a little too high here. I have their predictions here starting in June though the EIA starts their projection in July. But there is no way that June production is anything but a guess here, and a bad guess at that.

STEO US Liquids

For four and one half years, US Total Liquids increased by an average of over 100,000 barrels per day per month. Now the EIA says US Liquids have reached a plateau where they will remain through September of 2016. Then for some unknown reason the US will resume it upward surge.

Notice the huge decline of 460,000 bpd in January 2015. But then there was an increase of 160,000 bpd in February, 390,000 bpd in March and 190,000 bpd in April. That’s an increase of 740,000 barrels per day over three months when the US rig count was falling dramatically. I look for those numbers to be revised in the next couple of months.


…click on the above link to read the rest of the article…

The EIA’s Questionable Numbers

The EIA’s Questionable Numbers

EIA Post 1

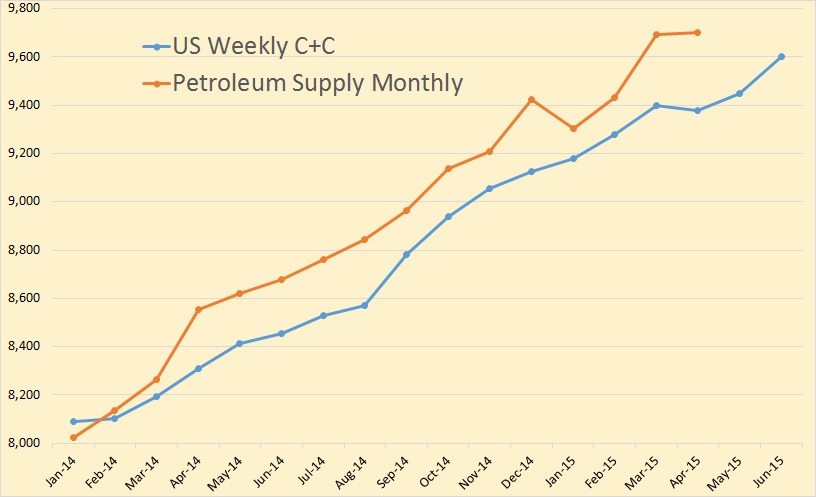
I averaged the weekly numbers and converted them to monthly data. They were pretty close for the first three months of 2014 but then they begin to diverge. Of course they were much closer earlier but in the Petroleum Supply Monthly has, over several months, been revised upward. The Weekly Petroleum Status Report is never revised.

In April, the Petroleum Supply Monthly shows US C+C production 322,000 barrels per day above the weekly average of the Weekly Petroleum Status Report.

EIA Post 2

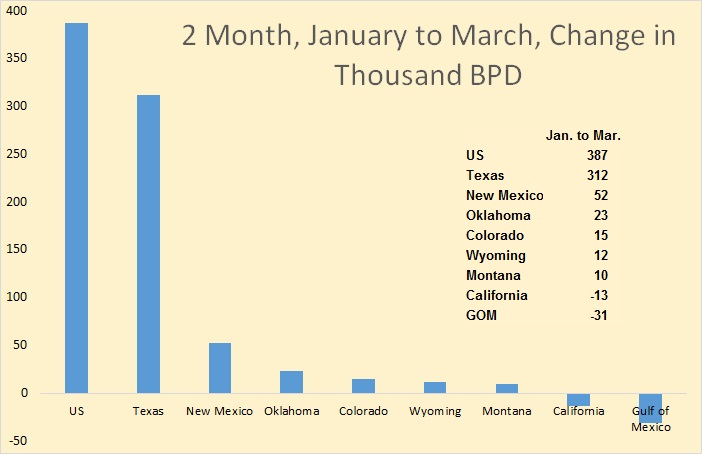
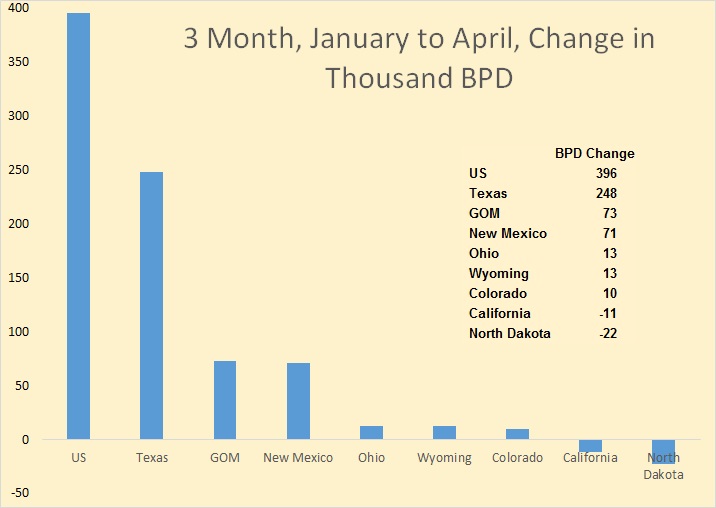
The Petroleum Supply Monthly shows US production increased 387,000 barrels per day in the two months January to March. That is an increase when oil rigs were being stacked by the dozens. They show Texas up 312,000 over those two months and New Mexico up 52,000 bpd. That means they think the Permian, which is mostly in Texas but partly in New Mexico, was really booming during those two months.


EIA Post 3

The EIA has crude production continuing to climb during April, up 396,000 bpd January to April. The Gulf of Mexico, which had been down slightly the previous three months, was shown up 104,000 in April, giving them a gain of 71,000 bpd over the three months.

But obviously Texas is where all the action is.


…click on the above link to read the rest of the article…

EIA Data Still Doesn’t Add Up

EIA Data Still Doesn’t Add Up

As initially pointed out by Peakoilbarrel.com in a recent article, discrepancies between actual data for oil production in Texas vs. what the EIA claims are so stark it’s almost scary. How this can be overlooked by the mainstream media as well as by most of the broker community is even more alarming. Further, how the U.S. oil industry fails to catch it and question it given that their livelihood is tied to it is even scarier.

Using the data plotted on the Texas RRC website, combined with the knowledge that Bakken production has been flat to declining, makes us wonder how in the world the EIA can not only restate monthly production higher recently, starting in March, but expect over a 700,000 barrels per day (B/D) overall increase for 2015.

Using the EIAs own data off their website on page 7 of their June monthly report, in Texas they expect a 2015 increase of 400,000 B/D (3592 vs. 3164 in table below) alone. Historical data through May shows production essentially flat from March to May (3609 vs. 3675) as well as in 1Q15 to 2Q15 (3602 vs. 3614).

Related: Could Armenia Be The Next Ukraine?

TexasRRCFigures

(Click Image To Enlarge)

Comparing these figures with Texas RRC figures off their website, the differences are startling. First, the chart below clearly shows the trend through 4/1/15 as being flat to down, as production nosedived in April by nearly 15 percent, compared with the previous month, and 15 percent from end of 2014.

Yes, these numbers bounce around but, plotting the monthly data below, the trend is clearly down, not up. So the first question is: what prompted the EIA to boost expectations recently, starting in March, when the data is clearly flat in the largest region of EIA growth expectations?

…click on the above link to read the rest of the article…


U.S. Oil Glut An EIA Invention?

U.S. Oil Glut An EIA Invention?

In the latest weekly production data from the EIA, on the back of recent March revisions, the U.S. managed to post a 76,000 barrel per day increase in the lower 48. Production from Alaska fell by 61,000 barrels per day, putting overall U.S. output 15,000 barrels per day higher for the week ending June 12 compared to the previous week.

This comes at a time when multimillion barrel draws have become the norm. It is important to note that lower 48 production is estimated based on an EIA black box model, while Alaska is virtually real time data. That suggests that the weekly supply estimates are hugely overestimated.

These weekly supply numbers are then used as a basis to jump to the conclusion that the markets are suffering from too much supply. As stated on OilPrice.com many times before, the amount of “over supply” vs. the averages in the U.S. according to the EIA amounts to tens of millions of barrels of oil.

I continue to maintain that the EIA revision to production came very suspiciously at exactly the same time inventory draws began, as did the “Miscellaneous to Balance” figure used in calculating inventory. The chart below clearly shows when this figure started to grow and by what amount. It totals more than 30 million barrels since April and has been rising, which is virtually all of the oversupply above the mean in the U.S! To reiterate that number is at discretion of the EIA and is not an actual data point but an “adjustment.”

Related: The Growing Sino-Latin Energy Relationship

Data Errors Have Real World Consequences

This figure, as created by the EIA, has (with the media’s help) created the impression of a huge oil glut in the U.S. market. No one, either within the media or the industry, has asked for clarification of this number and it is instead taken as gospel. This is now wreaking havoc in energy states such as Texas, as well as threatening most oil companies as well as tens of thousands employed within the oil and gas industry. With such importance placed on a number which has impacted not only billions of dollars in company revenue but many lives for the worse, how can it be largely unchallenged by all but a few in the media?


…click on the above link to read the rest of the article…

New International Energy Statistics.

New International Energy Statistics.

World

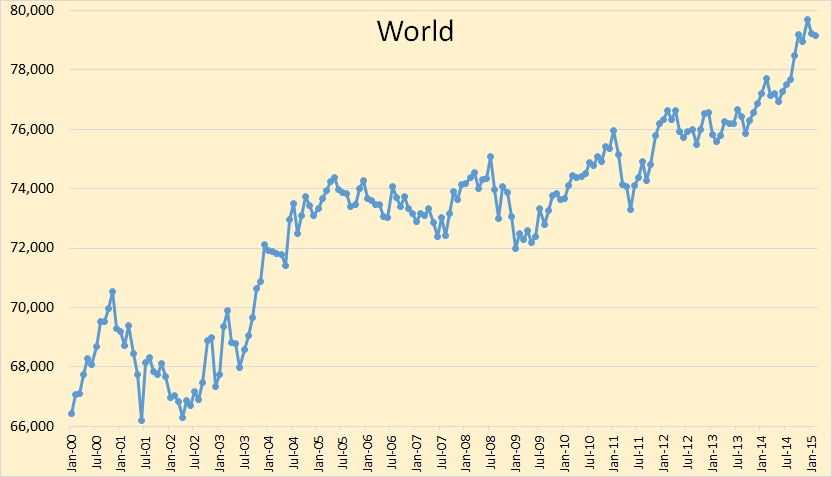
World C+C dropped 477,000 bpd in January and another 65,000 bpd in February for a total decline of 542,000 bpd. World C+C stood at 79,160,000 barrels per day in February.

Non-OPEC

Non OPEC C+C declined 244,000 bpd in January and another 100,000 bpd in February for a total decline of 344,000 since December. Non-OPEC C+C production stood at 46,656,000 bpd in February.

OPEC C+C

OPEC C+C, in February 2015 stood at 32,504,000 bpd, down 1,451,000 bpd from its peak in April 2012. However according to the OPEC MOMR their crude only is up 1,000,000 bpd from February to May.


Why A U.S Shale Slowdown Will Hardly Effect Oil Prices

Why A U.S Shale Slowdown Will Hardly Effect Oil Prices

Just last week I wrote on the possibility of a renewed downturn in oil prices, owing to the fact that huge volumes of supplies could potentially come online in places like Iraq, Libya, and Iran. That is still the case.

But let’s look at the other side of the coin. Despite the surprising resilience of U.S. shale, production could be now entering an extended period of decline. The EIApredicts that output in the major shale regions could decline by 91,000 barrels per day in July.

An ongoing and deeper contraction is likely. The EIA also reports a dramatic decline in well completions since October of last year. When prices starting falling, especially after the November 2014 OPEC meeting, rig counts started vanishing from the field and drilling companies began completing fewer wells.

(Click to enlarge)

That is important because shale wells suffer from rapid decline rates in their production profiles. After about the first year, the initial burst of oil largely peters out, and the decline rate is precipitous. As a result, a large number of fresh wells need to constantly be completed just to keep output flat.

Related: Global Oil Production Substantially Lower Than Believed

With the number of well completions down, falling production from wells that were drilled in the past start to become more obvious. This “legacy decline” is now overtaking new production, most likely forcing overall net production to have dipped into negative territory in May.

(Click to enlarge)

The volume of legacy declines will only increase as it will increasingly reflect the huge volume of production that came online in 2013 and 2014. All of that recent production won’t be replaced as drillers sit on the sidelines. That means the decline in total production will only accelerate in the months ahead.


…click on the above link to read the rest of the article…

Texas Oil and Gas Production for April

Texas Oil and Gas Production for April

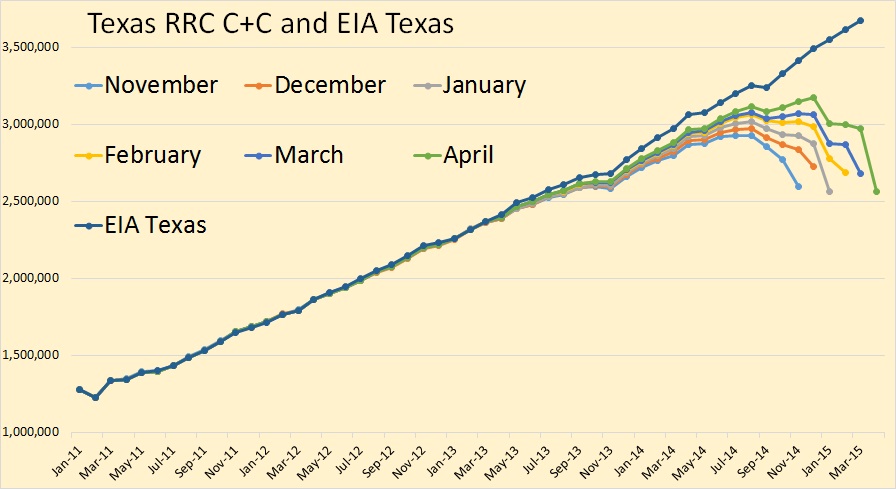
The preliminary Texas RRC Production Data is out this morning. There appears to be a considerable drop in Texas crude oil production in April. All Texas RRC data in the charts below is through April 2015 and all EIA data is through March 2015.

For those new to this site, the Texas RRC data is incomplete. The drooping lines will eventually, after the final data comes in, closer resemble the EIA data. Though I believe the EIA data is quite a bit too high at this point.

Texas C+C

It appears that, when the final data comes in that Texas will have took a huge hit in January, recovered somewhat in February and March, then took another hit this past April.

Dean C+C

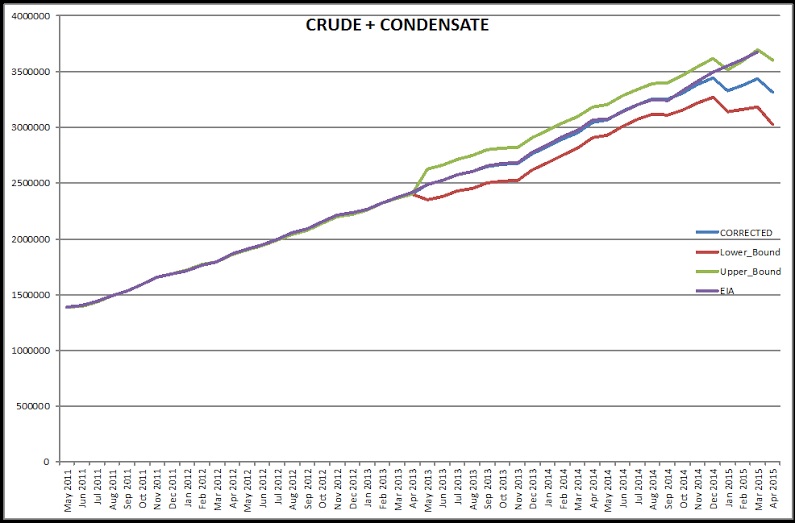
Dr. Dean Fantazzini, with his algorithm that calculates the final production numbers, also comes to the conclusion that Texas took a hit in April production. Dean has three results with the most probable in the middle.


…click on the above link to read the rest of the article…

A Bit Of Perspective On Gasoline Prices

A Bit Of Perspective On Gasoline Prices

To me, commodity pricing today is so distorted that it is almost startling. The media continues its post Goldman Sachs’ bearish calls to pound away on OPEC supply with little attention paid to rising demand. Admittedly, as we end the summer driving season, such demand will wane, adding pressure for supplies to draw down as we head into the fall. Even the EIA seems to think this trend will likely begin in July.

The focus this week in the media is Saudi supply, as it negotiates with India for more supply without mentioning a reason: demand is up. This, even after reiteration upon reiteration from the Saudis that demand is exceeding expectations. Even the EIA has finally admitted it, although as expected, they upped their U.S. supply estimates to over 700,000 barrels per day in 2015 to offset the euphoria. I have my doubts on this call of higher supply as I’ve written before.

Related: Oil Prices Responding Positively To Bad News, But Why?

I have emphasized the point of waning supply, tied to depletion, for months now, which, like demand has gone unspoken in the media with the overriding narrative focused on efficiency gains or well productivity instead. The bias is very clear at this point and so is the media agenda.

In the near term, shorting in highly leveraged names ahead of the fall credit redetermination has caused equities to decouple from oil prices. Energy prices are at or near highs and even natural gas has recovered some while E&P equity prices for leveraged names are at lows. Look for a substantial pick up in M&A soon which, more than prices, will act as a catalyst on equity prices in my view.


…click on the above link to read the rest of the article…

OPEC + Different EIA Data

OPEC + Different EIA Data

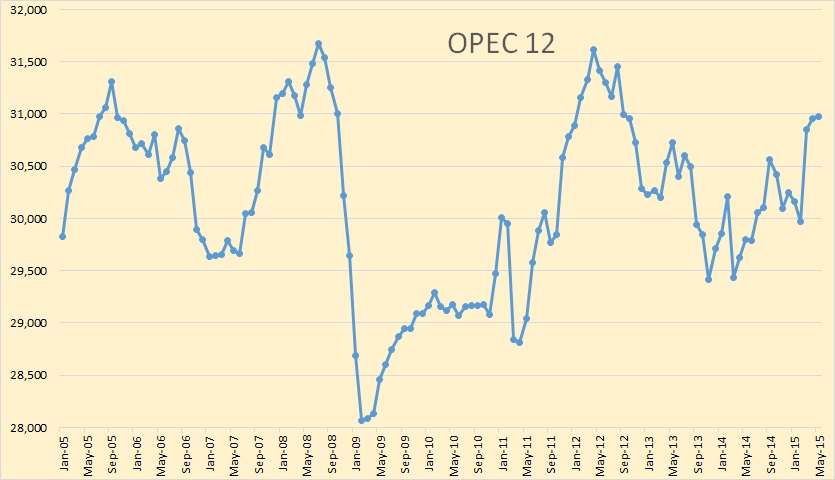
OPEC 12

OPEC crude only production was up 23,000 bpd in May but that was after April had been revised upward by 110,000 bpd.

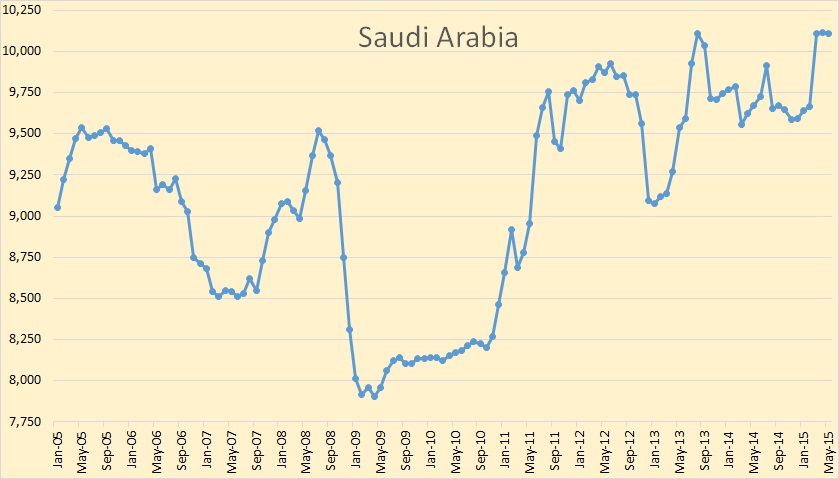
Saudi Arabia

Almost no change is Saudi production, down 5,000 bpd to 10,107,000 bpd.

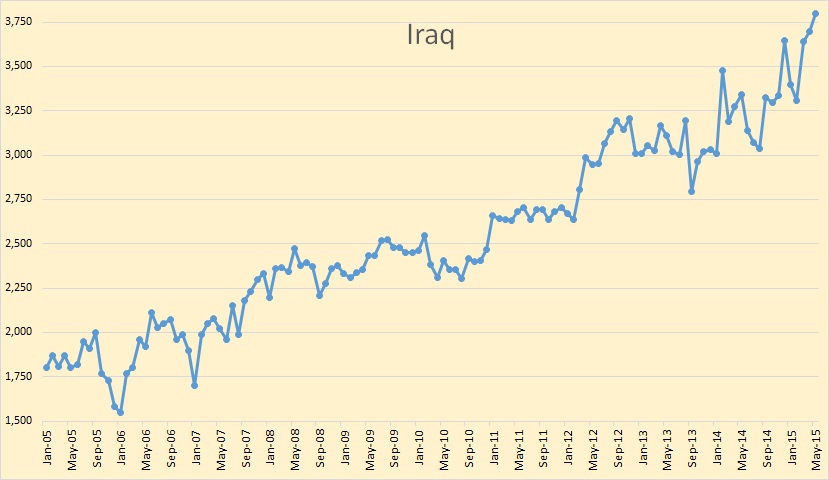
Iraq

Iraq had the largest change of all, up 105,000 bpd to 3,800,000 bpd.


…click on the above link to read the rest of the article…

Why EIA, IEA, and BP Oil Forecasts are Too High

Why EIA, IEA, and BP Oil Forecasts are Too High

When forecasting how much oil will be available in future years, a standard approach seems to be the following:

  1. Figure out how much GDP growth the researcher hopes to have in the future.
  2. “Work backward” to see how much oil is needed, based on how much oil was used for a given level of GDP in the past. Adjust this amount for hoped-for efficiency gains and transfers to other fuel uses.
  3. Verify that there is actually enough oil available to support this level of growth in oil consumption.

In fact, this seems to be the approach used by most forecasting agencies, including EIA, IEA and BP. It seems to me that this approach has a fundamental flaw. It doesn’t consider the possibility of continued low oil prices and the impact that these low oil prices are likely to have on future oil production. Hoped-for future GDP growth may not be possible if oil prices, as well as other commodity prices, remain low.

Future Oil Resources Seem to Be More Than Adequate

It is easy to get the idea that we have a great deal of oil resources in the ground. For example, if we start with BP Statistical Review of World Energy, we see that reported oil reserves at the end of 2013 were 1,687.9 billion barrels. This corresponds to 53.3 years of oil production at 2013 production levels.

If we look at the United States Geological Services 2012 report for one big grouping–undiscovered conventional oil resources for the world excluding the United States, we get a “mean” estimate of 565 billion barrels. This corresponds to another 17.8 years of production at the 2013 level of oil production.

…click on the above link to read the rest of the article…


The EIA’s Drilling Productivity Report

The EIA’s Drilling Productivity Report

The EIA has released its latest Drilling Productivity Report. There were some interesting data presented in the report.

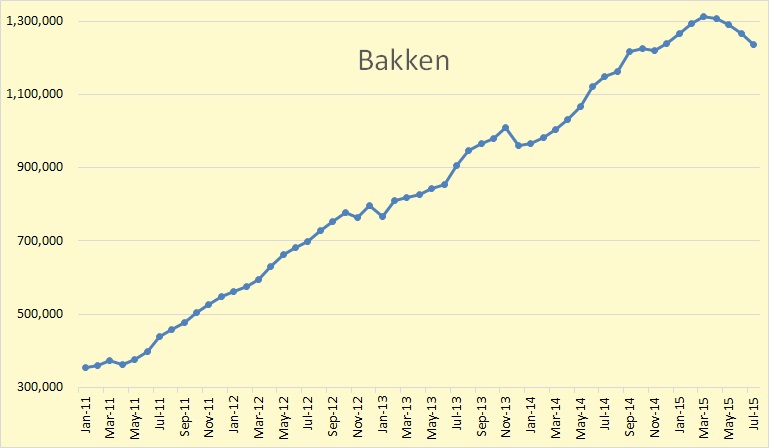
DPR Bakken

They say the Bakken peaked at 1,311,703 barrels per day in March and will have declined by 74,763 bpd in July.

DPR 1

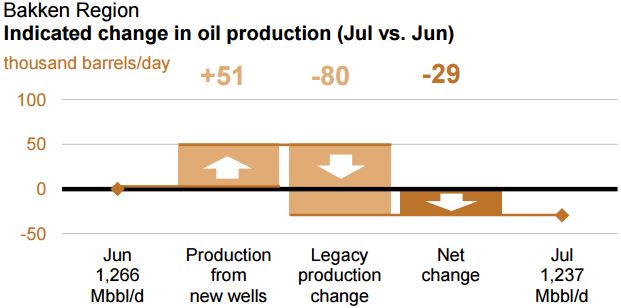
The EIA says the Bakken will get 51,000 barrels per day in July from new wells but legacy wells will decline by 80,000 barrels per day leaving a decline of 29,000 bpd.

DPR Eagle Ford

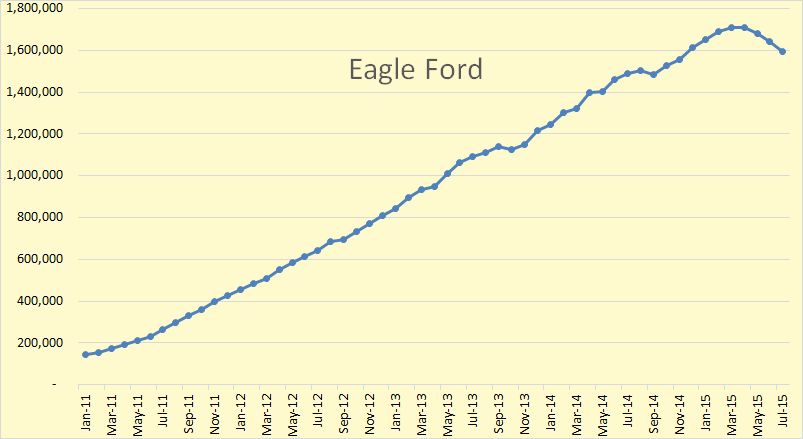
The EIA says Eagle Ford peaked in 1,711,376 barrels per day in March and will have declined by a total of 117,971 bpd in July.

DPR 2

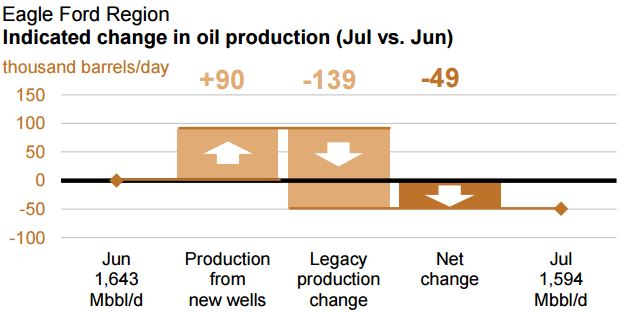
The EIA says Eagle Ford will get 90,000 bpd from new wells in July but the decline from legacy wells will be 139,000 bpd leaving a decline of 49,000 bpd.

DPR Niobrara

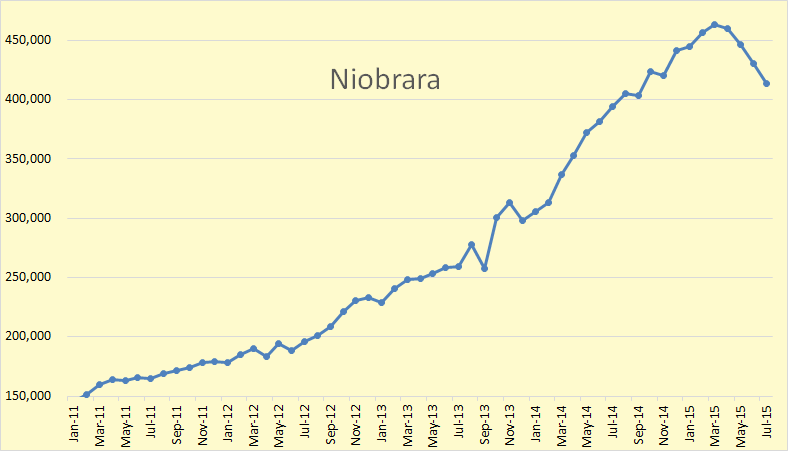
The EIA says Niobrara peaked in March at 459,861 bpd and will have declined by 49,712 bpd by July.


…click on the above link to read the rest of the article…

Olduvai IV: Courage
Click on image to read excerpts

Olduvai II: Exodus
Click on image to purchase

Click on image to purchase @ FriesenPress