My “Wealth Effect Monitor” for the Money-Printer Economy: Holy Moly, October Update
The bottom 50% need not apply. They just get to eat the soaring costs of housing. How the Fed totally blew out the already gigantic wealth disparity during the pandemic.
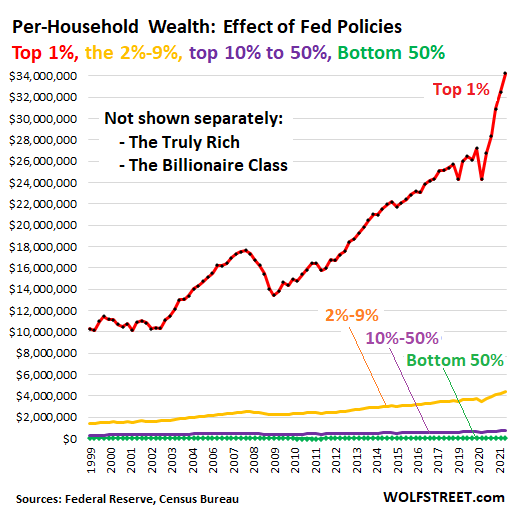
On Friday, the Fed released the detailed data about the wealth of households by wealth category for the 1%, the 2% to 9%, the “next 40%” (the top 10% to 50%) and the “bottom 50%” for the second quarter, after having released less detailed figures on September 23. You read the stories at the time about how the Fed’s money-printing and interest-rate-repression has enriched American households.
But the detailed data, just now released, show whose wealth jumped the most, and who got left endlessly further behind. It wasn’t households in general that benefited, but only the richest households with the most assets. The more assets they had, the more they benefited.
My Wealth Effect Monitor divides the wealth (assets minus liabilities) for each wealth category by the number of households in that category, which produces average per-household wealth within each category. The wealth of the bottom 50% is reflected by the jagged green line on the bottom, essentially on top of the horizontal axis:

Not shown separately are the truly rich – the 0.01% – and the Billionaire Class. The Fed wisely doesn’t provide any information on them separately, but includes them in the Top 1%.
But according to the Bloomberg Billionaires Index, the top 30 US billionaires are worth on average $69 billion per household currently, having gained on average $2.2 billion in wealth each over the quarter.
The bottom 50% of US households (green line above) – 63.2 million households – are worth on average $47,900 per household. But this includes $25,970 in “durable goods” (cars, phones, furniture, etc.), which for consumers are normally considered consumables, not assets, because their values are declining, and they don’t produce incomes.
…click on the above link to read the rest of the article…