“Not QE”, Monetization, & “Definitely Asset Inflation”
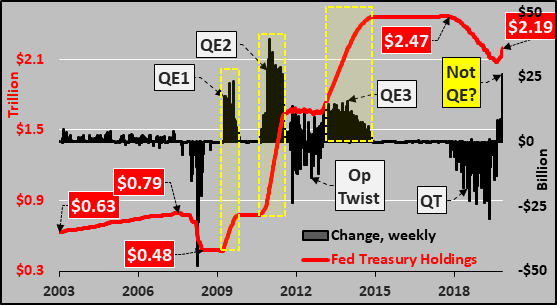
Chart below shows the Federal Reserve holdings of Treasuries, a weekly change (black columns) and total holdings (red line) during QE1, QE2, Operation Twist, QE3, QT, and “Not QE”. Got it?!? This current “Not QE” explosion in QE is like some kind of old time vaudeville act (like the old Abbott and Costello bit, “who’s on first, what’s on second, I don’t know’s on third”).
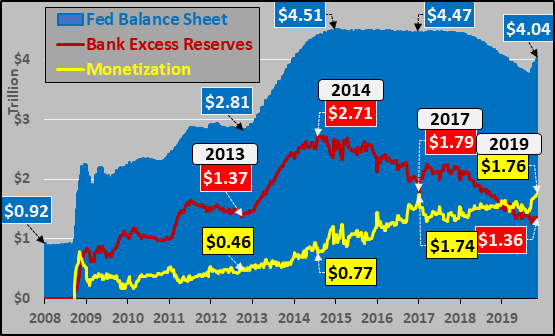
But looking more widely, the chart below shows the total Federal Reserve balance sheet (blue shaded area), bank excess reserves (red line), and the delta between the Fed’s balance sheet and excess reserves…also known as direct monetization. As the Fed restarted “not QE” but did not go through the façade of attempting to stock the new money away as “excess reserves”, this new money is flowing straight into assets, like monetary heroine.
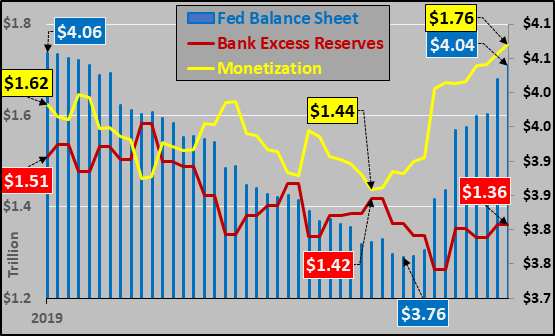
Below, a close up of the components above solely in 2019 (through November 6th). Balance sheet soaring once again since the Fed’s sudden pivot, excess reserves continue falling…and the difference in freshly digitized cash in the hands of banks and the like…ready to be levered up.
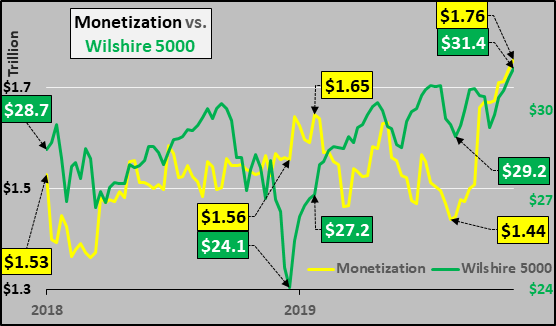
So, monetization (yellow line) versus the Wilshire 5000 (green line) from 2014 through last week. For those not familiar, the Wilshire 5000 total market index, is a market-capitalization weighted index of the market value of all US stocks actively traded in the US.
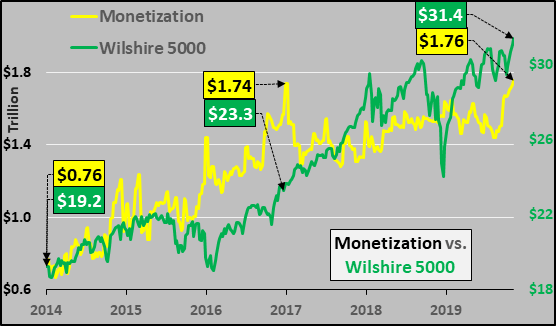
And fascinatingly, since the beginning of 2018, the Wilshire 5000 and direct monetization are becoming more attuned to one another. And in mock shock, the new record close in the Wilshire just happens to be accompanied by a new record in direct monetization!?! Almost as if the addition of $320 billion in fresh digital cash since mid August Fed U-turn had something to do with the $2.2 trillion rise in US equities over the same period (a leverage ratio of about 7x). Hmmm.
…click on the above link to read the rest of the article…