Home » Posts tagged 'eia' (Page 8)

Tag Archives: eia

Olduvai
Click on image to purchase

Olduvai III: Catacylsm
Click on image to purchase

Post categories

Post Archives by Category

Oil Plunges to $32-Handle, Chinese Stocks Crash and are Halted, Whiff of Mayhem Breaks out

Oil Plunges to $32-Handle, Chinese Stocks Crash and are Halted, Whiff of Mayhem Breaks out

After having been through the greatest two-year loss on record, the price of oil plunged 9.6% on Wednesday and in evening trading. As I’m writing this, WTI hit $32.62 a barrel, a new low since the desperate depth of the Financial Crisis, when it very briefly kissed $30.28 a barrel on December 23, 2008, before bouncing off sharply.

This time, it’s serious. Brent, the global benchmark, has crashed to $32.75, an 11-year low. This isn’t a quick scare that happens during a Financial Crisis. It’s the result of a persistently growing glut.

Since the oil price plunge began in July 2014, every rally, every “opportunity of a lifetime” to buy oil “for cents on the dollar” has turned out to be a falling knife.

This is what the three trading-day, 15% crash of WTI looks like:

US-crude-WTI-price-2016-01-06

The contagion of the oil price plunge has been drifting into other sectors of the US economy, housing and office space in Houston, the state budget in Alaska, jobs, manufacturing…. Investments have gone up in smoke. Loans have gone bad. Defaults, restructurings, and bankruptcies are now a routine occurrence. Banks are looking over their shoulder. PE firms are licking their wounds from their mega-bets on fracking made in prior years, and they’re licking their new wounds from having tried to catch many falling knives.

This isn’t going to be an easy bust to get through. It’s a US problem. And it’s a global problem.

In the US, crude oil production started declining on a monthly basis in mid-2015, according to EIA estimates. But despite those monthly declines, production averaged 9.3 million barrels per day in 2015, the highest rate since 1972, and a 7% increase over 2014.

…click on the above link to read the rest of the article…

All Roads Lead To Peak Oil

All Roads Lead To Peak Oil

I use the Canadian National Energy Base data for Canada instead of the strange numbers JODI has for Canada. And I use the EIA data for the few small producers that JODI does not report.

With these Changes I think I have composed an excellent World Oil Database from this composite data. And with the October data just released I have composed the below charts. The data is through October and is in thousand barrels per day.

JODI World C+C

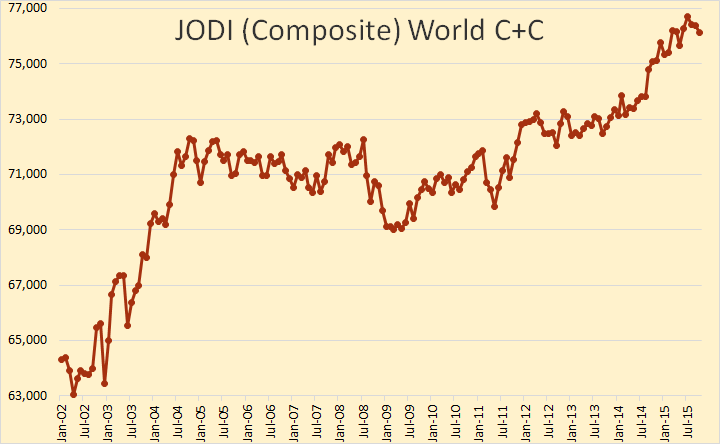
World oil production peaked, so far, in July at 76,702,000 barrels per day and in October stood at 76,128,000 bpd or 574,000 bpd below the peak.

JODI Non-OPEC

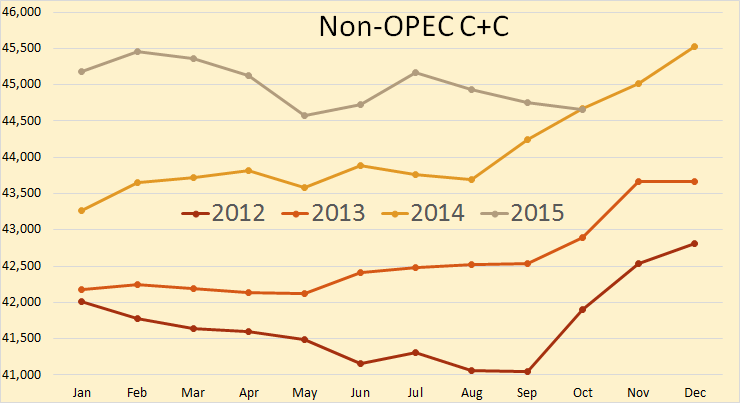
Non-OPEC peaked, so far, in December 2014 at 45,530,000 bpd and in October stood at 44,662,000, down 868,000 bpd or just under 2% in 10 months.

JODI Non-OPEC 4 years

For the first time in 4 years Non-OPEC production has dropped below the level it was the same month the previous year. This means the 12 month trailing average has turned negative, though just barely.

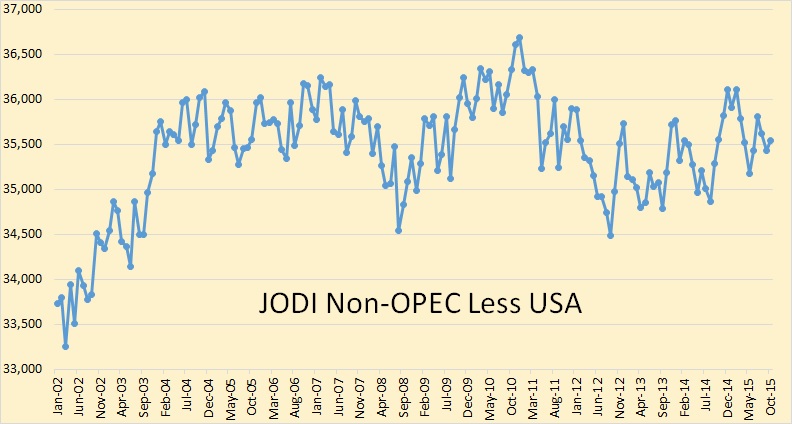
Jodi Non-OPEC less USA

Non-OPEC less the USA has been on a 12 year bumpy plateau. In fact it stood at 35,422,000 barrels per day in October, 214,000 bpd less than the level reached in December 2003.

…click on the above link to read the rest of the article…

Government Influence Over Asset Prices Growing

Government Influence Over Asset Prices Growing

The facts are OECD stocks have fell in October, not increased. That runs against the generally accepted belief that storage capacity is full and we are oversupplied by around 2 million barrels per day (mb/d). That suggests that the IEA is underestimating demand and grossly exaggerating inventory levels.

Further, the EIA has consistently overstated supply in its weekly data release, “adjusting” inventory up by seemingly arbitrary amounts. Now, according to Cornerstone Analytics, last week we find that the EIA is under-sampling small producers whose production is rapidly declining. Also, monthly production figures continue to be inflated. This conclusion from Cornerstone Analytics is noteworthy:

“On the USA, one point we will leave you with is that there appears to be some scope for the DOE to revise down American oil production figures for the past few months. Our sense is that the monthly survey numbers for production have ‘undersampled’ output from small independent producers whose output has been more negatively impacted from the activity fall-off as compared with the larger producers.”

The problem these days is that markets are controlled by people who don’t take care to delve deep into numbers and simply don’t question numbers being fed to them by media or government agencies. Instead they trade off headlines and care less about their validity because it suits their agenda, ideology or, even more likely, unconscious bias, reinforced by propaganda.

…click on the above link to read the rest of the article…
EIA Says Shale Continues to Decline

EIA Says Shale Continues to Decline

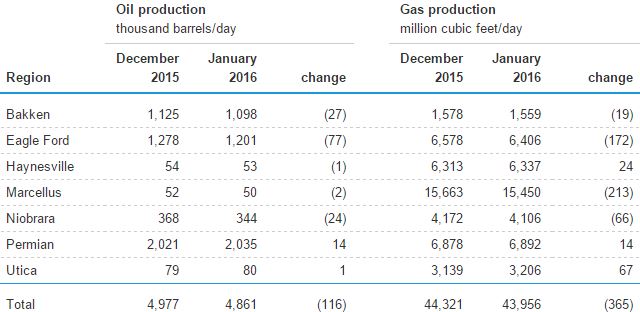
DPR Totals

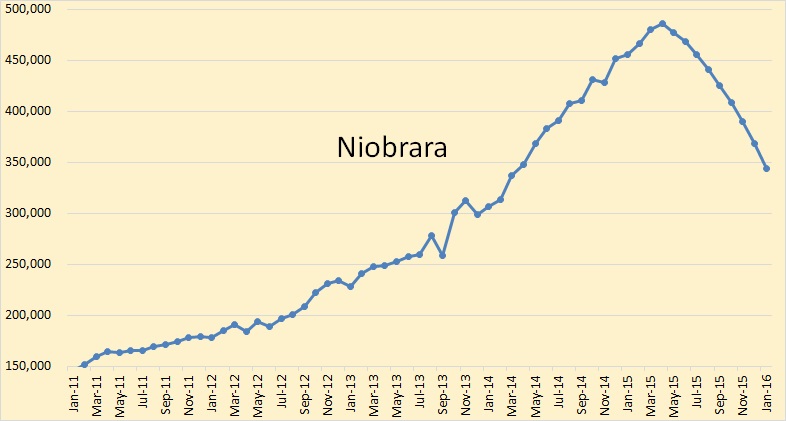
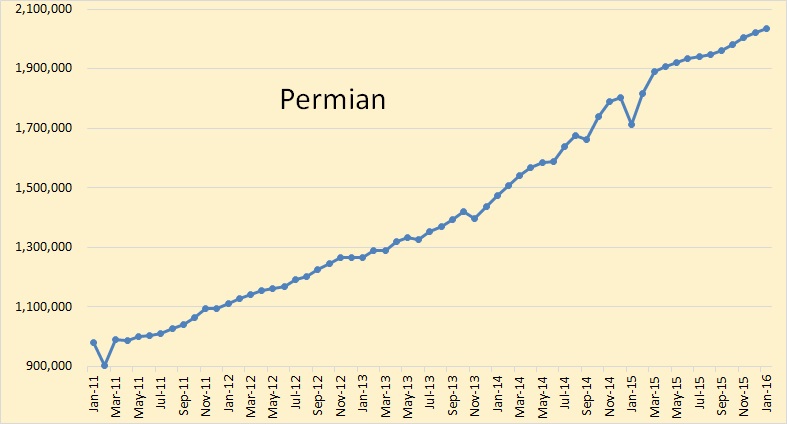
The big drops here are Eagle Ford, Bakken and Niobrara. They have the Permian still increasing in production. An expected drop of 116,000 barrels per day drop in January is very significant.

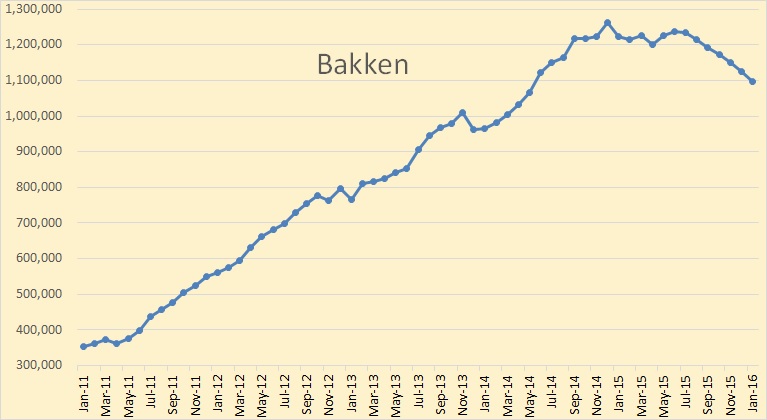
DPR Bakken

They have the Bakken in a continual decline after July. It is important to note that the EIA’s Drilling Productivity Report has the Bakken decline, July thrugh September, very close to what the North Dakota Industrial Commission has. So it appears that the DPR is getting better with its production estimates.

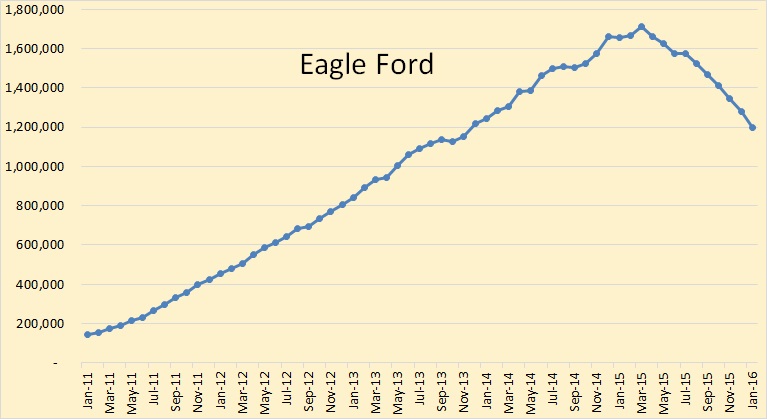
DPR Eagle Ford

Eagle Ford is where the action is, or isn’t, depending on your point of view. Dropping 77,000 barrels per day to start the New Year does not bode well for shale production in 2016.

DPR Niobrara

Niobrara appears to have the steepest drop since the March peak. But actually they, if the DPR is correct, will be down 28.37% since March while Eagle Ford is down 29.81%, The Bakken will be down 10.35% while the Permian will be up 7.59%.

DPR Permian

…click on the above link to read the rest of the article…

Egypt update: net oil importer and chokepoints

Egypt update: net oil importer and chokepoints

Oil production and consumption 

Fig 1: Oil production vs consumption

After a post-peak decline production has stabilized but consumption has increased relentlessly at a long-term 1.7% pa, slightly below population growth of around 2% pa. Egypt is now a net oil importer. On these trends, the gap between consumption and production is likely to get larger. This increases imports and the need for fuel subsidies. Let’s zoom into the monthly oil production (crude and NGL separately)

Fig 2: Production of crude oil and natural gas plant liquids

Crude oil production declined again since 2009 at 2.5% pa, offset by an increase in NGLs of 4.7% pa

Fig 3: Net crude exports and refinery utilisation

The crude oil exported up to 2005 (at low oil prices!) is now missing. EIA data are presently only available up to 2012. The EIA writes:

According to data from OPEC’s Annual Statistical Bulletin, Egypt’s refined petroleum output averaged 445,000 b/d in 2013, suggesting that refinery utilization was about 63%. Egypt’s refining output declined by 28% from 2009 to 2013. Facts Global Energy attributes this decline to Egypt’s policy that permits foreign oil producers to export more crude oil as repayment of EGPC’s financial debt. As a result, Egypt’s crude oil exports [56% EU, 28% India, 13% China] have not declined over the past few years, despite declining production. In turn, there is a lower volume of domestic crude oil available for the domestic refineries, and Egypt must make up for the difference by importing petroleum products and/or crude oil. Egypt imported about 145,000 b/d of petroleum products in 2014, according to Global Trade Information Services. Egypt also exported about 60,000 b/d of petroleum products that same year.

…click on the above link to read the rest of the article…
Oil Prices Down As Storage Keeps On Filling Up

Oil Prices Down As Storage Keeps On Filling Up

Happy Thanksgiving Eve! One hundred and forty-eight years to the day after Alfred Nobel patented dynamite, and the fuse has been lit for an explosion to the downside for the crude complex.

After geopolitical tension was stoked yesterday, attention shifts back to oversupply today with the weekly EIA inventory report. Yesterday afternoon’s API report yielded a build of 2.6 million barrels to crude stocks, as well as solid builds to the products. This has adjusted expectations ahead of the EIA report, as a lesser 1 million barrel build was being baked into the cake.

Yesterday we discussed how copper is at a six-and-a-half year low due to a combination of falling Chinese demand and a rising US dollar. The chart below illustrates that despite the downward trend in copper prices, an ongoing supply glut is set to persist, as lower-cost projects come to fruition after billions of dollars have already been invested. Accordingly, global copper production is expected to reach an all-time this year…and is projected to rise through the rest of the decade.

Related: Big Oil: Which Are The Top 10 Biggest Oil Companies?

Given the broad-based sell-off we have seen in commodities, from copper to crude to coal, Bloomberg’s commodity index – which tracks 22 natural resources – has plunged two-thirds lower from its peak in 2008 to the lowest level since 1999:

Today is ‘double data day‘, as tomorrow’s Thanksgiving holiday means we get the EIA natural gas storage report a day early. A minor injection of +6 Bcf is expected, which will further add to the record storage level of 4.000 Tcf.

…click on the above link to read the rest of the article…
A Surprising Look at Oil Consumption

A Surprising Look at Oil Consumption

First, who’s oil consumption is increasing year after year, or who’s economy is booming? All charts below are consumption as total liquids in thousand barrels per day. Some charts are through 2014 while others are through 2013. Whatever the last year is on the yearly axis is the last year for that data.

Important: All charts are consumption, not production. 

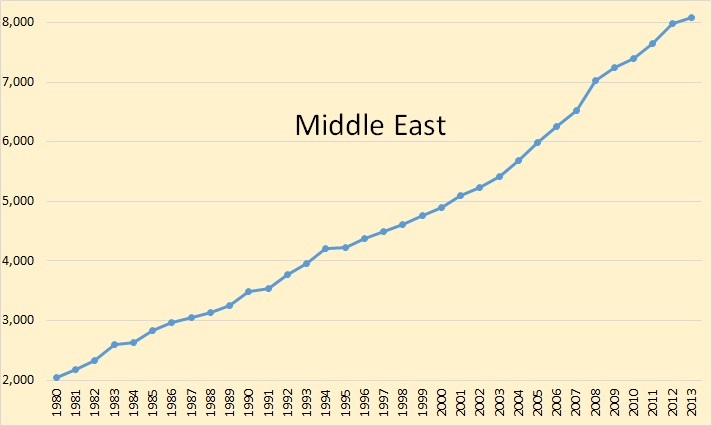
C. Middle East

No doubt the Middle East is booming. The reason, most of them are oil producers and oil, for most of this chart anyway, the price of oil was increasing. They had lots of income, their consumption was increasing every year as was their economies.

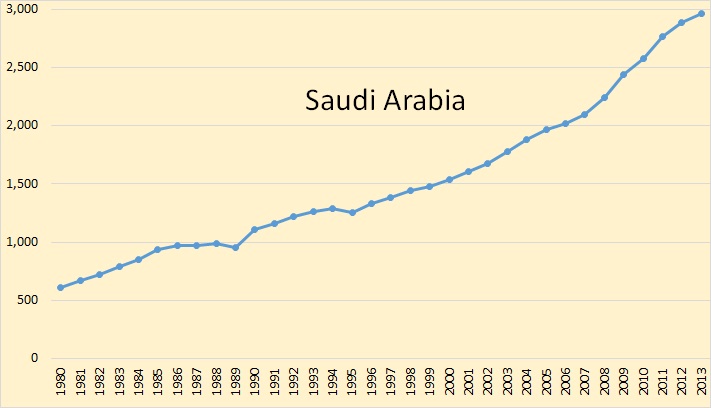
C. Saudi Arabia

Saudi Arabia, by far the Middle East’s largest consumer, has increased consumption every year since 1995.

…click on the above link to read the rest of the article…
The Case For Peak Oil

The Case For Peak Oil

JODI World C+C

World crude oil production has taken off during the last two years due primarily to US shale oil production and higher output from OPEC. However very high oil prices has enabled many other countries to increase drilling rigs and production.

JODI Non-OPEC

Low oil prices are having an effect on Non-OPEC oil production though not nearly as much as a lot of people thought they would, and not nearly as soon either.

Big 5

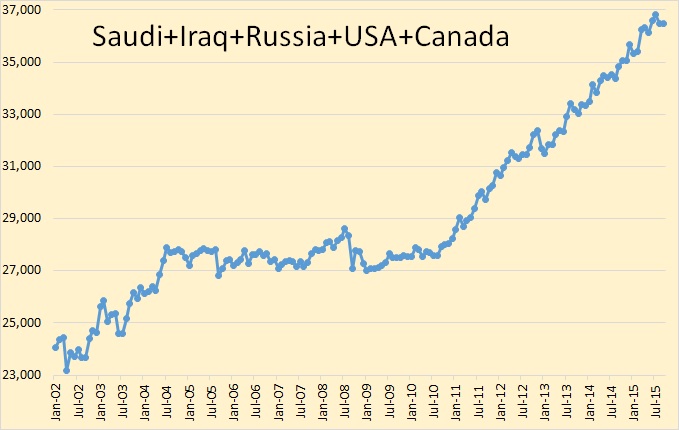
Five nations, Saudi Arabia, Iraq, Russia, USA and Canada, have been responsible for way more than 100 percent of the increase in oil production in the last decade.

World Less Big Five

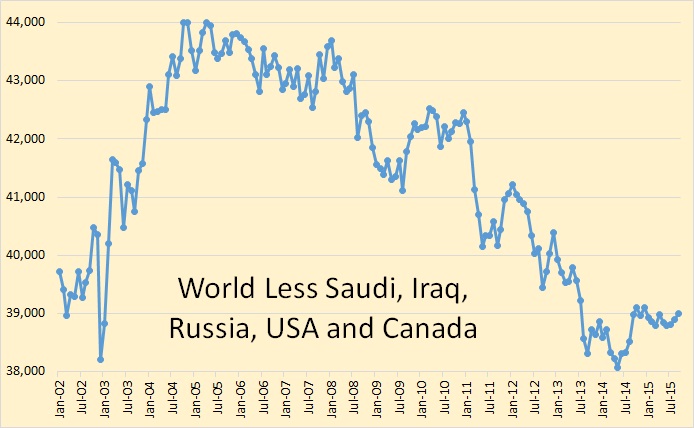
The world less the five nations charted above is down 5,000,000 barrels per day since 2005. This decline is despite the fact that oil prices, during much of that time, has been above $100 a barrel.

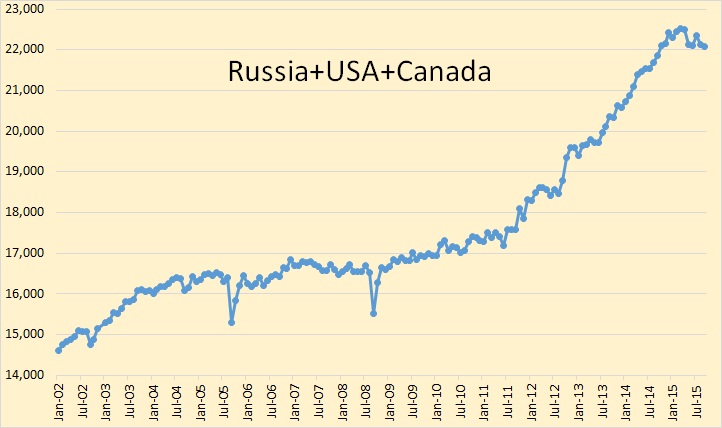
A look at the Non-OPEC segment of this group.

Russia, USA and Canada

…click on the above link to read the rest of the article…
US Oil Production by State

US Oil Production by State

US Total C+C

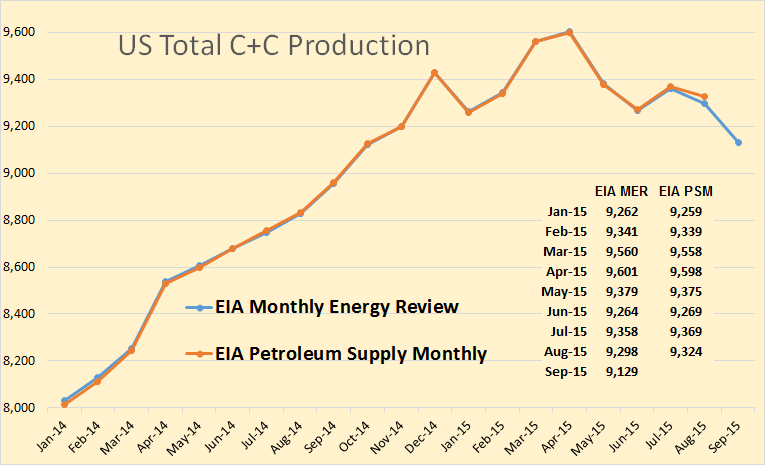
The Petroleum Supply Monthly June 15 production numbers were revised down considerably this month. And you can see they had a drop of 169,000 bpd in September. I think there will likely be an even larger drop in October. At any rate US production is finally starting to drop significantly.

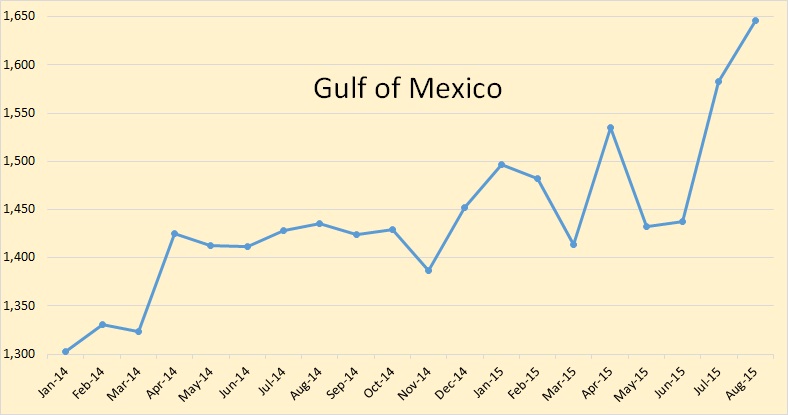
Gulf of Mexico

The Gulf of Mexico is the one place that is bucking the trend. The GOM was up 146,000 bpd in July and up another 63,000 bpd in August for a total of 209,000 bpd for the two months.
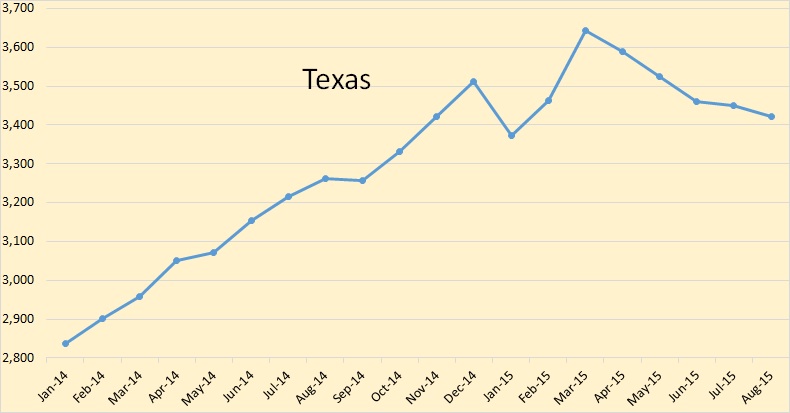
Texas

Texas was down for the fifth straight month.

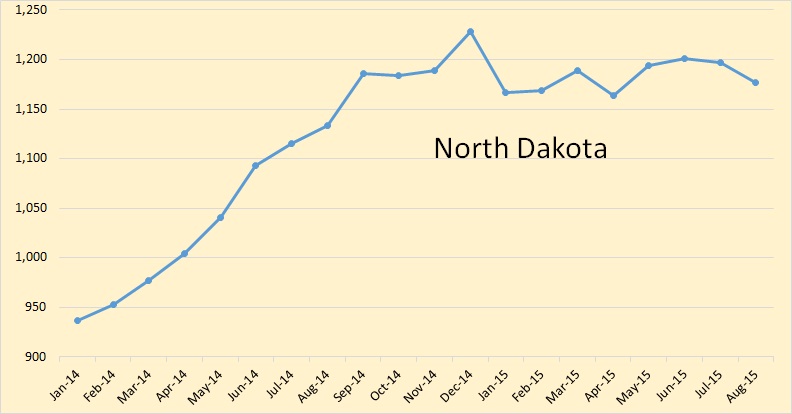
North Dakota

North Dakota has been moving sideways but is now below their September 2014 level.

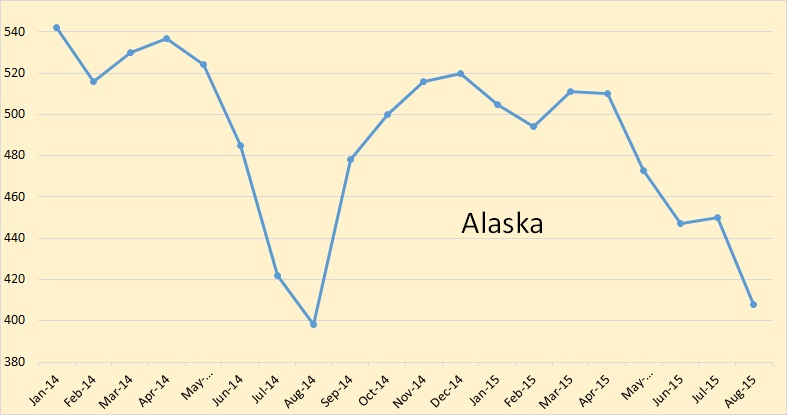
Alaska

Alaska is slightly above their August 2014 level but their average annual production will drop by between 25 and 50 thousand bpd this year.

Oklahoma

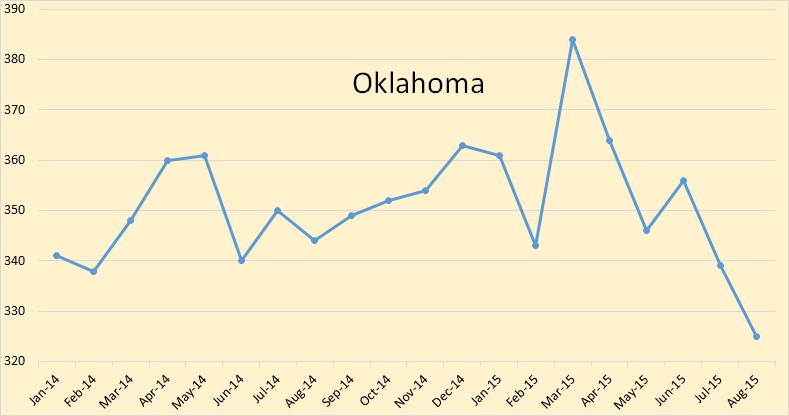
Oklahoma has dropped 59,000 bpd since March.

New Mexico

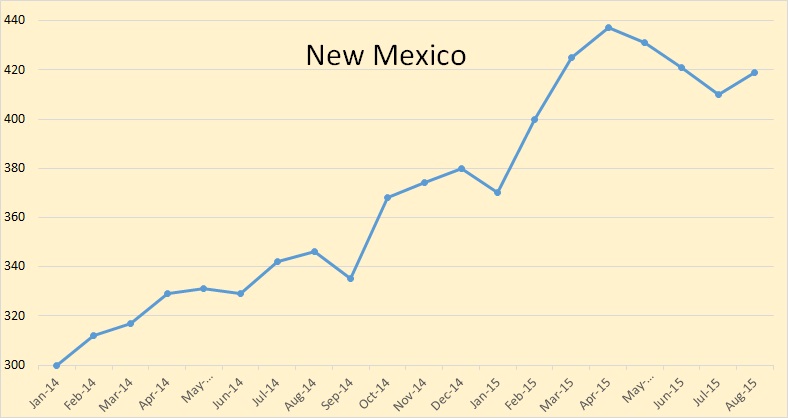
New Mexico which holds part of the Permian recovered slightly in August.

…click on the above link to read the rest of the article…
Ivy League Universities Pushing Oil Industry Agenda With No Accountability

Ivy League Universities Pushing Oil Industry Agenda With No Accountability

Harold Hamm isn’t the kind of guy you’d expect to be name dropping Ivy League schools. Born in Oklahoma, his education ended with his graduation from high school. Which didn’t stop him from becoming a multi-billionaire by building his own oil and gas fracking company, Continental Resources — a company that bills itself as “America’s Oil Champion.”

So for a self-made man from oil country, it wasn’t surprising to see a PowerPoint slide with the bullet points “Rigs, Rednecks, and Royalties” during his presentationthis June at the annual Energy Information Administration conference in Washington, D.C. Although when he referred to the oil producing sections of the U.S. as “Cowboyistan” it didn’t get the laugh he was probably expecting.

What was a bit surprising was to see him touting the work of Columbia and Harvard to support his argument to lift the ban on exporting crude oil produced in the US.

There have been a dozen studies so far, everyone of them come[sic] out with the same thing – lower gasoline prices….These are not folks who write about our industry all the time. We’re talking Columbia, we’re talking Harvard…”

Now, Hamm’s attempt to distance Columbia and Harvard from the oil industry was probably a clever tactic and not based on ignorance. Hamm has probably spent more time in D.C. this year than some members of Congress.

From the EIA conference to multiple appearances before congressional committees, Hamm has been pushing to get the oil export ban lifted.

Either way, he is wrong to say that Columbia and Harvard don’t write about the oil industry all of the time.

At Columbia University there is a rather new division of the school that does just that called the Center on Global Energy Policy(CGEP).

…click on the above link to read the rest of the article…
 

Texas Oil and Gas Decline in August

Texas Oil and Gas Decline in August

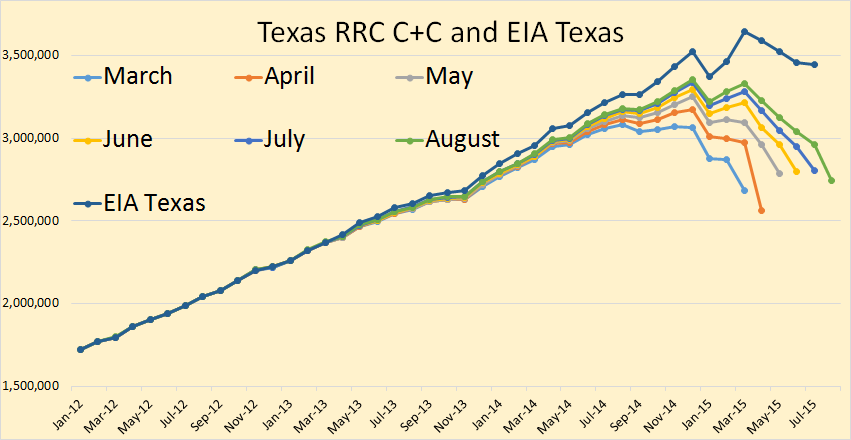
Texas C+C

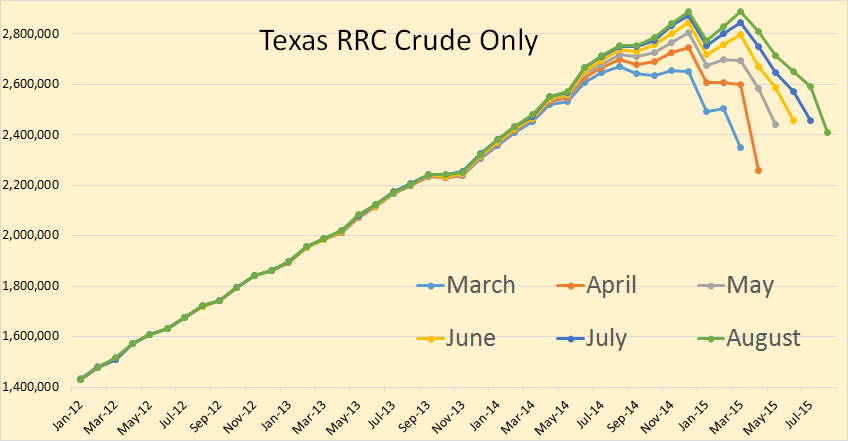
The RRC data is always incomplete but if this month’s incomplete data is less than last month’s incomplete data then that’s a pretty good indicator that production this month is down.

The EIA data here is only through July. They have Texas production peaking in March at 3,644,000 barrels per day and declining by 197,000 bpd to 3,447,000 bpd in July.

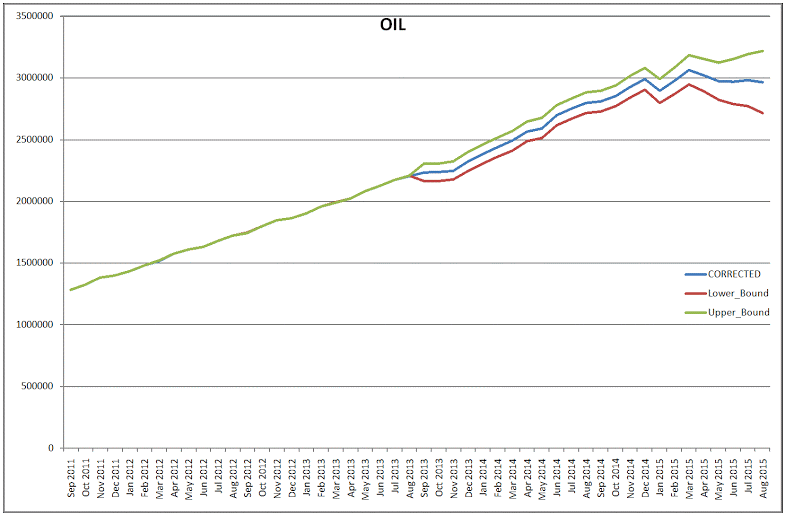
Dean C+C

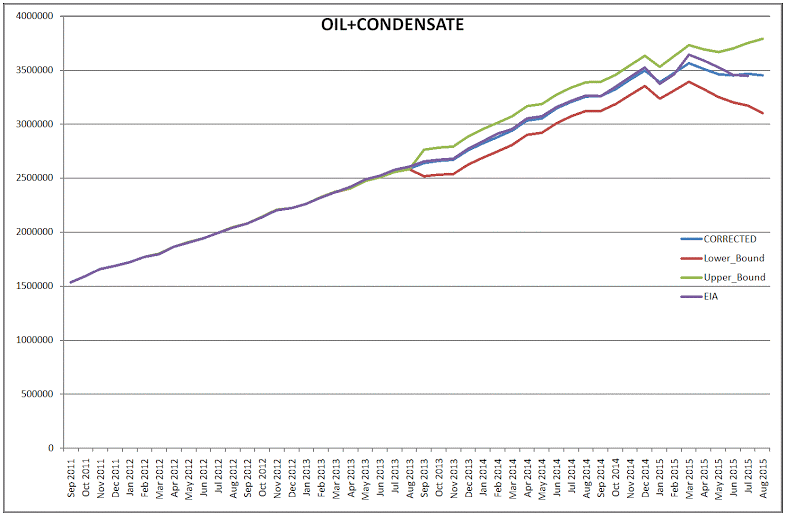
Dr. Dean Fantazzini has Texas peaking in March also, at a slightly lower point than the EIA but they both pretty much in agreement by July.

Texas Crude Only

Texas crude only, when the final data comes in, will show the peak in March.

Dean 1

Dean’s algorithm still has crude only peaking in March but holding on a plateau since then.

…click on the above link to read the rest of the article…
Saudi, US Oil Inventories Hit Record High as Demand Fizzles

Saudi, US Oil Inventories Hit Record High as Demand Fizzles

In the US, oil storage is seasonal. A big buildup starting late fall gets Americans and their favorite gas or diesel sipping or guzzling toys or clunkers through “driving season” – late spring and summer – when somehow everyone has to drive somewhere. After driving season, petroleum stocks fall. This pattern has played out this year as well, but with a difference.

Last week, the EIA reported that crude oil stocks rose 7.6 million barrels to 468.6 million barrels, the highest for this time of the year since records have been kept. Crude oil stocks are now 98 million barrels higher than they were last year at this time, when they were already bouncing into the upper end of the 5-year range.

This chart from the EIA shows the out-of-whack relationship between the five-year range (gray area) and the weekly buildup (blue line) this time around:

US-crude-oil-stocks_2015-10-15

Instead of getting better somehow, this situation simply got worse over driving season. At the peak of the buildup this year, crude oil stocks were 22.5% higher than a year earlier. Now they’re 26.4% higher than they were at this time last year.

If the inventory buildup this fall, winter, and spring continues in this manner from today’s much higher starting point, we can look forward to a fiasco on the storage front – and on the pricing front. Because at this rate, by April, we’ll be having oil coming out of our ears!

But this is a global issue for producers (or conversely, an opportunity for oil consumers). Here’s Saudi Arabia, which has been pumping oil at record levels to maintain its market share against Russia and the boys from the oil patch in the US and Canada: its inventories are ballooning too.

…click on the above link to read the rest of the article…

EIA Short Term Energy Outlook

EIA Short Term Energy Outlook

STEO Non-OPEC Liquids

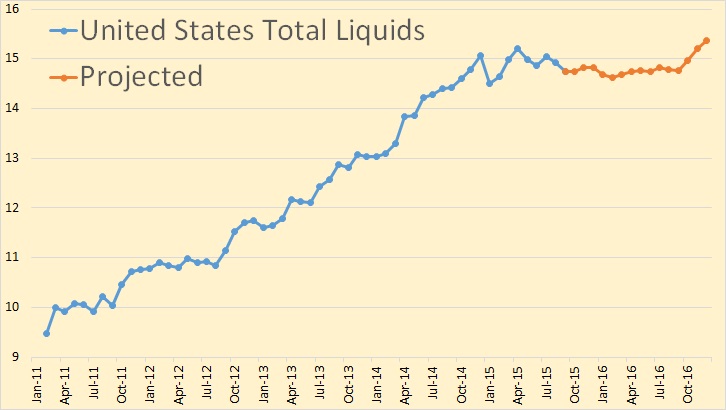
The EIA has Non-OPEC total liquids dropping 620,000 bpd in September, up 280,000 bpd in November but bottoming out in January, February and March, then climbing until October of 2016.

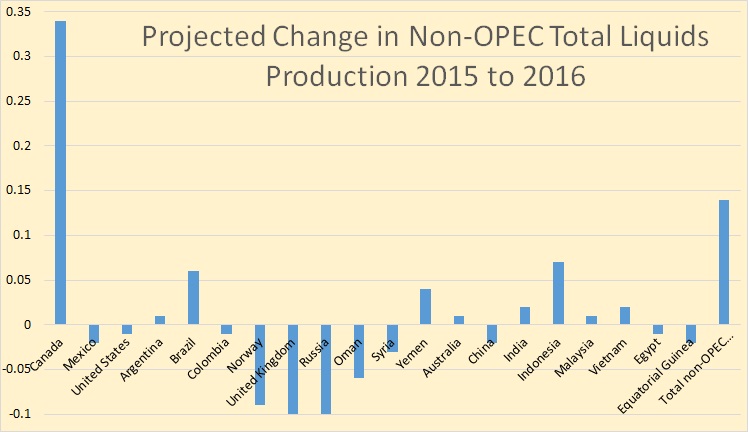
STEO Non-OPEC Change

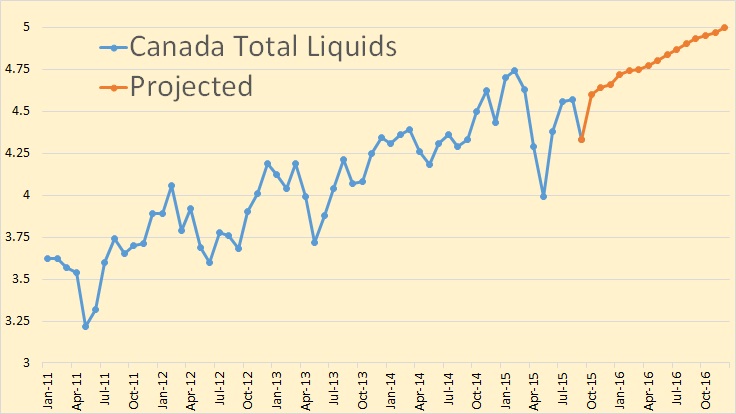
The EIA expects Non-OPEC average total liquids to increase by 140,000 bpd in 2016. The chart above shows the change they expect each country to make. Canada, by far, has the largest increase in production, up by 340,000 barrels per day. Without Canada’s input the EIA says, Non-OPEC total liquids production would be down by 200,000 bpd.

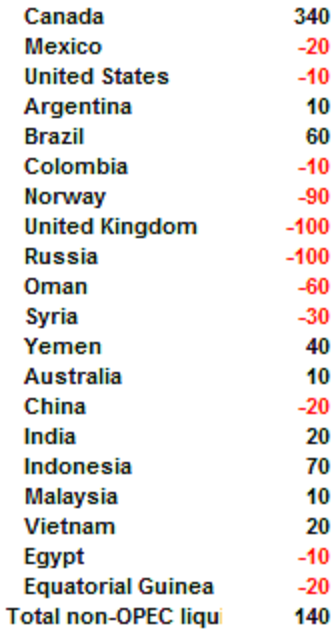
STEO Numbers

Here are the changes in Non-OPEC production the EIA expects each country to make 2015 to 2016 in thousand barrels per day. Countries not listed had zero expected change from 2015 to 2016.

STEO US Liquids

The EIA says US total liquids production dropped 180,000 bpd in September.

STEO Canada

Canada, the EIA says, was down 240,000 bpd in September and up again 270,000 bpd in October and then continue to climb at a steady pace through the end of 2016. The upward trend the EIA expects in Canadian production seems to match the same upward trend that Canada has experienced since 2011. It seems that the EIA expects the drop in the price of crude oil to have almost no effect whatsoever on Canadian total liquids production.

…click on the above link to read the rest of the article…

JODI Data and Giant Field Depletion

JODI Data and Giant Field Depletion

No, U.S. Oil Production Probably Didn’t Rise in July

The Joint Organizations Data Initiative (JODI) releases monthly oil supply-and-demand data for about 80 countries, which it gathers by directly surveying the countries. It is widely cited by analysts, especially for its figures on demand, imports and exports.

The latest JODI data released Sunday showed that U.S. crude-oil production rose from 9.3 million barrels a day in June to 9.5 million barrels in July.

But the EIA’s latest forecast called for July production to fall to 9.2 million barrels a day in July, continuing the trend of declining U.S. production as companies cut spending in the face of low prices.

For the charts below I have used JODI data for all Non-OPEC nations except those that do not report to JODI. For them I use the EIA data and carry forward the same data that the EIA reported, (April). For the USA, since the JODI data is obviously wrong for July, I simply carried forward the June data which also came directly from the EIA. And for OPEC I use the OPEC MOMR’s “secondary sources”. JODI also uses the MOMR for their data but uses the “direct communication” data instead of the secondary sources data.

The data below is through July 2015 and is in thousand barrels per day.

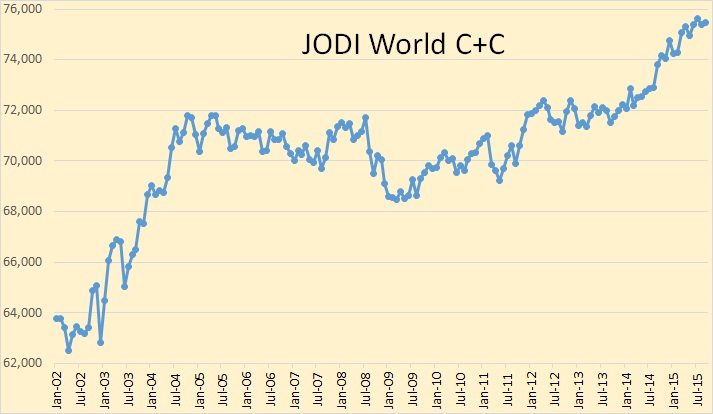
JODI World C+C

In July we remained at or near the world’s all time peak at 75,631,000 barrels per day, down just 15,000 bpd from June.

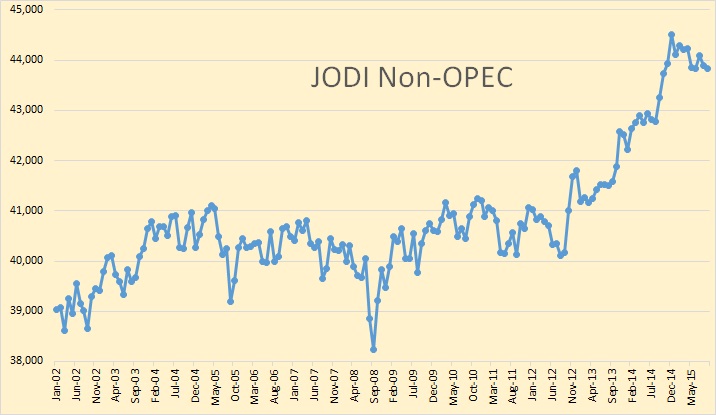
JODI Non-OPEC

JODI Non-OPEC stood at 44,100,000 bpd in July, down 567,000 bpd from the peak in December.


…click on the above link to read the rest of the article…

Tight Oil Reality Check

Tight Oil Reality Check

tight-oil-reality-check-blog
Much of the cost-benefit debate over fracking has come down to the perception of just how much domestic oil and gas it can produce and at what cost. To answer this question, policymakers, the media, and the general public have typically turned to the U.S. Department of Energy’s Energy Information Administration (EIA), which every year publishes its Annual Energy Outlook (AEO).

In Drilling Deeper, PCI Fellow David Hughes took a hard look at the EIA’s AEO2014 and found that its projections for future production and prices suffered from a worrisome level of optimism.

Recently, the EIA released its Annual Energy Outlook 2015 and so we asked David Hughes to see how the EIA’s projections and assumptions have changed over the last year, and to assess the AEO2015 against both Drilling Deeperand up-to-date production data from key shale gas and tight oil plays.

In July 2015, Post Carbon Institute published Shale Gas Reality Check, which found that in 2015 the EIA is more optimistic than ever about the prospects for shale gas, despite substantive reasons for caution.

This month we turn our eyes to the EIA’s latest projections for tight oil.

Key Conclusions

    • The EIA’s 2015 Annual Energy Outlook is even more optimistic about tight oil than the AEO2014, which we showed in Drilling Deeper suffered from a great deal of questionable optimism. The AEO2015 reference case projection of total tight oil production through 2040 has increased by 6.5 billion barrels, or 15%, compared to AEO2014.
    • The EIA assumes West Texas Intermediate (WTI) oil prices will remain low and not exceed $100/barrel until 2031.
    • At the same time, the EIA assumes that overall U.S. oil production will experience a very gradual decline following a peak in 2020.

…click on the above link to read the rest of the article…


Olduvai IV: Courage
Click on image to read excerpts

Olduvai II: Exodus
Click on image to purchase

Click on image to purchase @ FriesenPress