Home » Posts tagged 'oil demand' (Page 4)
Tag Archives: oil demand
Peak oil in Asia Update June 2020 (part 1)
Peak oil in Asia Update June 2020 (part 1)

Fig 1: Asian oil consumption is around 5 times higher than production
The production decline after the peak in 2015 is very modest. The size of the gap between consumption and production is mainly determined by consumption growth rather than by production decline. Will the Corona virus stop the gap growing?
Let’s have a look at which Asian countries consumed how much oil over the years

Fig 2: Asian oil consumption by country
Total Asia-Pacific oil consumption grew from 26.2 mb/d in 2009 to 36.2 mb/d in 2019 or by 10 mb/d This is net growth consisting of 11.6 mb/d gross growth (out of which 5.8 mb/d in China and 2 mb/d in India) and 1.6 mb/d gross decline (600 kb/d in Japan).

Fig 3: Subgroup with different trends
The subgroup in Fig 3 grew oil consumption at 330 kb/d pa after 2009 until 2017. Then countries above the dotted line (7.2 mb/d in 2019) peaked while the other countries below the dotted line (5.8 mb/d in 2019) continued to grow at 160 kb/d. The net effect was a flat oil consumption for 3 years.

Fig 4: Asia Pacific consumption by fuel
We see how important Diesel is. Fuel oil use is much lower than before the 2nd oil crisis in 1979. Naphta and other fuels are mainly used in the chemical industry.
Asian oil consumption growth is dominated by China and India.

Fig 5: Peak oil in China

Fig 6: China fuel consumption by type
While recent consumption curves in the above graphs look quite smooth, annual changes reveal a more complex picture with varying growth and even decline rates over time and in different countries.

Fig 7: Asian oil consumption growth and decline (gross)
In the last 5 years gross growth came down from 1.6 mb/d to 950 kb/d, dominated by China and India.
China’s oil consumption grew by a whopping 1.1 mb/d in 2010 as a result of a 2009/10 stimulus package amounting to almost 6% of GDP (estimated at RMB 2 Tr). https://treasury.gov.au/publication/chinese-macroeconomic-management-through-the-crisis-and-beyond/2011-01-chinese-macroeconomic-management-through-the-crisis-and-beyond/4-chinas-stimulus-package
…click on the above link to read the rest of the article…
How Saudi Arabia Caused The Worst Oil Price Crash In History
How Saudi Arabia Caused The Worst Oil Price Crash In History
- Saudi Arabia made good on its promise to flood the market with oil after the collapse of the previous OPEC+ deal in early March.
- The Kingdom’s oil exports jumped by 3.15 million bpd to 11.34 million bpd in April.
Saudi Arabia made good on its promise to flood the market with oil after the collapse of the previous OPEC+ deal in early March, exporting a record 10.237 million barrels per day (bpd) in April 2020, up from 7.391 million bpd in March, data from the Joint Organisations Data Initiative (JODI) showed.
Total oil exports from Saudi Arabia, including crude oil and total oil products, also soared in April – by 3.15 million bpd to 11.34 million bpd, mostly due to the surge in crude oil exports, according to the data released by the JODI database, which collects self-reported figures from 114 countries.
Production at the world’s top crude oil exporter also jumped in April—to over 12 million bpd, at 12.007 million bpd, the database showed.
After flooding the market with oil in April and contributing to the oil price crash, OPEC’s de facto leader and largest producer, Saudi Arabia, agreed that same month to a new round of OPEC+ cuts in response to the demand crash and plunging oil prices. Saudi Arabia had to reduce its oil production to 8.5 million bpd in May and June under the OPEC+ deal for removing 9.7 million bpd of collective oil production from the market.
According to OPEC’s secondary sources in the latest Monthly Oil Market Report (MOMR), Saudi Arabia slashed its crude oil production in May to the required level of 8.5 million bpd.
…click on the above link to read the rest of the article…
Oil Market Heading For Months Of Deficit
Oil Market Heading For Months Of Deficit
The oil market is set for a deficit from August onwards, even after OPEC+ eases the current cuts that are up for a tentative extension through July, Rystad Energy analysts said on Friday.
Assuming that global demand recovery continues in the coming months, the oil market will still be in deficit even after the OPEC+ group relaxes the current cuts from 9.7 million bpd to 7.7 million bpd, as currently planned, Rystad Energy’s Head of Oil Markets, Bjornar Tonhaugen, said, as carried by Oilfield Technology.
“That will ensure a fundamental support for prices, while also spurring a quicker reactivation of curtailed US oil production, and eventually frac crews ending their holidays early,” Tonhaugen said in a note.
“Indications show that a bit more than 300 000 bpd from shut US production is actually coming back online already from June as a result of the current price levels,” he said.
Some U.S. producers have already restarted some curtailed production as prices have rallied in recent weeks and as they need the cash from operations, regardless of how little.
The market deficit coming this summer, however, doesn’t mean that there will be a global oil supply crunch, because inventories and floating storage have yet to begin depleting.
“So, even if demand exceeds supply for a while, that does not mean that we really have a problem to source oil. Oil is there, lots of it, waiting to be drawn from storage facilities,” Rystad Energy’s Tonhaugen said.
Improving global oil demand and faster-than-expected production curtailments from outside the OPEC+ pact are set to push the oil market into deficit in June, according to Goldman Sachs. Yet, there is little room for an oil price rally in the near term because of the still sizeable oversupply of crude oil and refined products, Goldman Sachs said in a note in the middle of May.
Earlier this week, Russia’s Energy Minister Alexander Novak said he expected a shortage in the oil market in July.
Is EIA Data Disguising A Disastrous Decline In U.S. Shale?
Is EIA Data Disguising A Disastrous Decline In U.S. Shale?
The Trump administration claims that the U.S. is “transitioning to greatness,” and that energy companies are going to see “massive gains.” U.S. Secretary of Energy Dan Brouillette says there is “stability” in the oil market, and that economic activity will “explode” on the other side of the pandemic.
Dan Brouillette✔@SecBrouillette
Thanks to the leadership of President @realDonaldTrump, the transition to greatness is well underway, and our economy along with our U.S. energy companies are going to see massive gains on the other side of this pandemic.

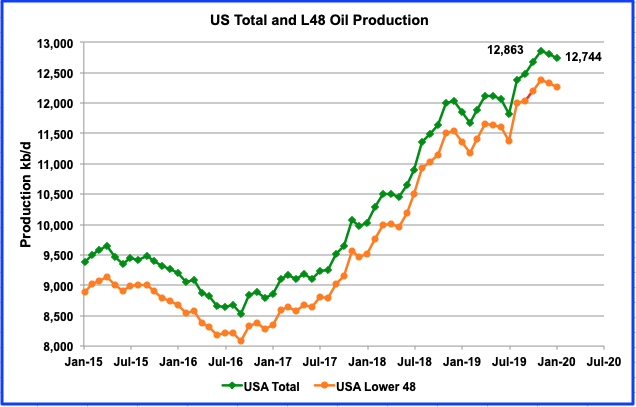
Meanwhile, back in reality, U.S. oil production continues to decline as drillers shut in wells and cut back spending. Output has already declined by 1.1 million barrels per day (mb/d), and more losses are likely. New data from Rystad Energy predicts U.S. oil production declines of roughly 2 mb/d by the end of June.
“Actual production cuts are probably larger and occur not only as a result of shut-ins, but also due to a natural decline from existing wells when new wells and drilling decline,” Rystad said in a statement.
Energy expert Philip Verleger, in an article for Energy Intelligence reports that the magnitude of output declines is much larger. His latest research shows that production as of May 10 is down by almost 4 million bpd from its peak as the below chart shows.

Source: PK Verleger LLC
To be sure, the U.S. government is doing quite a bit to try to bailout the oil industry. A new report finds that some 90 oil and gas companies will benefit from the Federal Reserve’s corporate bond buying program. The Trump administration is also quietly reversing environmental protections on the oil and gas industry.
…click on the above link to read the rest of the article…
Has Demand For Oil Already Peaked?
Has Demand For Oil Already Peaked?
Oil prices continue to rise on the prospect of a rebound in fuel demand as economies begin to reopen. But there is a large difference between oil demand rising from recent lows and actually growing relative to pre-COVID-19 trends. In other words, demand destruction on the order of nearly 30 million barrels per day (mb/d) may have been brief, but we are a long way from a 100-mb/d oil market.
In fact, some are wondering whether the world will ever get back to 100 mb/d of oil demand. Even oil executives have their doubts. Royal Dutch Shell’s CEO Ben van Beurden recently suggested that a rebound is unlikely, even looking out beyond 2020. “We do not expect a recovery of oil prices or demand for our products in the medium term,” he said.
“We basically have a crisis of uncertainty. Uncertainty about demand, about prices,” van Beurden said in a video address when presenting first quarter results at the end of April. “Maybe even uncertainty about the viability of some of our assets given all of the logistical issues we have.”
BP’s CEO Bernard Looney largely admitted the same thing. The COVID-19 pandemic could entrench certain societal changes – more teleworking, less commuting, less flying – that could permanently erode a portion of consumption. “It’s not going to make oil more in demand. It’s gotten more likely [oil will] be less in demand,” Looney said in an interview with the FT.
“I don’t think we know how this is going to play out. I certainly don’t know,” Looney said. “Could it be peak oil? Possibly. Possibly. I would not write that off.”
Not everyone agrees. ExxonMobil’s chief executive Darren Woods recently said that the long-term trends “have not changed.”
…click on the above link to read the rest of the article…
Oil Price Crash Was Inevitable
Oil Price Crash Was Inevitable
The oil price crash was inevitable.
To understand why we have to review a bit of history.
In 2013, I began warning of the risk to oil prices due to the ongoing imbalances between global supply and demand. Those warnings fell on deaf ears.
Nobody wanted to pay much attention to the fundamentals at a time when near-zero interest rates were pushing banks, hedge funds, and private equity firms, to chase the “yield” in the energy space. Naturally, with money flooding into the system, companies were forced to drill economically unproductive wells to meet investor demands, which drove supplies higher.
Disclaimer
This week’s #MacroView is a broader commentary on the more general issues of the oil market. However, given this backdrop of what oil prices will likely remain suppressed far longer than most currently imagine, some opportunities exist in the energy space.
We recently added positions in Exxon (XOM), Chevron (CVX), and the SPDR Energy ETF (XLE) to our portfolios. We believed the companies offered significant value before the crisis, and offer even more due to the sell-off in oil.
Based on our discounted cash flow model for XOM and CVX, we think both companies are 25% undervalued. The model assumes very conservative earnings projections for the next three years and a low EPS growth rate after that. In addition to trading at a steep discount, we think their strong balance sheets put these companies in a prime position to purchase sharply discounted energy assets in the months ahead.
These stocks, and the sector, will be volatile for a while, but we intend to add to these positions in the future and potentially hold them for a long time.
Now, for the rest of the story.
…click on the above link to read the rest of the article…
WTI Crashes To 19 Year Low As Trading Reopens; S&P Futures Slide
WTI Crashes To 19 Year Low As Trading Reopens; S&P Futures Slide
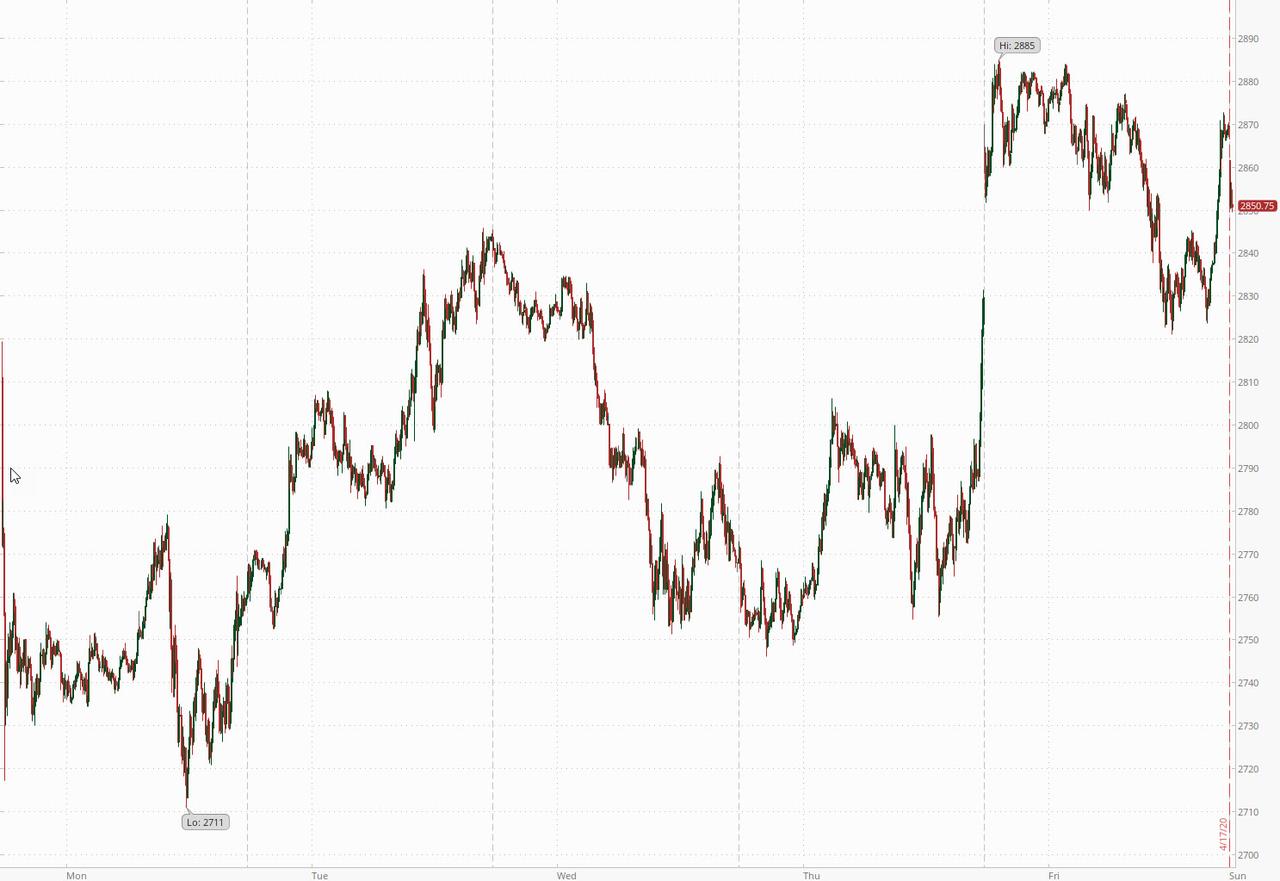
After a relatively drama-free weekend, futures have started off the new week lower by about 0.4%, trading at 2850, down 20 points from Friday’s CTA inspired and momentum-driven meltup which appears to be reversing as algos realize they have frontrun a rebound in not just 2021 earnings but also 2022 and 2023.
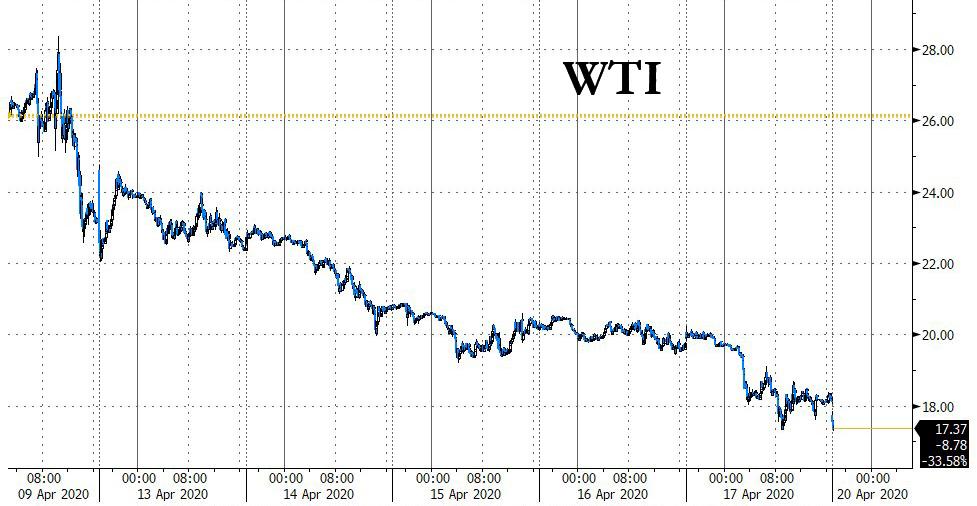
However, just like last week, it is commodities and specifically oil where the deflationary puke is taking place, with WTI tumbling over 5% at the open, and sliding to $17.30, down more than $10 from last Monday’s post OPEC+ kneejerk reaction higher and the lowest price since November 2001,
The ongoing crash in oil which OPEC+’s agreement to cut 9.7mmb/d in output last weekend has failed to halt, takes place as Crude prices in the US oil capital are getting dangerously close to zero. According to Bloomberg buyers bidding for crude in landlocked sections of Texas, ground zero of the shale revolution, are offering as little as $2 a barrel for some oil streams, a precipitous markdown from a month ago. And, as discussed here on various occasions, the plunging value of physical barrels is raising the possibility that Texas producers may soon have to pay customers to take crude off their hands.
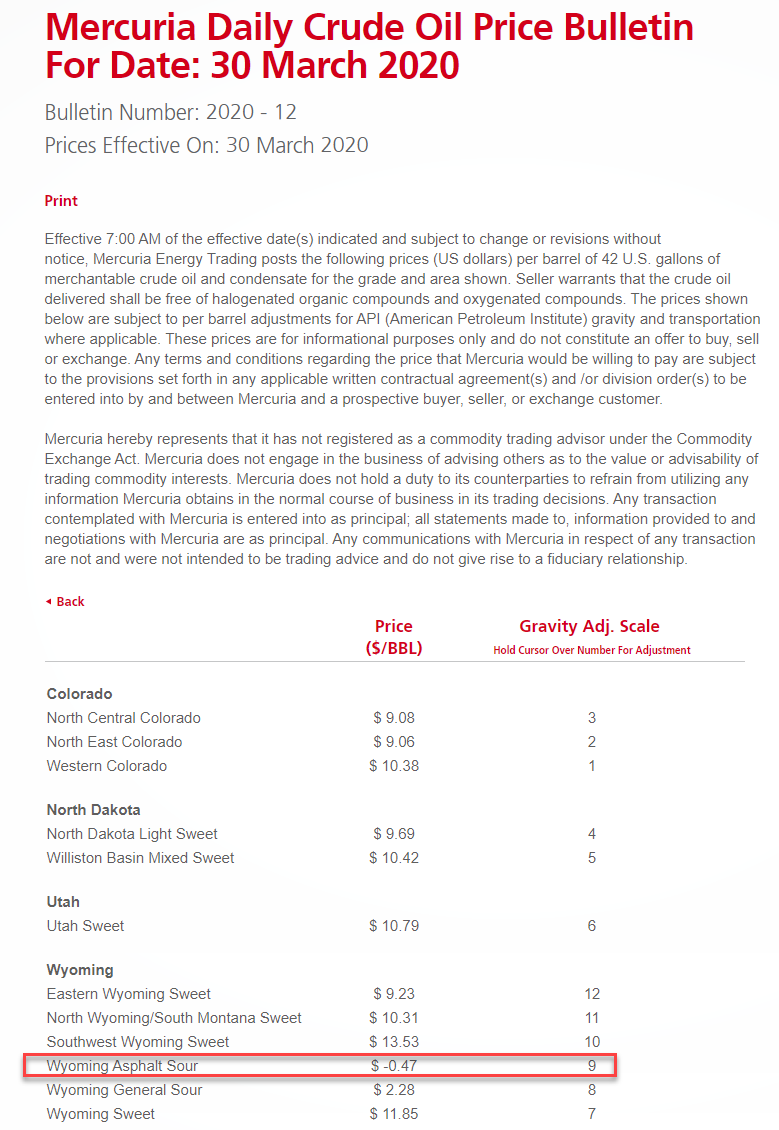
Negative prices already hit more obscure corners of the North American oil market amid a bearish trifecta of collapsing demand, swelling supplies and limited storage capacity. AS we reported at the end of March, the first U.S. grade to bid under zero was a small landlocked crude stream known as Wyoming Asphalt Sour, which went for negative 19 cents a barrel last month.
Meanwhile, in Texas prices are heading in that direction. A subsidiary of Plains All American Pipeline bid just $2 a barrel for South Texas Sour on Friday, while Enterprise Products Partners LP offered $4.12 for Upper Texas Gulf Coast crude this week, according to Bloomberg.
For Oil and Its Dependents, It’s Code Blue
For Oil and Its Dependents, It’s Code Blue
The great price collapse of 2020 will topple companies and transform states.
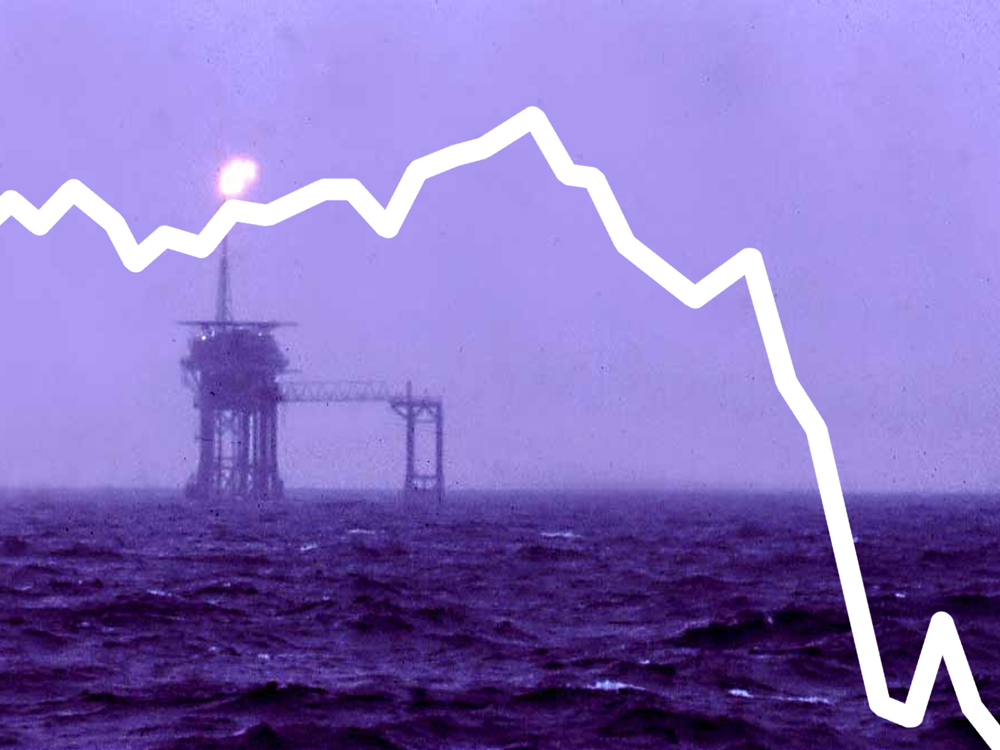
If oil has been laid low by the coronavirus, then the nations whose economies most depend on it might soon be on ventilators. By any prognosis the great oil price collapse of 2020 has pushed the world’s most volatile commodity into Code Blue.
No one expects oil, its peddlers or consumers to emerge wealthier or wiser from this crisis. Oil company bankruptcies, already happening before the pandemic, will escalate. And more petro states will begin to stumble, like Venezuela, down the rabbit hole of collapse.
The pandemic, combined with suicidal overproduction and a brief price war between Russia and Saudi Arabia, has reduced oil consumption and revenues on a scale that is mindboggling.
Prior to the pandemic, the world gulped about 100 million barrels a day, filling the atmosphere with destabilizing carbon. Today it sips somewhere between 65 million and 80 million barrels.
At least 20 to 30 per cent of global demand has vanished and nearly two dozen petro-producing countries including Canada have agreed to withhold nearly 10 million barrels from the market. Few expect this agreement will stop the price bleeding.
In fact, the price of Western Canadian Select or diluted bitumen remains below five dollars a barrel — cheaper than hand sanitizer. That’s a drop of more than 80 per cent compared to the month before.
Because the spending of oil fertilizes economic growth and expands national GDPs, most of the world’s economists now predict a long depression after the pandemic.
…click on the above link to read the rest of the article…
Canadian Oil Sands Per Barrel At $4.47, Now Cheaper Than 12-Pack Coke, $5.08
Canadian Oil Sands Per Barrel At $4.47, Now Cheaper Than 12-Pack Coke, $5.08
The collapse of global oil demand has impacted the price of Canadian Oil Sands to such a degree, the price of a barrel is now cheaper than a 12-pack of Coke purchased at Walmart. According to oilprice.com, the current price of a barrel of Western Canadian Select (oil sands) is $4.47 versus a 12-pack of Coke at Walmart for $5.08.

What a deal… ah? Now, let’s do a simple comparison of the ENERGY CONTENT in a barrel of Canadian Oil Sands vs. a 12-pack of Coke. A barrel of oil equivalent contains 1.4 billion calories of energy. A typical 12 oz Coke can contains 140 calories. If we multiply it by 12, we have 1,680 calories in a 12-pack of Coke.
Doing some simple math:
Barrel Of Oil Equivalent (1,400,000,000 calories) / 12-Pack Coke (1,680 calories) = 833,333.
Thus, a barrel of Canadian Oil Sands, which contains 833,333 times the energy calories than a 12-pack of Coke, is now worth $4.47 compared to $5.08 for the 12-pack of Coke. Again… what a deal, ah??
I just wanted to post this simple comparison to show how much the Global Oil Industry is being gutted. If OPEC, Russia, and the United States do not come up with “MEANINGFUL CUTS,” then we could see Western Canadian Select trading for $1 a barrel or less.
As for RESTARTING the U.S. and Global Economy after an extended shutdown, I have my doubts, as so does Gail Tverberg at her blog, OurFiniteWorld.com. Check out her most recent article; Economies won’t be able to recover after shutdowns.
COMING NEW VIDEO: I am finishing putting together the charts for my next video on why the GOLD & SILVER PRICES will explode due to the collapse of the Global Financial Ponzi Scheme.
WTI Extends Losses Below $20 After Record Surge In Crude Inventories
WTI Extends Losses Below $20 After Record Surge In Crude Inventories
WTI crashed below $20 (tagging $19.20) overnight after API reported huge inventory builds and was not helped by comments from the International Energy Agency that a historic production cut deal won’t be enough to counter a record demand slump this year.
This appears to confirm a key gauge of the oil market’s health which is at its weakest in more than a decade as supplies build and futures contracts roll over. West Texas Intermediate crude for May delivery traded at more than $7 a barrel below its June contract on Tuesday, the deepest contango since 2009. The May contract is nearing expiration and exchange-traded funds, including the United States Oil Fund, have been selling front-month contracts and buying second-month futures.
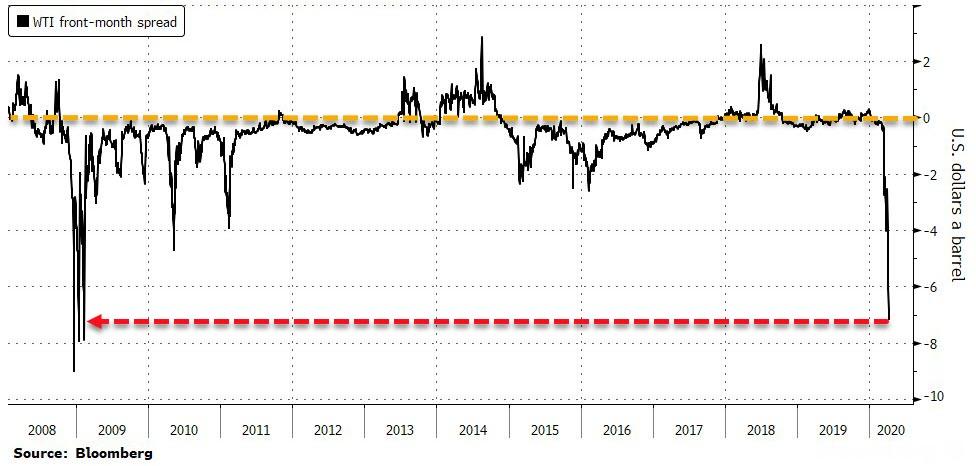
Simply put, this is an indication of extreme oversupply.
“At least over the next month or so, before these cuts have an opportunity to kick in, we are going to be very stressed on inventories,” Bart Melek, head of commodity strategy at TD Securities, said by telephone.
And so all eyes are once again on the inventories for any positive signs…
API
- Crude +13.143mm (+10.1mm exp)
- Cushing +5.361mm
- Gasoline +2.226mm (+7.1mm exp)
- Distillates +5.64mm (+1.8mm exp)
DOE
FIRST STAGE OF OIL DEMAND DESTRUCTION: U.S. Supply Of Petroleum Products Down 7 Million Barrels Per day
FIRST STAGE OF OIL DEMAND DESTRUCTION: U.S. Supply Of Petroleum Products Down 7 Million Barrels Per day
The U.S. is only in the FIRST STAGE of the country’s oil demand destruction. Since the nationwide shutdown announced by the U.S. Government in mid-March, domestic oil demand has fallen more than 7 million barrels per day. In just the past three weeks, the total U.S. petroleum products supplied to the market fell by 33%.
However, I don’t believe we have seen the low yet in U.S. total oil demand. According to the EIA – U.S. Energy Information Agency, total petroleum products supplied to the market on April 3rd were 14.4 million barrels per day (mbd) compared to 21.5 mbd for March 13th.

FIRST STAGE: Oil Demand Destruction To Peak Within 3-4 weeks
Over the next 3-4 weeks, I see the total U.S. petroleum products supplied to the market falling to the 12 mbd level (or even lower). With 96% of U.S. airline passenger traffic now lost and a 65-75% reduction of domestic vehicle traffic, the data released for April 3rd still haven’t factored in all the demand destruction.
For example, U.S. gasoline supplied to the market is down 48% while Jet fuel is off 56%. When U.S. gasoline supplies fall by 60-75% and Jet fuel down by 80%, then we will likely reach a bottom. However, this doesn’t include other petroleum products such as Propane/Propylene (1.1 mbd) and other oils (3.7 mbd):

As we can see, gasoline supplies fell the most in volume, followed by jet fuel. If we just focus on U.S. gasoline, diesel, and jet fuel, the total products supplied fell 5.8 mbd, or 38%. Diesel supplies are holding up rather well due to the critical transportation via semi-tractors, rail, and ship… all which use diesel fuels.
…click on the above link to read the rest of the article…
Singapore Oil Trading Giant On Verge Of Collapse After Banks Freeze Credit Lines
Singapore Oil Trading Giant On Verge Of Collapse After Banks Freeze Credit Lines
Back in the second half of 2015, shortly after Saudi Arabia unleashed the (first) OPEC disintegration by flooding the market with oil in hopes of killing US shale (so deja vu… only back then it took it about two years for it to realize its low production costs are no match for the US junk bond market) and when China’s economy briefly collapsed forcing Beijing to devalue its currency and trigger a violent plunge in commodity prices around the globe (so deja vu… only back then the Shanghai Accord of Jan 2016 restored order to the world), traders were looking for ways to short the chaos and one of the favorite trades was to bet on the collapse of commodity merchants such as Glencore, Vitol, Trafigura and Mercuria, whose fates were closely interwoven with the prices of the commodities they traded. As a result, Glencore’s stock price plunged and its CDS soared amid fears the commodity crash cascade would lead to a default wave among anyone with commodity exposure.
Fast forward 5 years when the biggest commodity crash in generations, one which has sent the price of oil tumbling to levels not seen since George H.W. Bush was invading Middle Eastern nations, and… nothing: while the Glencores of the world have indeed dropped, their valuations are nowhere near the late 2015 lows even as the prices of several key commodities have rarely been lower.
That might be changing, however, because the longer global economic activity fails to rebound and the longer commodity prices remain at their current depressed levels, the more the global liquidity crisis will transform into a solvency crisis, hitting some of the most prominent commodity traders in the world… such as Singapore’s iconic oil trader Hin Leong Trading, which according to Bloomberg has appointed advisers to help in talks with banks as some of them freeze credit lines to the firm.
…click on the above link to read the rest of the article…
Oil Turns Negative After Russia, Saudis Agree To Cap Output At 8.5MM B/D For 2 Months
Oil Turns Negative After Russia, Saudis Agree To Cap Output At 8.5MM B/D For 2 Months
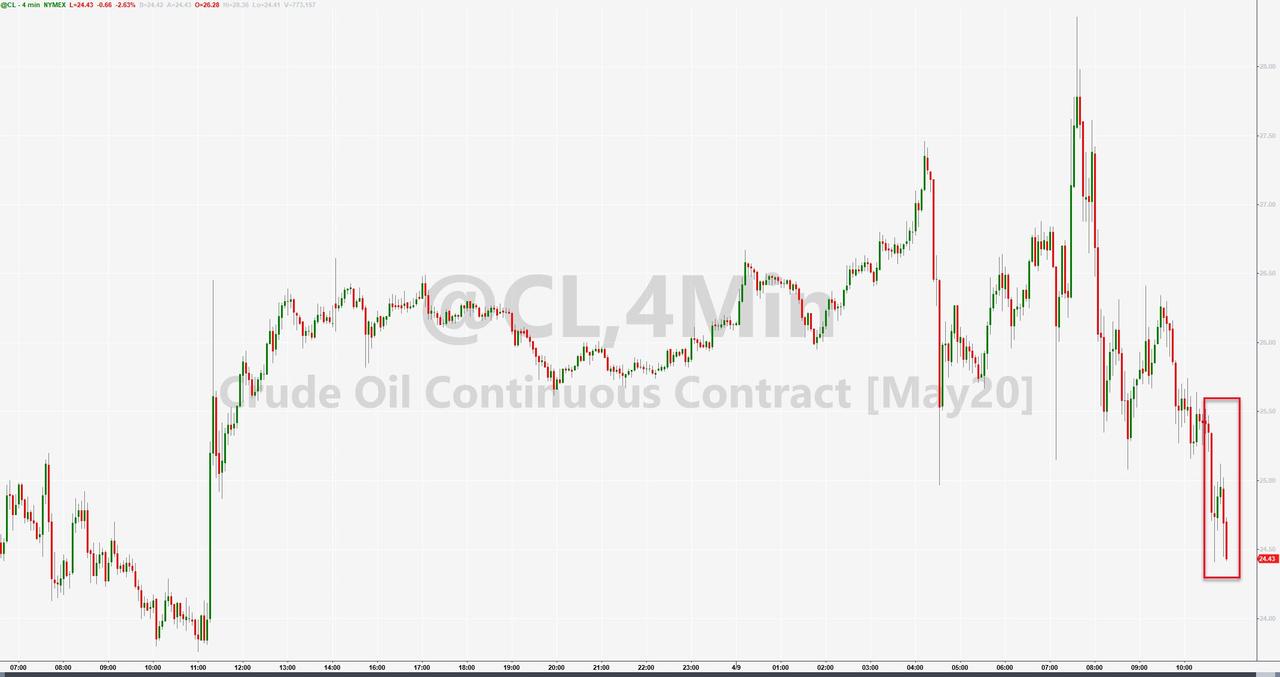
Update (1350ET): What started off euphorically, has quickly become R-OPEC’s latest dud, with oil now sliding red on the day after earlier surging more than 10%, following the latest news out of the oil producerteleconference, according to which Russia and Saudi Arabia agree to cap production to 8.5MM b/d, indicating a production cut of about 23% each, and which will last for just two months, May and June.
Furthermore, as Iran’s oil minister explains, the total cut of 10MMb/d (which will include several non Russia/Saudi producers) will ease to 8MMb/d in July and then after Jan 2021, the cut will decline to just 6 million b/d production cut.
In a nutshell, R-OPEC is hoping for two things: i) oil demand will rebound after the summer and the oil market will stabilize organically as the global economy recovers from the coronavirus and ii) the US and other G20/non-OPEC producers join the cuts voluntarily, which however is far from assured.
Meanwhile, even with the 10mm b/d cut (which is really about 7 millions if one uses Saudi Arabia’s Feb production numbers) will be nowhere near enough to offset the global demand plunge which according to industry watchers such as Trafigura is as large as 35mmb/d!
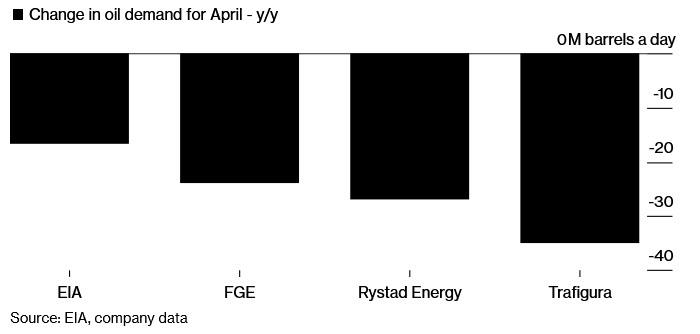
And now that the initial euphoria has worn off and traders are able to do math again – and realize that the cuts are not nearly enough – oil has slumped and was trading in the red last as once again, OPEC has failed to live up to the hype.
Finally, as a reminder, here is why Goldman believes that after today’s pomp and circumstance, oil is still going to $20:
…click on the above link to read the rest of the article…
Unprecedented Demand Destruction Marks The Return Of The Super Contango
Unprecedented Demand Destruction Marks The Return Of The Super Contango

These days, every corner of the oil market is “unprecedented”—from the demand destruction to the supply surge and the resulting glut. The oil futures curve is no exception and is also in a state never seen before. This is the super contango, the market situation in which front-month prices are much lower than prices in future months, pointing to a crude oil oversupply and making storing oil for future sales profitable.
The last time a super contango appeared on the market was during the previous glut of 2015. During the peak of the 2008-2009 financial crisis, the super contango hit a record—the discount at which front-month futures traded compared to longer-dated futures was at its highest ever.
The double supply-demand shock of the past month threw the oil futures market into another super contango. And this super contango is already beating previous records.
The super contango is representative of the state of the oil market right now: the growing glut with shrinking storage capacity as oil demand craters, OPEC’s leader and the world’s top exporter, Saudi Arabia, intent on further cratering the market with a supply surge beginning this month. Storage costs are surging, and so are costs for chartering tankers to store oil at sea for future sales when traders expect demand to recover from the pandemic-hit plunge.
The market structure flipped into contango in early February, when the Chinese oil demand slump in the coronavirus outbreak led to lower estimates for oil consumption. A month and a half later, oil consumption is set to plunge by 20 million bpd, or 20 percent, this month. Add to this the Saudi supply surge, and here we have what analysts expect to be the largest glut the oil market has ever seen.
…click on the above link to read the rest of the article…


