Home » Posts tagged 'gdp' (Page 3)
Tag Archives: gdp
GDP & Consumer Confidence in Crash Mode
GDP & Consumer Confidence in Crash Mode
The impact of Coronavirus is far worse than most can imagine. GDP dropped 32% during the 2nd-quarter which is a new historical record surpassing every recession and the Great Depression of both the 19th and 20th centuries. The epidemiologists cannot be this stupid. The people who have died because of a lack of healthcare during this trumped-up pandemic is serious. Many have been denied healthcare and others have been afraid to even go to the hospital. I myself went to the ER and ended up in a COVID wing for two days and it took two negative tests to get out. Everything has become COVID. In Florida, a young man killed in a motorcycle accident ended up on the death list of COVID. The numbers are being manipulated and the fraud is massive.
As wave two appears with the next flu season, the media has beaten this into such an insane pandemic you would think it was the Black Plague with a 50% mortality rate. The last half of 2020 will get worse. They are using this for political objectives. Any doctor who stands up against this manipulation is attacked and then they roll out a fake study to claim they are wrong. When I was called in as an “expert” to be exploited to create the G5 back in 1985, I saw this was all a joke and so I wrote to President Regan. I was told that I would never be called again because I went out of the committee. I was told to be a good boy, produce studies they tell you the conclusion, and I would make a few million a year. Studies are worthless! Try to find a real one is next to impossible. They all have been paid for to achieve a political objective.
…click on the above link to read the rest of the article…
Green economic growth is an article of ‘faith’ devoid of scientific evidence
Green economic growth is an article of ‘faith’ devoid of scientific evidence
Crack team that advised UN Global Sustainable Development Report settle a longstanding debate with hard empirical data

For years, financial institutions and governments have been focused on the idea of ‘decoupling’ GDP growth from resource use. This has been driven by the recognition that to stay within the ‘safe limit’ of 2 degrees Celsius, we have to dramatically reduce our material consumption.
The goal is to keep our economies growing to sustain prosperity while reducing our actual resource use and material footprint. The bottom line is that without reducing our overall use of planetary resources, we are bound to cross the line into a dangerous climate. But is doing so consistent with the continued increase in economic growth?
The conventional belief has been most recently articulated in a recent book, More From Less, by Andrew McAfee, principal research scientist the MIT Sloan School of Management. Financial and other data, McAfee argued, shows we can actually easily reduce our material footprint while continuing to grow our economies in a win-win scenario.
But new scientific analysis by a group of systems scientists and economists proves that this contention is completely groundless. Far from being based on hard evidence, this sort of claim is instead derived from egregious selective readings of statistical data.
Decades of research on material flows confirm that there are “no realistic scenarios” for such decoupling going forward.
Combing through 179 of the best studies of this issue from 1990 to 2019 further reveals “no evidence” that any meaningful decoupling has ever taken place.
…click on the above link to read the rest of the article…
Fourth Turning Accelerating Towards Climax
FOURTH TURNING ACCELERATING TOWARDS CLIMAX
“At some point, America’s short-term Crisis psychology will catch up to the long-term post-Unraveling fundamentals. This might result in a Great Devaluation, a severe drop in the market price of most financial and real assets. This devaluation could be a short but horrific panic, a free-falling price in a market with no buyers. Or it could be a series of downward ratchets linked to political events that sequentially knock the supports out from under the residual popular trust in the system. As assets devalue, trust will further disintegrate, which will cause assets to devalue further, and so on. Every slide in asset prices, employment, and production will give every generation cause to grow more alarmed.” – Strauss & Howe – The Fourth Turning

I’ve been writing articles about the Fourth Turning for over a decade and nothing has happened since its tumultuous onset in 2008, with the global financial collapse, created by the Federal Reserve and their Wall Street co-conspirator owners, that has not followed along the path described by Strauss and Howe in their 1997 book – The Fourth Turning.
Like molten lava bursting forth from a long dormant (80 years) volcano, the core elements of this Fourth Turning continue to flow along channels of distress, long ago built by bad decisions, corrupt politicians and the greed of bankers. The molten ingredients of this Crisis have been the central drivers since 2008 and this second major eruption is flowing along the same route. The core elements are debt, civic decay, and global disorder, just as Strauss & Howe anticipated over two decades ago.
…click on the above link to read the rest of the article…
GDP Now Q2 Estimate At -34.90 Percent, So What Now?
GDP Now Q2 Estimate At -34.90 Percent, So What Now?
Summary
- The Atlanta Fed’s GDP Now is estimating a -34.9 percent Q2 GDP print, which is 3.5x the largest quarterly decline in the post-WWII economy
- If realized, the 11.3 percent non annualized first-half GDP collapse in 2020 will approach the worse year of the Great Depression, when in 1932, the economy shrank 13.1 percent for the entire year
- We are not paying much attention to these numbers as they reflect an economy that has been closed for two months, which should experience a relatively sharp snapback in Q3, with unemployment most likely peaking this month
- Nonetheless, the pandemic and economic lockdown will do long-term structural damage to the economy
- The rapid growth of the monetary aggregates alleviates much of the deflationary forces in the economy in the short-term and we perceive inflation a much bigger risk over the medium-term
- If the GDP Now estimate holds, and even if GDP prints a record annualized 27.6 percent number in Q3, real output will still be 7 percent below the Q4 2019 level with unemployment remaining close to low double digits
- We suspect the recovery will come too late and not be enough to save President Trump and the Republicans though the White House will tout it as “the greatest economic recovery in the history of the world“
- Investors and companies should plan for higher capital gains and corporate taxes
- Check out the astonishing performance of our stock picker’s large-cap portfolio, which is trouncing the S&P500 this year
Since the COVID crisis hit America, many businesses are operating at limited capacity while others have ceased operations completely. The unprecedented aggregate supply and demand shock to the U.S. economy has resulted in horrific economic data, including the 20.5 in nonfarm payroll jobs lost in April and the unemployment rates shooting up over 14 percent.
…click on the above link to read the rest of the article…
They’re All High on Fed Fairy Dust
They’re All High on Fed Fairy Dust

Everybody realizes the US economy is in a bad spot. But most people still seem to believe it will bounce right back once we deal with the coronavirus.
They’re all high on Federal Reserve fairy dust.
US GDP contracted by 4.8% in the first quarter. It was the first negative GDP reading since a 1.1% decline in the first quarter of 2014 and it was the lowest level since the 8.4% plunge in Q4 of 2008.
And the worst is yet to come.
The Q1 GDP number only captures the first couple of weeks of coronavirus-inspired government lockdowns of the economy. In fact, in January Donald Trump and others were telling us that it was the best economy in the history of the world. That was also in the first quarter.
The first-quarter GDP print came in even worse than expected. Economists were projecting a contraction of 3.5 to 4%. The precipitous and rapid plunge in economic activity not only reflects the impacts of turning off the economy in the midst of coronavirus; it also reveals just how fragile the economy was before the pandemic.
Back in January, President Trump called it the greatest economy in history. Trump continued to talk up the economy during the State of the Union address, taking credit for the “strong” economic growth. At the time, Peter Schiff said nobody should be taking credit for the condition of the US economy. In fact, economic growth wasn’t much different than it was when Obama was president.
The only difference is we had to borrow even more money to achieve the same level of fake GDP growth that we did under Obama. The reality is nobody should be taking credit for the current US economy. The question is who deserves the blame?”
…click on the above link to read the rest of the article…
The Recent History of GDP Growth, CO2 Emissions, and Climate Policy Paralysis, All in One Table-Runner
The Recent History of GDP Growth, CO2 Emissions, and Climate Policy Paralysis, All in One Table-Runner

Note: I began designing this table-runner just before the COVID-19 pandemic blew up in the United States. In the time I have been embroidering it, rates of death and misery have soared while wealth generation and carbon emissions (the two subjects of this work) have ended their decades-long rise and have plummeted. A deadly virus is a terrible means of slowing greenhouse warming. Whenever we come out the other side of the pandemic, we must pursue a rapid, humane, ecologically sound, and guaranteed-effective course of action to drive greenhouse emissions down to zero. Here’s how. — P.G.C.

The color of money is the color of calamity
This table-runner illustrates, from left to right, the increase in atmospheric carbon dioxide concentration from 1946 to the present. Each year is represented by two adjacent stripes: one in gradually deepening shades of green representing that year’s U.S. gross domestic product (adjusted for inflation) and one in increasingly intense shades of yellow-orange-red, representing CO2 concentration.
There are nine shades for GDP and eleven for CO2, with shades indicating roughly equal intervals of increase in each. The shades of both types of stripes darken as the years go by, in accordance with the increases that occurred in both GDP and CO2. (For hi-res, zoomed-in images of the table-runner, see here.)
The shades of yellow-orange-red in the table-runner darken more and more rapidly as the years pass, illustrating how emissions of CO2 accelerated as industrial output and fossil-fuel use rose more rapidly throughout the world. The concentration of CO2 rose at an annual rate of about 0.8 ppm from 1945 to 1980; 1.5 ppm from 1980 to 1995; and 2.1 ppm from 1995 to 2019. (The United States accounted for almost 20 percent of the rise in atmospheric CO2 during those years.)
…click on the above link to read the rest of the article…
Recession Begins: Q1 GDP Plunges 4.8%, Biggest Drop Since The Financial Crisis
Recession Begins: Q1 GDP Plunges 4.8%, Biggest Drop Since The Financial Crisis
With news that the Gilead Remdesivir trial had reportedly met its primary endpoint hitting “coincidentally” just seconds before the Q1 GDP print, and with newswires initially reporting the GDP erroneously as a positive 4.8% print, it was clear that the real number would be a disaster, and sure enough moments later newswires reversed and reported that Q1 GDP was in fact, a worse than expected negative 4.8%, the biggest drop since March of 2009, and officially marking the start of the US recession.
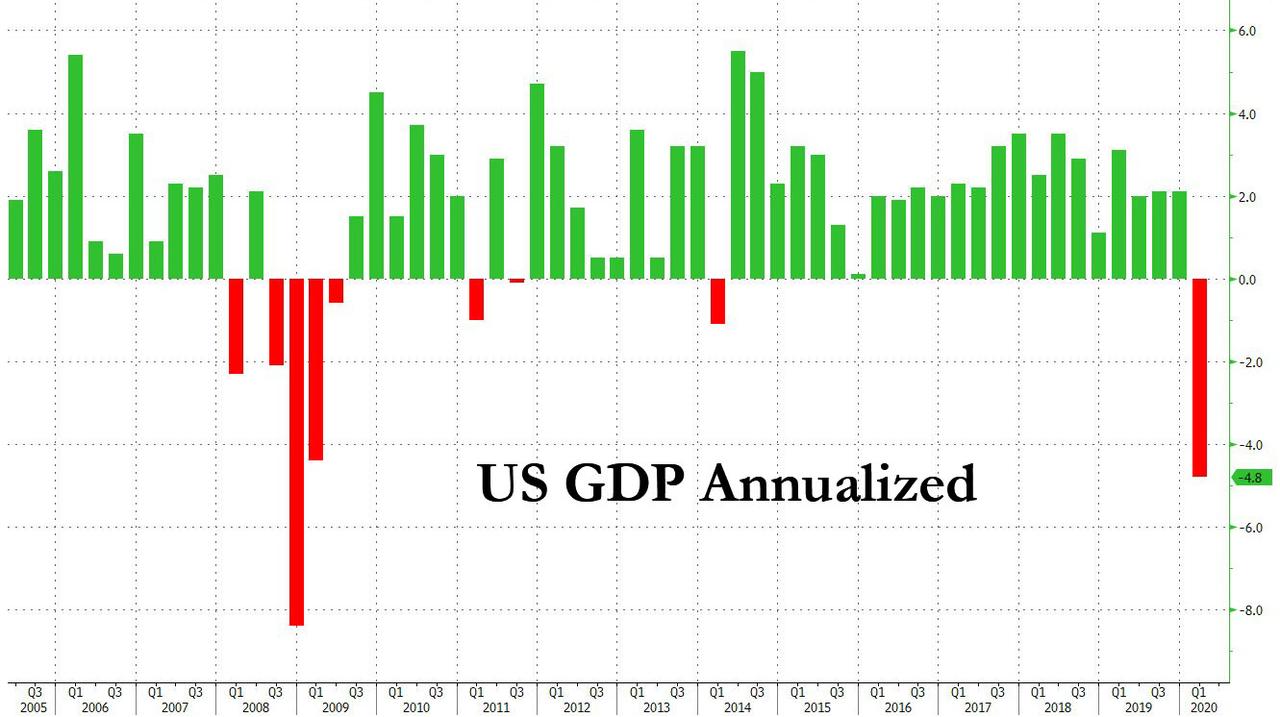
Perhaps in response to demands from the White House, the BEA was quick to note that “the decline in first quarter GDP was, in part, due to the response to the spread of COVID-19, as governments issued “stay-at-home” orders in March. This led to rapid changes in demand, as businesses and schools switched to remote work or canceled operations, and consumers canceled, restricted, or redirected their spending. The full economic effects of the COVID-19 pandemic cannot be quantified in the GDP estimate for the first quarter of 2020 because the impacts are generally embedded in source data and cannot be separately identified.”
Developing
“The Biggest Decline Ever”: Goldman Now Sees US GDP Crashing 34% In Q2
“The Biggest Decline Ever”: Goldman Now Sees US GDP Crashing 34% In Q2
Just over a week ago, when we reported on the ongoing feud between Goldman and JPM to come up with the most terrifying GDP forecast for the US, and when we asked if a Second Great Depression has begun after Goldman’s chief economist Jan Hatzius slashed his Q2 GDP forecast from -5% to -24%, we said “we expect Goldman to take the machete to this analysis as well in the coming days, because if the US economy is indeed paralyzed for at least one quarter, then all of GDP could be lost.”
We were right, because early on Monday morning Goldman’s Haztius did just that, and in a report titled “The Sudden Stop: A Deeper Trough, A Bigger Rebound”, he writes that he is “making further significant adjustments to our GDP and employment estimates. We now forecast real GDP growth of -9% in Q1 and -34% in Q2 in qoq annualized terms (vs. -6% and -24% previously) and see the unemployment rate rising to 15% by midyear (vs. 9% previously).”
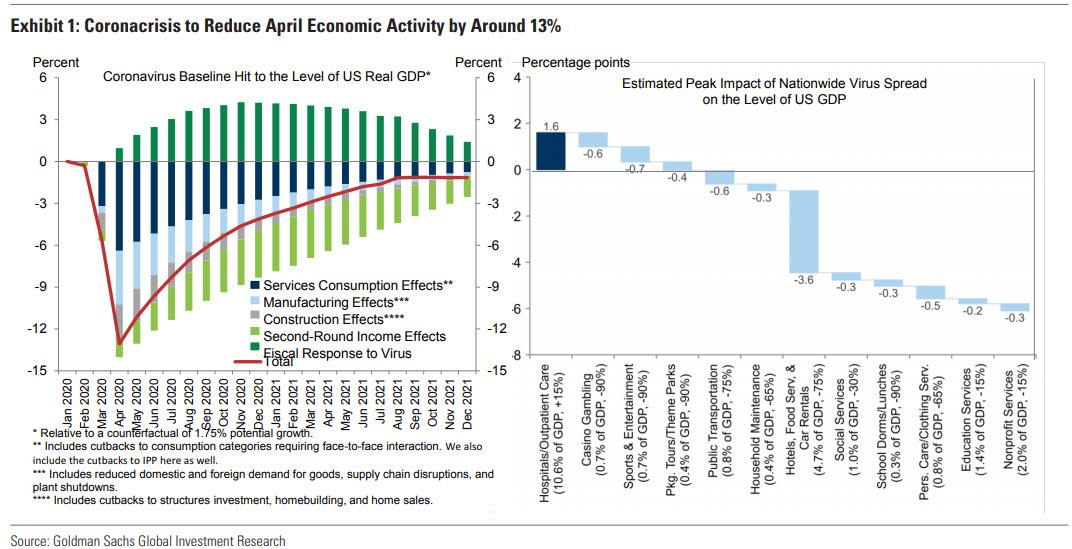
Detailing the assumptions behind his latest revision, Hatzius explains that he has increased his estimates of the peak hit to services consumption, manufacturing activity, and construction, “in light of new evidence on the severity of the hit across the different sectors” and now expects the level of GDP in April to be 13% below the January/February trend, as shown in Exhibit 1. “We assume that this drag then fades gradually by 10% each month in the services industry and by 12.5% in the manufacturing and construction industries.”
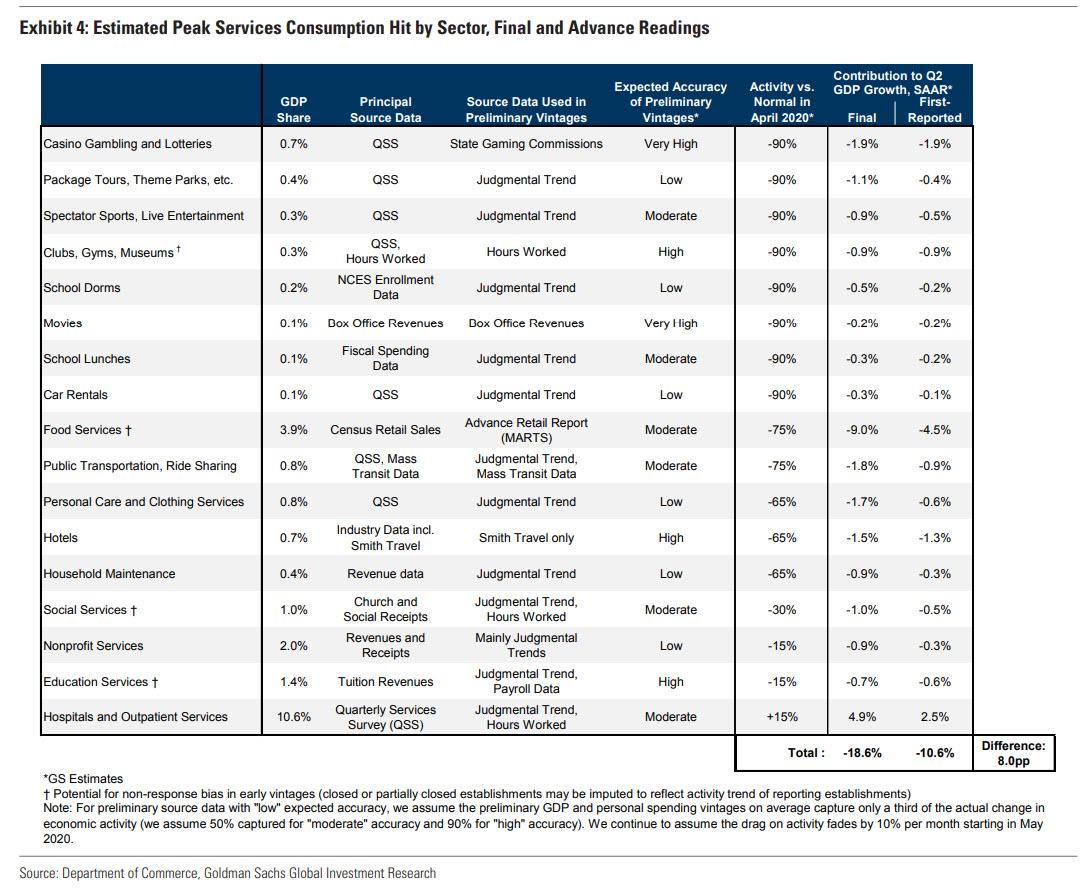
Behind the core of the drop Goldman sees a 19% annualized drag from services consumption on Q2 growth, on top of a 3pp drag on Q1 growth. as shown in the next chart.
China Reports Catastrophic Data: PMIs Crash To Record Low, Confirming Coronavirus Collapse
China Reports Catastrophic Data: PMIs Crash To Record Low, Confirming Coronavirus Collapse
One week ago, ahead of today’s Chinese data release which would for the first time capture the devastation from the coronavirus pandemic, we wrote that “to those who have been following our series of high-frequency, daily indicators of China’s economy, it will probably not come as a surprise that the world’s second biggest economy has ground to a halt, its GDP set to post the first negative print in modern history. To everyone else who is just now catching up, we have some news: it’s going to be bad.”
Specifically, we said that ahead of official Chinese economic data which will soon start capturing the period when the coronavirus hit the nation, Nomura’s Chief China economist Ting Lu noted that China’s Emerging Industries PMI (EPMI), which gauges momentum in the country’s high-tech industries and is closely correlated with official manufacturing PMI, slumped to 29.9 in February (from 50.1 in January!), its lowest-print on record (introduced Jan ’14), which as Nomura’s Charlie McElligott writes “is pure reflection of the devastating impact of the COVID-19 outbreak.“
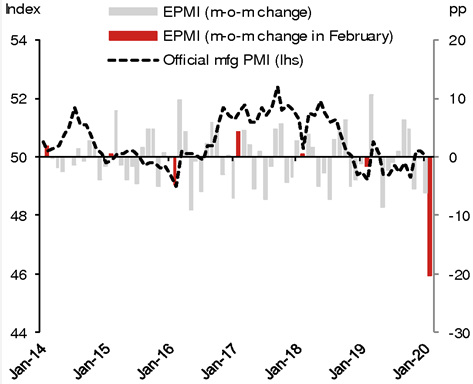
What does this mean for the closely followed China manufacturing PMI? As NOmura wrote, “even adjusting for seasonality and expected progress in business resumption in the coming week, we estimate the official manufacturing PMI could drop to a range of 30-40 in Feb.”
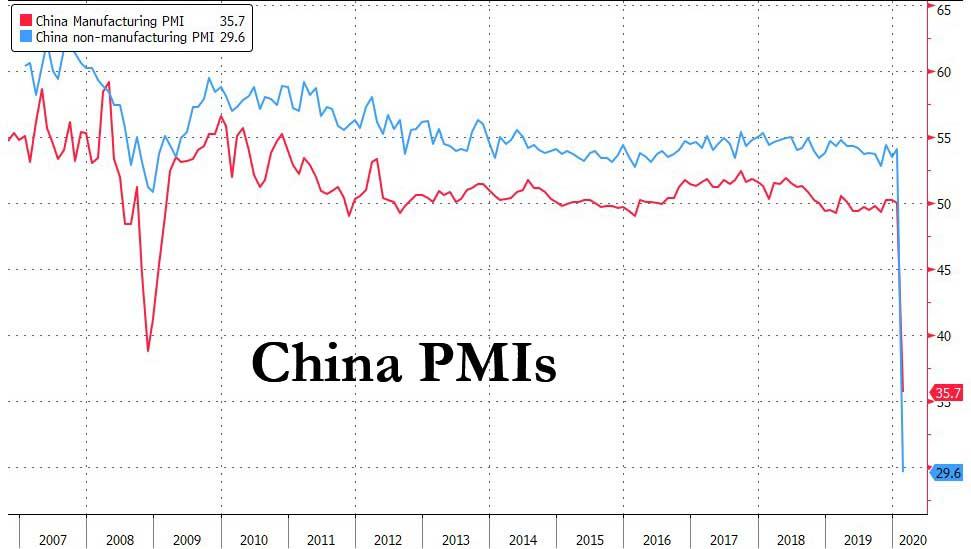
Well, it turns out that Nomura was optimistic, because moments ago China’s National Statistics Bureau reported the latest, February PMIs and they were absolutely catastrophic:
- Manufacturing PMI crashes to 35.7 in Feb, sharply below the 45.0 consensus estimate, and down from 50.0 in January. A record low.
- Non-Manufacturing PMI plummets to 28.9, also far below the 50.5 consensus, estimate, and down nearly 50% from the 54.1 in Jan. Also a record low.
…click on the above link to read the rest of the article…
No One Gets Out Of Here Alive
NO ONE GETS OUT OF HERE ALIVE

“The seasons of time offer no guarantees. For modern societies, no less than for all forms of life, transformative change is discontinuous. For what seems an eternity, history goes nowhere – and then it suddenly flings us forward across some vast chaos that defies any mortal effort to plan our way there. The Fourth Turning will try our souls – and the saecular rhythm tells us that much will depend on how we face up to that trial. The saeculum does not reveal whether the story will have a happy ending, but it does tell us how and when our choices will make a difference.” – Strauss & Howe – The Fourth Turning
As we wander through the fog of history in the making, unsure who is lying and who is telling the truth, seemingly blind to what comes next, I look to previous Fourth Turnings for a map of what might materialize during the 2nd half of this current Fourth Turning. After a tumultuous, harrowing inception to this Crisis in 2008/2009, we have been told all is well and are in the midst of an eleven-year economic expansion, with the stock market hitting all-time highs.
History seemed to stop and we’ve been treading water for over a decade. Outwardly, the establishment has convinced the masses, through propaganda and money printing, the world has returned to normal and the future is bright. I haven’t bought into this provable falsehood. Looking back to the Great Depression, we can get some perspective on our current position historically.
The Dow is up 450% since its 2009 low, which is the metric used by the establishment to prove their money printing solutions have succeeded in lifting the country from the depths of despair and depression.
…click on the above link to read the rest of the article…
China Is Disintegrating: Steel Demand, Property Sales, Traffic All Approaching Zero
China Is Disintegrating: Steel Demand, Property Sales, Traffic All Approaching Zero
In our ongoing attempts to glean some objective insight into what is actually happening “on the ground” in the notoriously opaque Chinese economy which has been hammered by the Coronavirus epidemic, yesterday we showed several “alternative” economic indicators such as real-time measurements of air pollution (a proxy for industrial output), daily coal consumption (a proxy for electricity usage and manufacturing) and traffic congestion levels (a proxy for commerce), before concluding that China’s economy appears to have ground to a halt.
That conclusion was cemented after looking at some other real-time charts which suggest that there is a very high probability that China’s GDP in Q1 will not only flatline, but crater deep in the red for one simple reason: there is no economic activity taking place whatsoever.
We start with China’s infrastructure and fixed asset investment, which until recently accounted for the bulk of Chinese GDP. As Goldman writes in an overnight report, in the Feb 7-13 week, steel apparent demand is down a whopping 40%, but that’s only because flat steel is down “only” 12% Y/Y as some car plants have ordered their employee to return to work (likely against their will as the epidemic still rages).
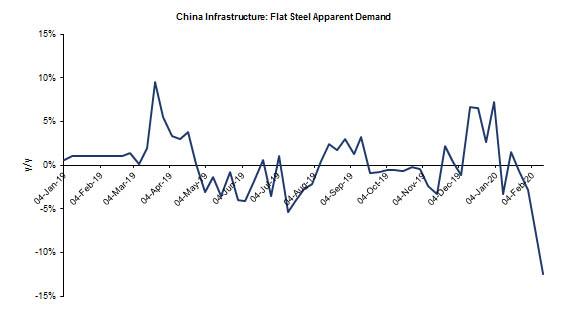
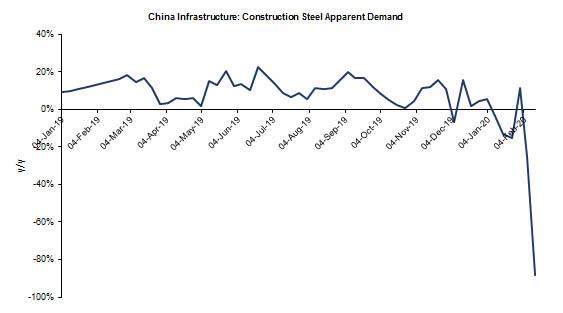
However, it is the far more important – for China’s GDP – construction steel sector where apparent demand has literally hit the bottom of the chart, down an unprecedented 88%, or as Goldman puts it, “construction steel demand is approaching zero.”
But wait, there’s more.
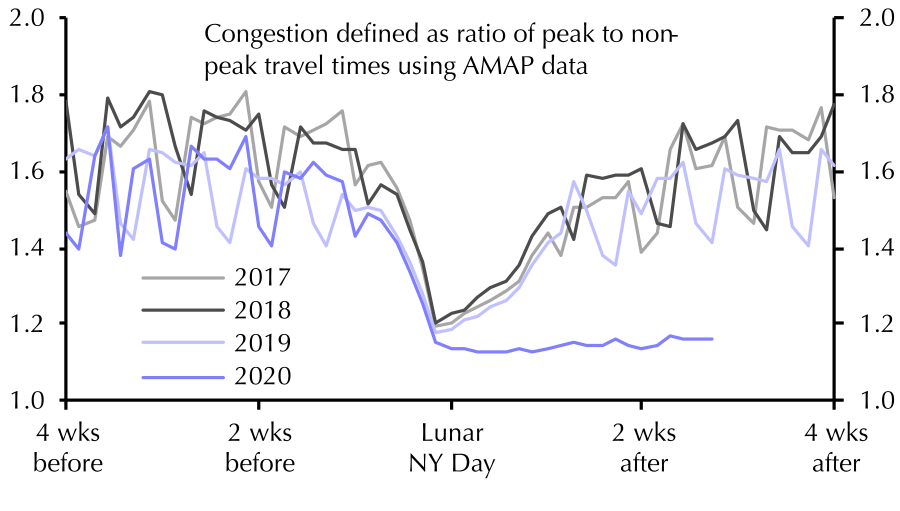
Courtesy of Capital Economics, which has compiled a handy breakdown of real-time China indicators, we can see the full extent of just how pervasive the crash in China’s economy has been, starting with familiar indicator, the average road congestion across 100 Chinese cities, which has collapsed into the New Year and has since failed to rebound.
1937
1937
We’ve talked about the year 2000 comparison (Party like it’s 1999). In 2020 markets went onto a similar structural tear just having rammed relentlessly higher. In 2000 markets famously topped in March following the Fed’s Y2K inspired liquidity injections in 1999 as markets had vastly disconnected from fundamental reality. Now that the truth is out we also know that markets are now vastly disconnected from fundamentals.
And the 2000 comparisons still hold water on a number of measures, price to sales, price to ebitda, market cap to GDP and of course relative weightings in favor of the few as the rally continues to narrow.
The top 2 stocks now have gone complete vertical especially as it relates to their weighting in the S&P:

This chart from Carter Worth on Fast Money last night and even he pointed out how in the lead up to the 2000 top there was some back and forth, but not here, just completely uninterrupted vertical.
One of the 2 stocks being Microsoft, a stock that now has nearly doubled since 2019 with a market cap expansion of over $700 billion for a total market cap of over $1.4 trillion. Historic.
And add the top 4 and their market caps you get this same vertical picture:
Everything screams reversion and correction, but nothing. The market just keeps going up and they keep buying the big cap tech stocks. Risk free. Or so it seems.
And given the large weightings of these few stocks $NDX just keeps ramping up vertically as well, also far outside the monthly Bollinger band:

…click on the above link to read the rest of the article…
The Coming Exponential Silver Price Movement
The Coming Exponential Silver Price Movement
As the global highly-leveraged debt-based financial system comes under serious stress, investors are going to finally realize that the silver market is very tiny and extremely undervalued. This is when we will likely see the exponential silver price movement. And, it’s not a matter of “IF,” but rather a case of “WHEN.”
While most precious metals analysts focus on the systemic risks in the financial system to own Silver, I believe the real problem has to do with the HUGE ISSUES we are now facing with ENERGY. In my newest video, The Coming Exponential Silver Price Movement, I discuss the two reasons why I believe we are going to BIG MOVE in the silver price.
In the video, I show why the huge U.S. Total Debt to GDP of 346% is unsustainable due to the coming collapse of the U.S. Shale Oil Industry. Without oil production growth, there is no GDP growth. And, when there is no GDP growth, then the entire highly-leveraged debt-based financial system starts to disintegrate.

When Americans are faced with the task of “Protecting Wealth,” they will find out that “PAPER” or “DIGITS” will not make the CUT. Why? Paper money and Digits are based on future energy production. Thus, they are ENERGY IOU’s. However, Silver is money or wealth because it is a store of Energy Equivalent Value.
Also, in the video, I discuss some updated charts on U.S. Physical Silver Investment from 2010-2018 (Source: Metals Focus Silver Investment Report for the Silver Institute– OCT 2019):

…click on the above link to read the rest of the article…
Recession Arithmetic: What Would It Take?
Recession Arithmetic: What Would It Take?

David Rosenberg explores Recession Arithmetic in today’s Breakfast With Dave. I add a few charts of my own to discuss.
Rosenberg notes “Private fixed investment has declined two quarters in a row as of 2019 Q3. Since 1980, this has only happened twice outside of a recession.”
Here is the chart he presented.
Fixed Investment, Imports, Government Share of GDP

Since 1980 there have been five recessions in the U.S.and only once, after the dotcom bust in 2001, was there a recession that didn’t feature an outright decline in consumption expenditures in at least one quarter. Importantly, even historical comparisons are complicated. The economy has changed over the last 40 years. As an example, in Q4 of 1979, fixed investment was 20% of GDP, while in 2019 it makes up 17%. Meanwhile, imports have expanded from 10% of GDP to 15% and the consumer’s role has risen from 61% to 68% of the economy. All that to say, as the structure of the economy has evolved so too has its susceptibility to risks. The implication is that historical shocks would have different effects today than they did 40 years ago.
So, what similarities exist across time? Well, every recession features a decline in fixed investment (on average -9.8% from the pre-recession period), and an accompanying decline in imports (coincidentally also about -9.5% from the pre-recession period). Given the persistent trade deficit, it’s not surprising that declines in domestic activity would result in a drawdown in imports (i.e. a boost to GDP).
So, what does all of this mean for where we are in the cycle? Private fixed investment has declined two quarters in a row as of 2019 Q3. Since 1980, this has only happened two other times outside of a recession. The first was in the year following the burst of the dotcom bubble, as systemic overinvestment unwound itself over the course of eight quarters.
…click on the above link to read the rest of the article…


