Home » Posts tagged 'peak oil' (Page 17)

Tag Archives: peak oil

Olduvai
Click on image to purchase

Olduvai III: Catacylsm
Click on image to purchase

Post categories

Post Archives by Category

Top 5 Oil Producing Countries Could See Production Peak This Year

Top 5 Oil Producing Countries Could See Production Peak This Year

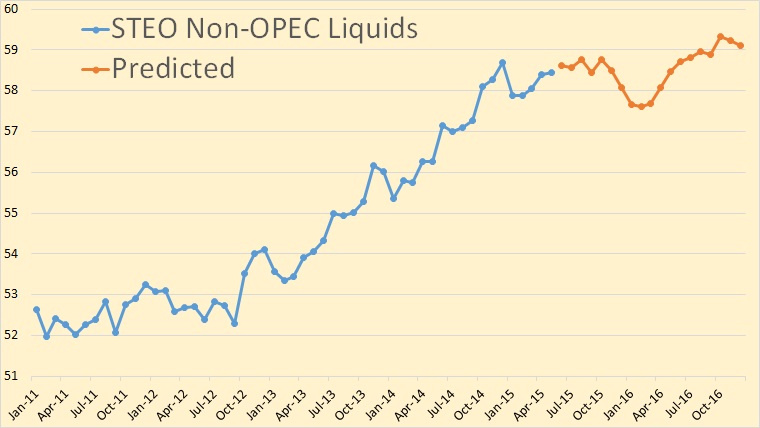
The EIA’s Short-Term Energy Outlook came out a few days ago. That is where they try to guess the future production and price for oil, for the USA as well as the world. As of late they seem to be getting a little timid with their predictions. They are saying not much growth is happening until the fourth quarter of 2016, and only a slight bump then.

(Click to enlarge)

This chart is Non-OPEC Total Liquids in million barrels per day. Production of N.O Liquids surged upwards from September of 2012 until December 2014, gaining 6.38 million barrels per day in those 27 months. That’s an average increase of 236,000 barrels per day per month. But then in January 2015 there was a drop of 800,000 bpd.

Non-OPEC total liquids still have not reached that December high again but the EIA thinks they will by August. I have my doubts. I also think they have their April and May liquids production estimates a little too high here. I have their predictions here starting in June though the EIA starts their projection in July. But there is no way that June production is anything but a guess here, and a bad guess at that.

(Click to enlarge)

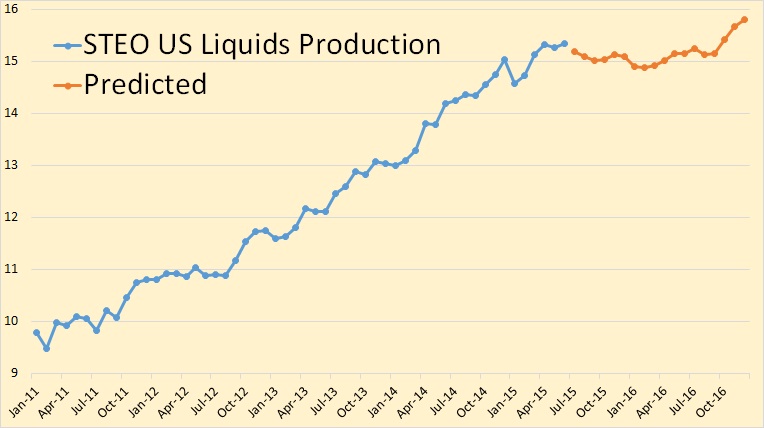
For four and one half years, US Total Liquids increased by an average of over 100,000 barrels per day per month. Now the EIA says US Liquids have reached a plateau where they will remain through September of 2016. Then for some unknown reason the US will resume it upward surge.

Notice the huge decline of 460,000 bpd in January 2015. But then there was an increase of 160,000 bpd in February, 390,000 bpd in March and 190,000 bpd in April. That’s an increase of 740,000 barrels per day over three months when the US rig count was falling dramatically. I look for those numbers to be revised in the next couple of months.


…click on the above link to read the rest of the article…

The EIA’s Short-Term Guessing Game

The EIA’s Short-Term Guessing Game

STEO N-O Liquids

This chart is Non-OPEC Total Liquids in million barrels per day. Production of N.O Liquids surged upwards from September of 2012 until December 2014, gaining 6.38 million barrels per day in those 27 months. That’s an average increase of 236,000 barrels per day per month. But then in January 2015 there was a drop of 800,000 bpd.

Non-OPEC total liquids still have not reached that December high again but the EIA thinks they will by August. I have my doubts. I also think they have their April and May liquids production estimates a little too high here. I have their predictions here starting in June though the EIA starts their projection in July. But there is no way that June production is anything but a guess here, and a bad guess at that.

STEO US Liquids

For four and one half years, US Total Liquids increased by an average of over 100,000 barrels per day per month. Now the EIA says US Liquids have reached a plateau where they will remain through September of 2016. Then for some unknown reason the US will resume it upward surge.

Notice the huge decline of 460,000 bpd in January 2015. But then there was an increase of 160,000 bpd in February, 390,000 bpd in March and 190,000 bpd in April. That’s an increase of 740,000 barrels per day over three months when the US rig count was falling dramatically. I look for those numbers to be revised in the next couple of months.


…click on the above link to read the rest of the article…

Oil Shock Models with Different Ultimately Recoverable Resources of Crude plus Condensate (3100 Gb to 3700 Gb)

Oil Shock Models with Different Ultimately Recoverable Resources of Crude plus Condensate (3100 Gb to 3700 Gb)

The views expressed are those of Dennis Coyne and do not necessarily reflect the views of Ron Patterson.

blog20150706/

The post that follows relies heavily on the previous work of both Paul Pukite (aka Webhubbletelescope) and Jean Laherrere and I thank them both for sharing their knowledge, any mistakes are my responsibility.

In a previous post I presented a simplified Oil Shock model that closely followed a 2013 estimate of World C+C Ultimately Recoverable Resources (URR) by Jean Laherrere of 2700 Gb, where 2200 Gb was from crude plus condensate less extra heavy oil (C+C-XH) and 500 Gb was from extra heavy (XH) oil resources in the Canadian and Venezuelan oil sands.

In the analysis here I use the Hubbert Linearization (HL) method to estimate World C+C-XH URR to be about 2500 Gb. The creaming curve method preferred by Jean Laherrere suggests the lower URR of 2200 Gb, if we assume only 200 Gb of future reserve growth and oil discovery.

Previously, I have shown that US oil reserve growth (of proved plus probable reserves) was 63% from 1980 to 2005. If we assume all of the 200 Gb of reserves added to the URR=2200 Gb model are from oil discoveries and that in a URR=2500 Gb, oil discoveries are also 200 Gb, then 300 Gb of reserve growth would be needed over all future years (we will use 90 years to 2100) or about 35% reserve growth on the 850 Gb of 2P (proved plus probable) reserves in 2010. I conclude that a URR of 2500 Gb for C+C-XH is quite conservative.

A problem with the Hubbert Linearization method is that there is a tendency to underestimate URR.

…click on the above link to read the rest of the article…


The EIA’s Questionable Numbers

The EIA’s Questionable Numbers

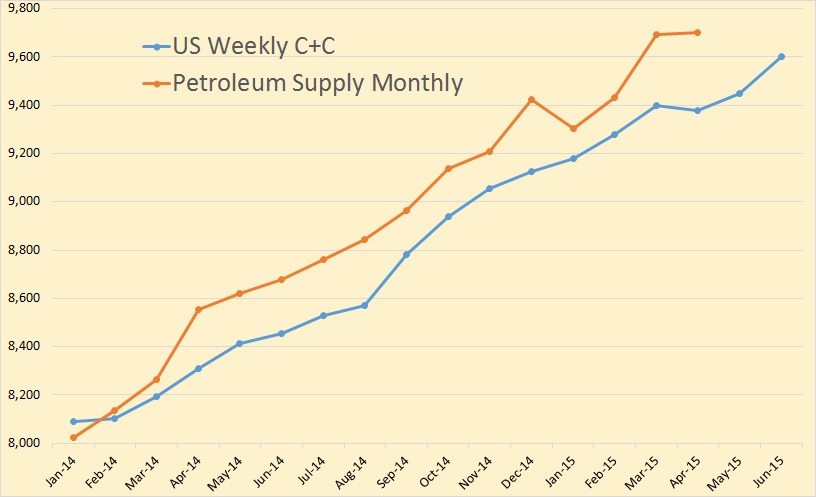
EIA Post 1

I averaged the weekly numbers and converted them to monthly data. They were pretty close for the first three months of 2014 but then they begin to diverge. Of course they were much closer earlier but in the Petroleum Supply Monthly has, over several months, been revised upward. The Weekly Petroleum Status Report is never revised.

In April, the Petroleum Supply Monthly shows US C+C production 322,000 barrels per day above the weekly average of the Weekly Petroleum Status Report.

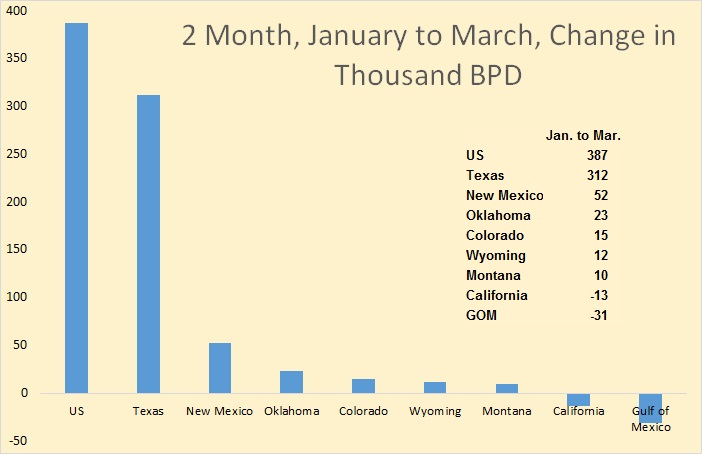
EIA Post 2

The Petroleum Supply Monthly shows US production increased 387,000 barrels per day in the two months January to March. That is an increase when oil rigs were being stacked by the dozens. They show Texas up 312,000 over those two months and New Mexico up 52,000 bpd. That means they think the Permian, which is mostly in Texas but partly in New Mexico, was really booming during those two months.


EIA Post 3

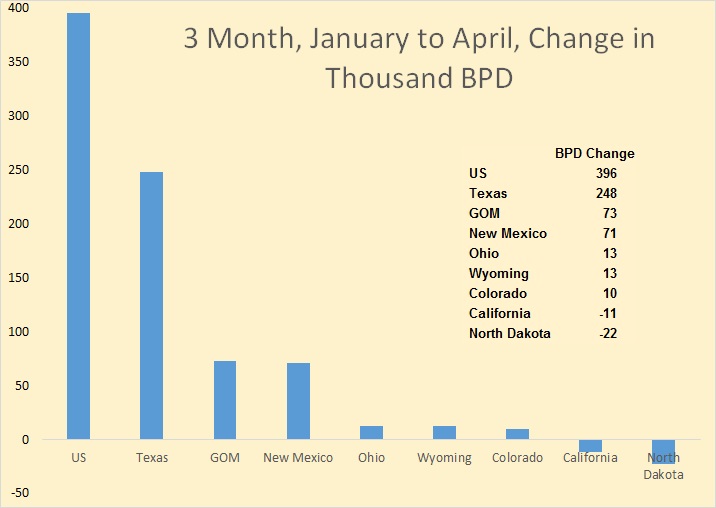
The EIA has crude production continuing to climb during April, up 396,000 bpd January to April. The Gulf of Mexico, which had been down slightly the previous three months, was shown up 104,000 in April, giving them a gain of 71,000 bpd over the three months.

But obviously Texas is where all the action is.


…click on the above link to read the rest of the article…

Are We Headed For Global Warming Collapse?

Are We Headed For Global Warming Collapse?

Collapse Post 2

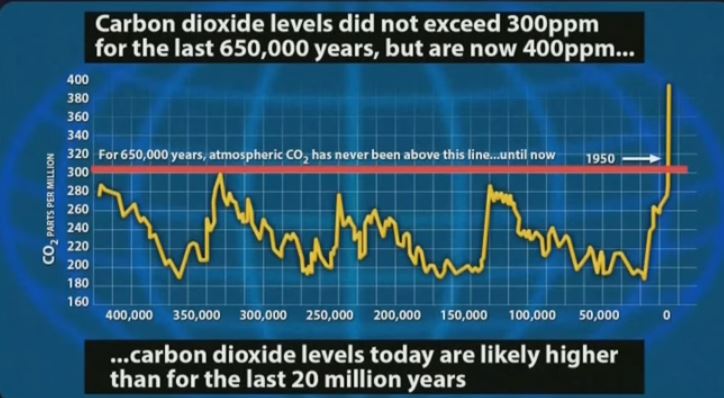
Right now CO2 is higher than it has been in over 20 million years. But it has been higher, a lot higher.

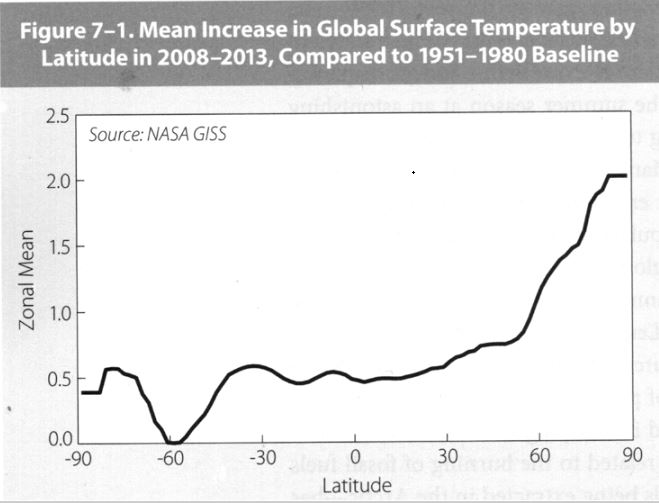
The chart below was published in the Worldwatch Institute’s State of the World 2015 and the source of their data was Goddard Institute for Space Studies

Collapse Post 11

What this chart clearly shows is that global warming, so far, is primarily a northern hemisphere phenomenon and mostly above 60 degrees latitude.

Arctic still heating up twice as fast as rest of planetAnnual average temperatures have continued to rise for the region as a whole throughout the recent slowdown in the pace of warming globally, according to a new analysis of conditions above 60 degrees north latitude.

Collapse Post 3

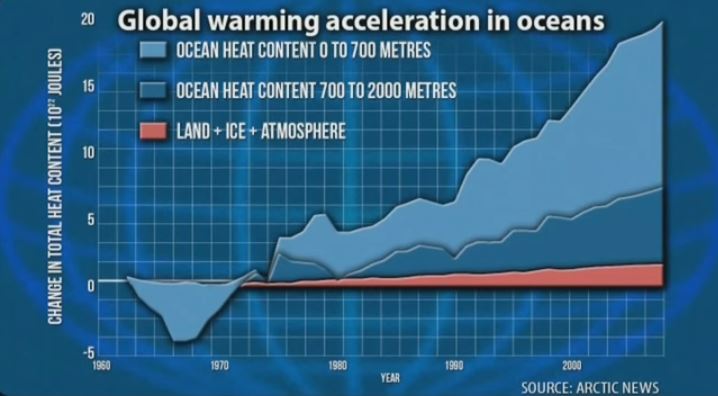
The ocean, especially the arctic ocean, is warming much faster than the atmosphere.

In fact, the loss of reflective sea ice is part of the reason Arctic temperature has risen three times faster than the global average in recent decades. This effect, known as Arctic amplification, has consequences for nearby land ice, too.

But why is the Northern  Well for one reason that’s where most of the people are. That’s where most of the CO2 emissions comes from. But… don’t the air mix from north to south?


…click on the above link to read the rest of the article…

How Pope Francis’s climate encyclical is liberating the world

How Pope Francis’s climate encyclical is liberating the worldPope Encyclical Quote

In my life there are two things that have the effect of at least somewhat isolating me from others. The first is being a writer on climate change, peak oil, and the economic crises bound up with those modern predicaments. The other is being a Christian environmentalist.

In the first case, my essays, as well as my social media presence, fairly well run counter to the whole of my society and culture, even when a few outliers add concurring thoughts to the mix.

But in the end, by writing a write a blog about what people shouldn’t do, about the things we should give up and forsake for a concept of the greater good, about the ways our habits imperil the world and especially our children and future generations, I can kind of come off like a scold even in my most mild iteration. And forget about those times when I’ve lost all patience with the excuses and indifference to our shared world — then I’m sure I can be a real jerk.

By contrast, my friends who write blogs on the 40th new way to redecorate your home, the best new destination to jet off to, and the greatest products to try as a mommy blogger, are infinitely more popular and beloved than me.

I end up feeling like I stand alone, or at best with a small group of similarly-minded, possible loonies, who together are spitting into a hot and rancid wind.

Crossroads

As an eco-conscious Christian, my experience is not dissimilar.

While I love Christ unreservedly, and without wavering, and that relationship is the most meaningful and important in my life, still, in my life with fellow Christians and with the Church, I have found little immediate commonality on the issue of creation care.

– See more at: http://transitionvoice.com/2015/06/how-pope-francis-climate-encyclical-is-liberating-the-world/#sthash.SbPvipm7.dpuf


Asia’s oil consumption at record high while production peaked in 2010

Asia’s oil consumption at record high while production peaked in 2010

The annual BP Statistical Review has come out, as usual in June. In this post we focus on the Asia Pacific region. This is important because the Australian government has offered the help of “Team Australia” to build the “Asian Century”. The question no one asks (or wants to ask) is how much oil there is to carry Asia through the decades to come. No one can give an answer of course but it is clear that if past oil consumption and production trends continue the region will slide into a huge oil crisis.

Overview

Oil production in the Asia Pacific peaked in 2010 (China offshore!) at 8.4 mb/d while consumption continued to increase to 30.9 mb/d.

Fig 1: Asia-Pacific oil production and consumption

The difference between consumption and production (net imports) is now 73% of consumption, up from 68% ten years ago.

Oil consumption changes

Let’s zoom into the last 10 years. Consumption growth dropped from 6.2% in 2009/10 to 1.5% in 2013/2014 but this is still an annual 440 kb/d. If this reduced consumption growth were to continue an extra 2.2 mb/d would be needed by 2020 and 4.4 mb/d by 2025.

Fig 2:  Asia’s oil production and consumption changes since 2005

Since global crude oil production started to peak in 2005 (base year in above graph), Asia did remarkably well to suck additional oil out of the global market, around 6 mb/d


…click on the above link to read the rest of the article…

Peak oiler? Not Catholic? You should still stand with the pope on climate

Peak oiler? Not Catholic? You should still stand with the pope on climate 

support pope on climate

I get it, you believe in peak oil. So do I, despite gas at $2.50 a gallon. But peak oil is no excuse for either you or me to just sit around waiting for the final oil crash to make the climate problem moot by bringing down industrial civilization.

Even if you’re the world’s biggest doomer, you have to admit that the timing is too uncertain — will the über-crash come in five months or five decades? Nobody knows for sure.

So far, the puppet masters of the world economy have been pretty good at keeping the party going longer than anybody had a right to expect. Who’s to say that oil wars, extreme energy production and various accounting tricks can’t keep mass consumerism running in many places into the middle of the century or beyond?

So don’t hold your breath waiting for collapse. Instead, leave your cynicism behind and let Pope Francis inspire you to finally get serious about climate, a problem that we know is already here and whose future consequences will be unthinkable — unless the world seriously changes its ways, oil crash or not.

A blessing of papal awesomeness

And if you do care about climate change, then what’s not to like in the pope’s encyclical that came out this week?

OK, well, maybe he could have been better about recognizing overpopulation as part of the climate problem. But he’s right that it’s hypocritical for rich countries to use climate as an excuse to pressure poor ones about population. All poor countries put together have done almost nothing to warm the atmosphere compared to the real culprits, the rich nations of North America and Europe.

– See more at: http://transitionvoice.com/2015/06/not-catholic-you-can-still-stand-with-the-pope-on-climate/#sthash.roDZr6r3.dpuf


Texas Oil and Gas Production for April

Texas Oil and Gas Production for April

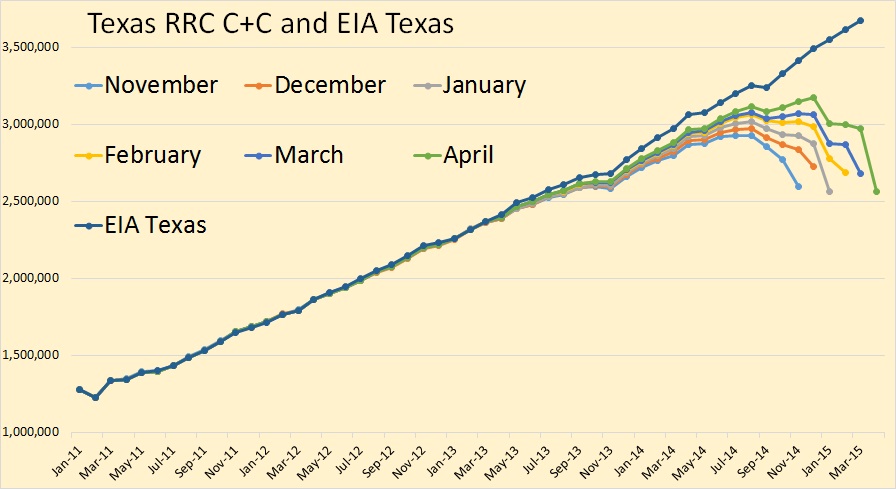
The preliminary Texas RRC Production Data is out this morning. There appears to be a considerable drop in Texas crude oil production in April. All Texas RRC data in the charts below is through April 2015 and all EIA data is through March 2015.

For those new to this site, the Texas RRC data is incomplete. The drooping lines will eventually, after the final data comes in, closer resemble the EIA data. Though I believe the EIA data is quite a bit too high at this point.

Texas C+C

It appears that, when the final data comes in that Texas will have took a huge hit in January, recovered somewhat in February and March, then took another hit this past April.

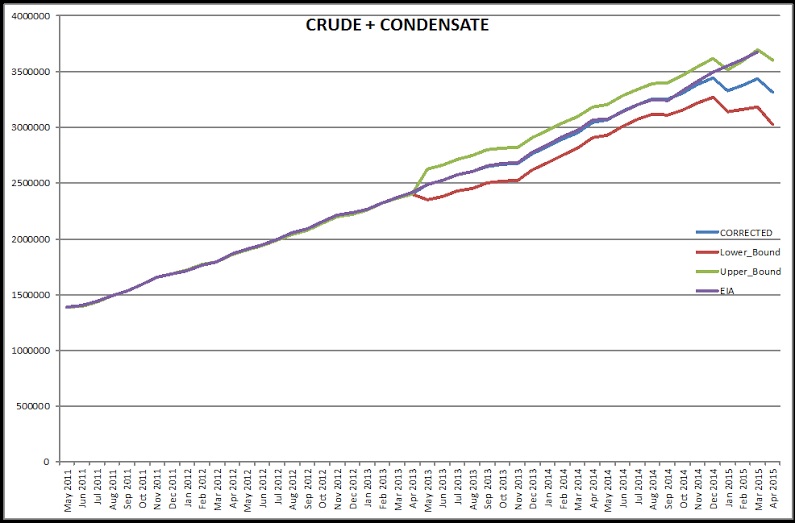
Dean C+C

Dr. Dean Fantazzini, with his algorithm that calculates the final production numbers, also comes to the conclusion that Texas took a hit in April production. Dean has three results with the most probable in the middle.


…click on the above link to read the rest of the article…

Plenty of trouble: Feeding a climate changed world after peak oil

Plenty of trouble: Feeding a climate changed world after peak oil

Nothing is more precious than balance, stability, and sustainability. Today, we’re hanging by our fingernails to a skyrocket of intense insane change, and it’s the only way of life we’ve ever known.  Joel Bourne has spent his life riding the rocket.  He grew up on a farm, and studied agronomy at college. But sharp changes were causing many farmers to go bankrupt and taking over the family farm would have been extremely risky, so he became a writer for farm magazines.  Later, he was hired by National Geographic, where he has spent most of his career.

In 2008, he was assigned to cover the global food crisis, and this project hurled him into full awareness of the big picture.  The Green Revolution caused food production to skyrocket, and world population doubled in just 40 years.  Then, the revolution fizzled out, whilst population continued to soar.  Demographers have told us to expect another two or three billion for dinner in 2050.  Obviously, this had the makings of an excellent book, so Bourne sat down and wrote The End of Plenty.

The subtitle of his book is “The Race to Feed a Crowded World,” not “The Race to Tackle Overpopulation.”  A growing population thrills the greed community, and a diminishing herd does not. Overpopulation is a problem that can be solved, and will be, either by enlightened self-restraint, by compulsory restraint, or, most likely, by the vigorous housekeeping of Big Mama Nature.  Feeding the current population is thrashing the planet, and feeding even more will worsen everything, but this is our primary objective.  We are, after all, civilized people, and enlightened self-restraint is for primitive savages who live sustainably in roadless paradises.

– See more at: http://transitionvoice.com/2015/06/plenty-of-trouble-feeding-a-climate-changed-world-after-peak-oil/#sthash.8vamboU4.dpuf


Peak Oil: Myth Or Coming Reality?

Peak Oil: Myth Or Coming Reality?

In 1956, a geoscientist named M. King Hubbert formulated a theory which suggested that U.S. oil production would eventually reach a point at which the rate of oil production would stop growing. After production hit that peak, it would enter terminal decline. The resulting production profile would resemble a bell curve and the point of maximum production would be identified as Peak Oil, a point of no return.

The original peak oil curve
Image Source: Cornell University

Hubbert first predicted that U.S. oil production would peak in 1970 and then start declining rapidly. His prediction turned out to be partly true, as U.S. crude oil production peaked that same year, not to be eclipsed again until the shale boom began.

Annual crude oil production (in thousands of barrels per year) for entire United States, with contributions from individual regions as indicated.

“The end of the oil age is in sight, if present trends continue production will peak in 1995 — the deadline for alternative forms of energy that must replace petroleum in the sharp drop-off that follows.” This is what Hubbert had to say in 1974, based on 628 billion barrels of proven oil reserves. However, his prediction didn’t turn out to be true, as global oil production continues to surge, thanks to new oilfield discoveries and improved exploration and drilling technology.


…click on the above link to read the rest of the article…

OPEC + Different EIA Data

OPEC + Different EIA Data

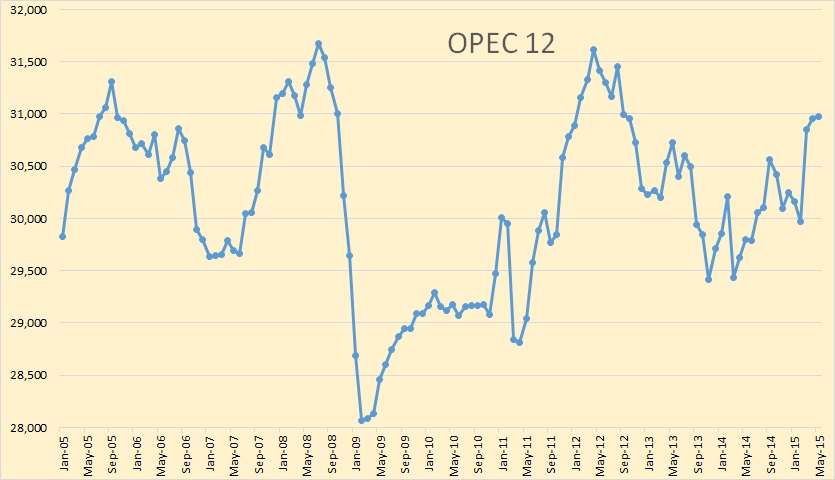
OPEC 12

OPEC crude only production was up 23,000 bpd in May but that was after April had been revised upward by 110,000 bpd.

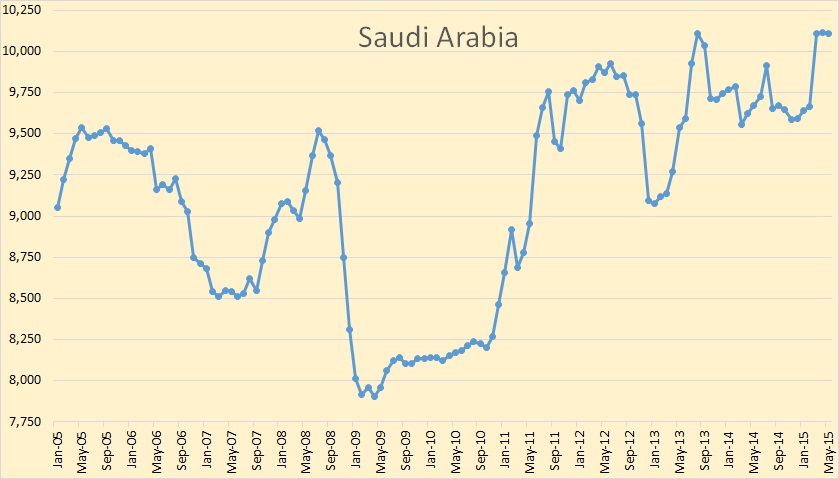
Saudi Arabia

Almost no change is Saudi production, down 5,000 bpd to 10,107,000 bpd.

Iraq

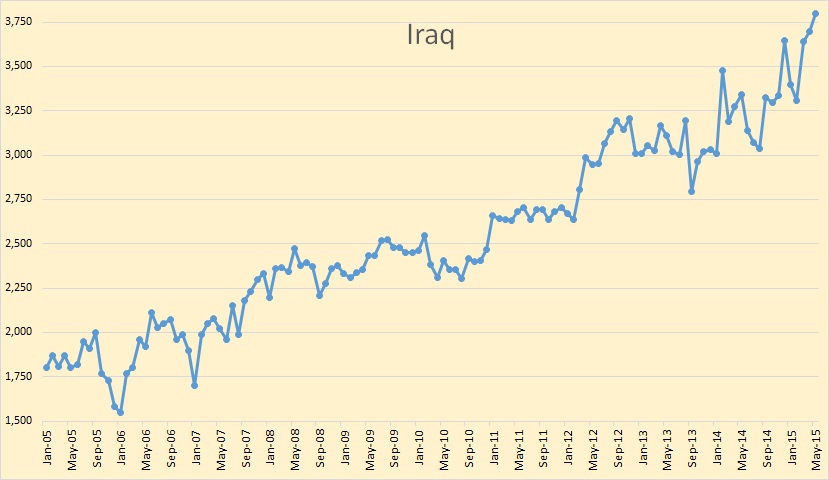
Iraq had the largest change of all, up 105,000 bpd to 3,800,000 bpd.


…click on the above link to read the rest of the article…

China’s offshore CNOOC started to peak in 2010

China’s offshore CNOOC started to peak in 2010

The China National Offshore Oil Corporation (CNOOC) is the largest producer of offshore oil and gas in China. Production statistics should therefore be pretty much indicative of what is happening along China’s coastline. Data from annual reports show that net oil and gas liquids production in 4 key offshore areas increased rapidly in the first decade of this century but then remained fairly flat after 2010. Gas production peaked in 2011 and was 7% lower in 2014.

At the recent 14th Asia Security Summit in Singapore – organised by the Centre for International and Strategic Studies (CSIS, Washington) – media focus was on several artificial islands China is building on half sunken reefs in the South China Sea.

Dredging….

Fig 1: Fiery Cross Reef reclamation started in Aug 2014

http://amti.csis.org/fiery-cross-reef-tracker/

South China Sea dispute: US defence secretary demands Beijing immediately halt island-building

28/5/2015

The United States has demanded Beijing immediately halt its island-building activity near the South China Sea, echoing recent concerns expressed by Australia’s Defence Department boss.

“We want a peaceful resolution of all disputes and an immediate and lasting halt to land reclamation by any claimant,” he said.

“We also oppose any further militarisation of disputed features.”

The growing tensions to Australia’s north are also causing alarm in diplomatic and military circles in Canberra.

http://www.abc.net.au/news/2015-05-28/south-china-sea-us-demands-beijing-cease-island-building/6505072

But little attention was given to the real battle along China’s coast and the statistics behind it.

….and Drilling 3,600 km further North

Pic 2: Installation of platform at Qinhuangdao 32-6 in Bohai Bay (QHD phase 2) June 2014

http://www.cnoocengineering.com/en/single_news_content.aspx?news_id=12590


…click on the above link to read the rest of the article…


“Mad Max: Fury Road” Is a Resource-Conscious Blockbuster for Our Time

“Mad Max: Fury Road” Is a Resource-Conscious Blockbuster for Our Time

Who ruined Mad Max’s world? The new film isn’t afraid to lay blame — and suggest a way forward.

When the first Mad Max was released back in 1979, the era’s reigning existential threats were nuclear winter and, to a lesser extent, peak oil. Set in a not-too-distant dystopian future and against the harsh backdrop of rural Australia, viewers’ ability to map their own fears onto the screen was crucial to that film’s success.

The film doesn’t just rebuke the greedy.

Although the fears have changed, you could say the same thing about Mad Max: Fury Road, the series’ long-awaited fourth installment. Released this month in the midst of California’s historic drought and increasingly bleak studies about the likelihood of catastrophic climate change, the film plays more on viewers’ anxieties about a carbon bomb than a nuclear one.

Director George Miller’s pitched focus on resources reflects today’s embattled context to a tee. Mad Max is not only a rollicking, white-knuckle action flick on spiked 6-foot wheels. It also carries an important and all-too-timely message, shouted defiantly by no less than an aged, graffiti-scrawling woman wielding a shotgun: “You cannot own a human being!” nor the planet on which they live.

Miller’s eponymous antihero, Max Rockantansky (Tom Hardy), inhabits a parched dystopia created by dual resource crises. Invoking political strategist James Carville, the movie’s opening-by-way-of-background announces, “It’s the oil, stupid,” briefing viewers on the water wars, oil shortage, and subsequent state suppression that jolted humanity into chaos. As the world’s supplies of fossil fuels and water dwindle, its citizens are reduced to a single instinct: survival.

…click on the above link to read the rest of the article…


World Oil Output Last 3 Years

World Oil Output Last 3 Years

The EIA publishes every possible energy stat for the USA and hardly anything for the rest of the world. Well, anything current for the rest of the world anyway. TheirInternational Energy Statistics is already five full months behind and working on six. December 2014 is the last international oil production data we have.

Anyway during this lull in other data I decided to look at the last three years of international data, from December 2011 to December 2014. All data is in thousand barrels per day.Post 1

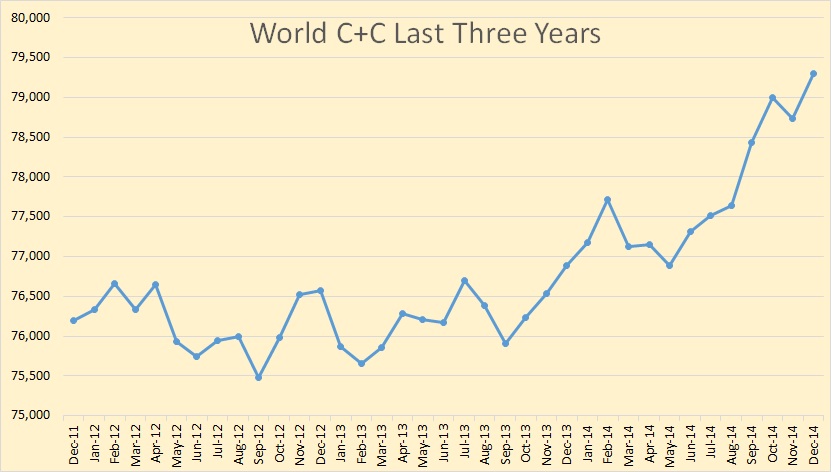
World C+C production was flat for most of 2012 and 2013 but in late 2013 production took off and has increased by about 3 million barrels per day above the average for 2012 and 2013. December C+C production was 79,300,000 BPD.

Post 4

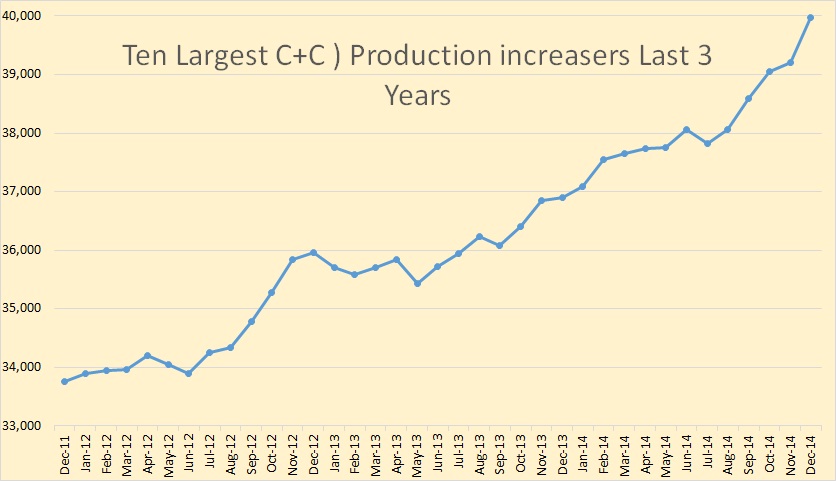
While total C+C production has increased by 3,000,000 BPD over the last three years the top ten gainers have increased just over twice as much, 6,200,000 BPD.

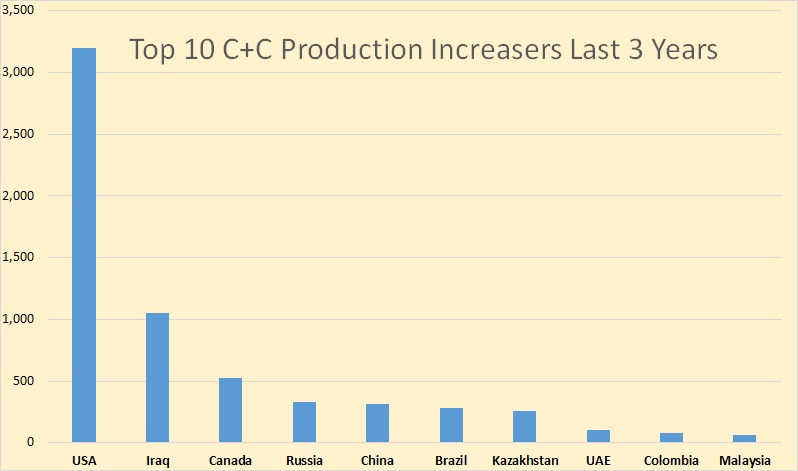
And just who were the big C+C production increasers for the last three years. Keep in mind this is the total change, or increase, over the last three years, not total production.

Post 2

The largest gainer, by a wide margin, was the USA. Iraq and Canada were runners up and the rest were also rans.

Almost everyone else had declines.


…click on the above link to read the rest of the article…

Olduvai IV: Courage
Click on image to read excerpts

Olduvai II: Exodus
Click on image to purchase

Click on image to purchase @ FriesenPress