Home » Posts tagged 'quantitative easing' (Page 14)

Tag Archives: quantitative easing

Olduvai
Click on image to purchase

Olduvai III: Catacylsm
Click on image to purchase

Post categories

Post Archives by Category

Drowning In The Money River

Photobank gallery/Shutterstock

Drowning In The Money River

Why the 99% of us are falling farther behind

It’s a big club and you ain’t in it.
~ George Carlin

If you suspect society is unfair, that there’s a different set of rules the rich live by, you’re right.

I’ve had ample chance to witness first-hand evidence of this in my time working on Wall Street and in Silicon Valley. Simply put: our highly financialized economy is gamed to enrich those who run it, at the expense of everybody else.

The Money River

A recent experience really drove this home for me.

Having received my MBA from Stanford in the late 90s, I remain on several alumni discussion groups. Recently, a former classmate of mine, who now runs her own asset management firm, circulated her thoughts on how today’s graduating students could best access an on-ramp to the ‘money river’.

What’s the ‘money river’? Good question.

The money river is the huge tsunami of investment capital sloshing around the globe, birthed by the historically-unprecedented money printing conducted by the world’s central banks over the past decade. Since 2008, they’ve more than tripled their collective balance sheet:

(Source)

The $13+ trillion in new thin-air money issued to achieve this is truly staggering. It’s so large that the human brain really can’t wrap around it. (For those who haven’t seen it, watch our brief video How Much Is A Trillion? to better understand this.)

But suffice it to say, all that money has to go somewhere. And it first goes into the pockets of those with closest access to it, and of those who direct where it flows.

…click on the above link to read the rest of the article…

What Has QE Wrought?

What Has QE Wrought?

bubbles_1.PNG

[Editor’s Note: Watch Ron Paul deliver this Special Report here.​]

The Great Recession began in 2007. It didn’t take long for the money managers to recognize its severity, and that a little tinkering with interest rates would not suffice in dealing with the economic downturn. In Dec. 2008, the first of four Quantitative Easing programs began which did not end until Dec. 18, 2013. Some very serious consequences of this policy of unprecedented credit creation have set the stage for a major monetary reform of the fiat dollar system. The dollar’s status as the reserve currency of the world will continue to be undermined. This is not a minor matter. As our financial system unravels, the seriousness of it will become evident to all, as the need to pay for our extravagance becomes obvious. This will make the country much poorer, though the elite class that manages such affairs will suffer the least.

By the time the QE’s ended, the Central banks of the world had increased their balance sheet by $8.3 trillion, with only $2.1 trillion worth of GDP growth to show for it. This left $6.2 trillion of excess liquidity in the banking system that did not go where the economic planners had hoped. Central banks now own $9.7 trillion of negative interest yielding bonds. The financial system has been left with a bubble mania, financed by artificial credit and unsustainable debt. The national debt in 2007 was $8.9 trillion; today it’s $20.5 trillion. Rising interest rates will come and that will be deadly for the economy and the Federal budget.

This inflationary policy is generated by the belief that there is no benefit in allowing the needed economic correction to the problems generated by the Fed to occur. The correction is what the market requires, not the resumption and acceleration of the dangerous inflationary policy that caused the bubble economy.

…click on the above link to read the rest of the article…

QE Party Over, even by the Bank of Japan

QE Party Over, even by the Bank of Japan

First decline in its colossal balance sheet since 2012.

An amazing – or on second thought, given how central banks operate, not so amazing – thing is happening.

On one hand…

Bank of Japan Governor Haruhiko Kuroda keeps saying that the BOJ would “patiently” maintain its ultra-easy monetary policy, so too in his first speech of 2018 in Tokyo, on January 3, when he said the BOJ must continue “patiently” with this monetary policy, though the economy is expanding steadily. The deflationary mindset is not disappearing easily, he said.

On December 20, following the decision by the BOJ to keep its short-term interest-rate target at negative -0.1% and the 10-year bond yield target just above 0%, he’d brushed off criticism that this prolonged easing could destabilize Japan’s banking system. “Our most important goal is to achieve our 2% inflation target at the earliest date possible,” he said.

On the other hand…

In reality, after years of blistering asset purchases, the Bank of Japan disclosed today that total assets on its balance sheet actually inched down by ¥444 billion ($3.9 billion) from the end of November to ¥521.416 trillion on December 31. While small, it was the first month-end to month-end decline since the Abenomics-designed “QQE” kicked off in late 2012.

Under “QQE” – so huge that the BOJ called it Qualitative and Quantitative Easing to distinguish it from mere “QE” as practiced by the Fed at the time – the BOJ has been buying Japanese Government Bonds (JGBs), corporate bonds, Japanese REITs, and equity ETFs, leading to astounding month-end to month-end surges in the balance sheet. But now the “QQE Unwind” has commenced. Note the trend over the past 12 months and the first dip (red):

…click on the above link to read the rest of the article…

Quantitative Tightening Is the Biggest Economic Threat in 2018

Quantitative Tightening Is the Biggest Economic Threat in 2018

In response to the 2008 financial crisis, the Fed and other central banks deployed zero or near-zero interest rates, quantitative easing, and assorted other interventions.

These may have averted an even worse disaster, but their impacts were far from ideal. Nonetheless, the economy slowly lifted off as consumers rebuilt their balance sheets and asset values rose.

The asset values climbed in large part because the Fed practically forced everyone with money to invest it in risk assets: stocks, real estate, corporate bonds, etc.  But as my long-time Thoughts from the Frontline readers know, the Fed’s trickle-down monetary policy hasn’t really worked.

The resulting wealth effect theoretically enabled more spending, at least by those in the top income quintile. But the recovery has been slow and ugly, and too many people still don’t feel the progress.

QE Benefits Were Not Evenly Distributed

Those who gripe about income inequality actually have points to make.

Even if you filter out the top one half of 1% (the tech billionaires, Warren Buffett, et al.), there is still a large imbalance in how much the top and bottom earners have benefited from the Fed’s lopsided monetary policy.

The chart below shows that the share of unmarried adults in double-up households has increased in all age brackets, and especially among Millennials.


Source: Zillow

Having a few Millennials in my own family, and even some young Gen Xers, the need to double up is readily apparent to me. Rents are just too high for the average person. Also notice that nearly one in three people between ages 50 and 59 is living with someone else in order to save on rent and other expenses.

…click on the above link to read the rest of the article…

The Debt Beneath

The Debt Beneath

Debt is irrelevant and matters not. It’s different this time. That’s the message from politicians, markets and participants. Tax cuts pay for themselves (they do not), leverage doesn’t matter (it does) and the increased costs of servicing the debt as a result of rising rates will be offset by imaginary real wage growth to come (they won’t). But the calmest market waters in history continue to keep these illusions alive as asset prices keep levitating from record to record.

Debt does matter and it was ironically left to Janet Yellen to voice any remnant concerns about the sustainability of debt to GDP: “It’s the type of thing that should keep people awake at nightshe said.

With good reason:

After all the debt burden has never been higher and rates, following years of enabling the largest debt expansion in human history, are starting to rise in the US. In the larger historic context rates are still low, but let’s be clear, they are rising:

And with rising rates come questions of the sustainability of servicing incredibly high debt loads.

The worldwide equity rally since the early 2016 lows has resulted in a massive increase in the market capitalization of global asset prices which have increased by over $25 trillion in value since then. As discussed in my 2017 Market Lessons US market capitalization is now north of 143% of US GDP.

Low rates and free money in form of global QE and now US tax cuts make it all possible and consequence free. But is it?

Let’s take a look at the leveraging game over the past 2 years since this is when the most recent rally began. And note in many cases we don’t have full 2017 data yet so I’m using the running 2 year data where I can pull it. The trend is the same: Up, up and away.

…click on the above link to read the rest of the article…

Abracadabra


And so, as they say in the horror movies, it begins…! The unwinding of the Federal Reserve’s balance sheet. Such an esoteric concept! Is there one in ten thousand of the millions of people who sit at desks all day long from sea to shining sea who have a clue how this works? Or what its relationship is to the real world?

I confess, my understanding of it is incomplete and schematic at best — in the way that my understanding of a Las Vegas magic act might be. All the flash and dazzle conceals the magician’s misdirection. The magician is either a scary supernatural being or a magnificent fraud. Anyway, the audience ‘out there’ for the Federal Reserve’s magic act — x-million people preoccupied by their futures slipping away, their cars falling apart, their kid’s $53,000 college loan burden, or the $6,000 bill they just received for going to the emergency room with a cut finger — wouldn’t give a good goddamn even if they knew the Fed’s magic show was going on.

So, the Fed has this thing called a balance sheet, which is actually a computer file, filled with entries that denote securities that it holds. These securities, mostly US government bonds of various categories and bundles of mortgages wrangled together by the mysterious government-sponsored entity called Freddie Mac, represent about $4.5 trillion in debt. They’re IOUs that supposedly pay interest for a set number of years. When that term of years expires, the Fed gets back the money it loaned, which is called the principal. Ahhhh, here’s the cute part!

You see, the money that the Fed loaned to the US government (in exchange for a bond) was never there in the first place. The Fed prestidigitated it out of an alternate universe.

…click on the above link to read the rest of the article…

Stranger Things

     The hidden agenda in the so-called tax reform bill is to act as stop-gap quantitative easing to plug the “liquidity” hole that is opening up as the Federal Reserve (America’s central bank) makes a few gestures to winding down its balance sheet and “normalizing” interest rates. Thus, the aim of the tax bill is to prop up capital markets, and the apprehension of this lately is what keeps stocks making daily record highs. Okay, sorry, a lot to unpack there.

Primer: quantitative easing (QE) is a the Federal Reserve’s weasel phrase for its practice of just creating “money” out of thin air, which it uses to buy US Treasury bonds (and other stuff). The Fed buys this stuff through intermediary Too Big To Fail banks which allows them to cream off a cut and, theoretically, pump the “money” into the economy. This “money” is the “liquidity.” As it happens, most of that money ends up in the capital markets. Stocks go up and up and bond yields stay ultra low with bond prices ultra high. What remains on the balance sheets are a shit-load of IOUs.

The third round of QE was officially halted in 2014 in the USA. However, the world’s other main central banks acted in rotation — passing the baton of QE, like in a relay race — so that when the US slacked off, Japan, Britain, the European Central Bank, and the Bank of China, took over money-printing duties. And because money flies easily around the world via digital banking, a lot of that foreign money ended up in “sure-thing” US capital markets (as well as their own ). Mega-tons of “money” were created out of thin air around the world since the near-collapse of the system in 2008.

…click on the above link to read the rest of the article…

Bank of Japan Tapers (Quietly), QE Party Over

Bank of Japan Tapers (Quietly), QE Party Over

No flashy announcement, to avoid alarming the markets.

After years of blistering asset purchases, the Bank of Japan disclosed today that it held a total of ¥521.6 trillion in assets as of November 30, including Japanese Government Bonds (JGBs), gold, corporate bonds, Japanese REITs, equity ETFs, loans, etc. That is quite a pile, so to speak. It amounts to about 96% of Japan’s GDP.

By this measure, the BOJ’s balance sheet dwarfs the Fed’s balance sheet, which amounts to 23% of US GDP. When it comes to QE, no one can hold a candle to Japan. Its holdings of JGBs alone rose to ¥443.6 trillion. Its balance sheet looks like a typical post-Financial-Crisis central-bank balance sheet on steroids (chart in trillion yen):

There a couple of differences compared to other central banks: One, the BOJ started QE long before anyone even called it “QE,” but in 2013, it really got going, and those giant moves made the prior periods of QE look minuscule. And two, the BOJ actually unwound some of its earlier QE starting in late 2005 but soon gave up on it.

Now something else has been happening: Starting in December 2016 – the month the Fed raised rates and a few months after some Fed governors started to kick around the idea publicly that QE should be unwound – the BOJ began to curtail its asset purchases.

In other words, it began to “taper.” Assets are still increasing but at a much slower rate. During peak QE – the 12-month period ending December 31, 2016 – it added ¥93.4 trillion (about $830 billion) to its balance sheet. Over the 12-month period ending November 30, 2017, it has added “only” ¥50.8 trillion to its balance sheet. Though that’s still a good chunk of money (about $450 billion), that addition is down 46%.

This chart shows the 12-month change in the balance sheet in trillion yen, going back to the Financial Crisis:

…click on the above link to read the rest of the article…

Bank Of America Analyst: A ‘Flash Crash’ In Early 2018 ‘Seems Quite Likely’

Bank Of America Analyst: A ‘Flash Crash’ In Early 2018 ‘Seems Quite Likely’

Is the stock market bubble about to burst?  I know that I have been touching on this theme over and over and over again in recent weeks, but I can’t help it.  Red flags are popping up all over the place, and the last time so many respected experts were warning about an imminent stock market crash was just before the last major financial crisis.  Of course nobody can guarantee that global central banks won’t find a way to prolong this bubble just a little bit longer, but at this point they are all removing the artificial support from the markets in coordinated fashion.  Without that artificial support, it is inevitable that financial markets will experience a correction, and the only real question is what the exact timing will be.

For example, Bank of America’s Michael Hartnett originally thought that the coming correction would come a bit sooner, but now he is warning of a “flash crash” during the first half of 2018

Having predicted back in July that the “most dangerous moment for markets will come in 3 or 4 months“, i.e., now, BofA’s Michael Hartnett was – in retrospect – wrong (unless of course the S&P plunges in the next few days). However, having stuck to his underlying logic – which was as sound then as it is now – Hartnett has not given up on his “bad cop” forecast (not to be mistaken with the S&P target to be unveiled shortly by BofA’s equity team and which will probably be around 2,800), and in a note released overnight, the Chief Investment Strategist not only once again dares to time his market peak forecast, which he now thinks will take place in the first half of 2018, but goes so far as to predict that there will be a flash crash “a la 1987/1994/1998” in just a few months.

That certainly sounds quite ominous.

…click on the above link to read the rest of the article…

The Last Time These 3 Ominous Signals Appeared Simultaneously Was Just Before The Last Financial Crisis

The Last Time These 3 Ominous Signals Appeared Simultaneously Was Just Before The Last Financial Crisis

We have not seen a “leadership reversal”, a “Hindenburg Omen” and a “Titanic Syndrome signal” all appear simultaneously since just before the last financial crisis.  Does this mean that a stock market crash is imminent?  Not necessarily, but as I have been writing about quite a bit recently, the markets are certainly primed for one.  On Wednesday, the Dow fell another 138 points, and that represented the largest single day decline that we have seen since September.  Much more importantly, the downward trend that has been developing over the past week appears to be accelerating.  Just take a look at this chart.  Could we be right on the precipice of a major move to the downside?

John Hussman certainly seems to think so.  He is the one that pointed out that we have not seen this sort of a threefold sell signal since just before the last financial crisis.  The following comes from Business Insider

On Tuesday, the number of New York Stock Exchange companies setting new 52-week lows climbed above the number hitting new highs, representing a “leadership reversal” that Hussman says highlights the deterioration of market internals. Stocks also received confirmation of two bearish market-breadth readings known as the Hindenburg Omen and the Titanic Syndrome.

Hussman says these three readings haven’t occurred simultaneously since 2007, when the financial crisis was getting underway. It happened before that in 1999, right before the dot-com crash. That’s not very welcome company.

In fact, every time we have seen these three signals appear all at once there has been a market crash.

Will things be different this time?

We shall see.

If you are not familiar with a “Hindenburg Omen” or “the Titanic Syndrome”, here are a couple of pretty good concise definitions

…click on the above link to read the rest of the article…

This Is What A Pre-Crash Market Looks Like

This Is What A Pre-Crash Market Looks Like

The only other times in our history when stock prices have been this high relative to earnings, a horrifying stock market crash has always followed.  Will things be different for us this time?  We shall see, but without a doubt this is what a pre-crash market looks like.  This current bubble has been based on irrational euphoria that has been fueled by relentless central bank intervention, but now global central banks are removing the artificial life support in unison.  Meanwhile, the real economy continues to stumble along very unevenly.  This is the longest that the U.S. has ever gone without a year in which the economy grew by at least 3 percent, and many believe that the next recession is very close.  Stock prices cannot stay completely disconnected from economic reality forever, and once the bubble bursts the pain is going to be unlike anything that we have ever seen before.

If you think that these ridiculously absurd stock prices are sustainable, there is something that I would like for you to consider.  The only times in our history when the cyclically-adjusted return on stocks has been lower, a nightmarish stock market crash happened soon thereafter

The Nobel-Laureate, Robert Shiller, developed the cyclically-adjusted price/earnings ratio, the so-called CAPE, to assess whether stocks are likely to be over- or under-valued. It is possible to invert this measure to obtain a cyclically-adjusted earnings yield which allows one to measure prospective real returns. If one does this, the answer for the US is that the cyclically-adjusted return is now down to 3.4 percent. The only times it has been still lower were in 1929 and between 1997 and 2001, the two biggest stock market bubbles since 1880. We know now what happened then. Is it going to be different this time?

…click on the above link to read the rest of the article…

Mind the Junk—-This Ain’t Your Grandfather’s Capitalism

Mind the Junk—-This Ain’t Your Grandfather’s Capitalism

The financial system is loaded with anomalies, deformations and mispricings—-outcomes which would never occur on an honest free market. For example, the junk bond yield at just 2% in Europe is now below that of the “risk-free” US treasury bond owing solely to the depredations of the ECB.

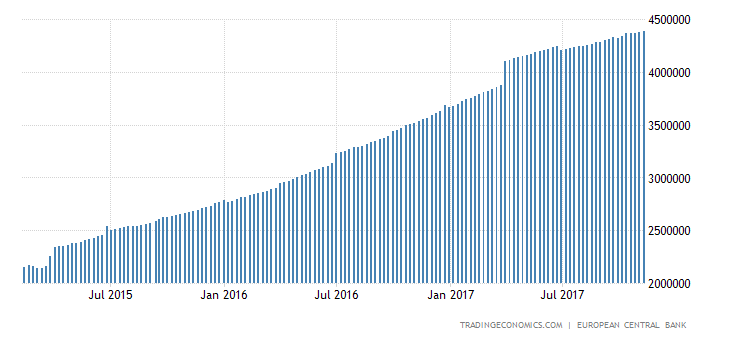
Indeed, madman Draghi has purchased $2.6 trillion of securities since launching QE in March 2015, and during the interim has actually bought more government debt than was issued by all the socialist governments of the EU-19 combined!

Euro Area Central Bank Balance SheetOutrunning Europe’s deficit-addicted welfare states is quite a feat in itself, but that wasn’t the half of it. The ECB’s printing press became so parched for government debt to buy that it has ended up owning more than $120 billion of corporate bonds. In some recent cases, the ECB has actually taking down 20% or more of new corporate issues—an action that surely leaves the fastidious founders of its Bundesbank prodecessor turning in their graves.

In turn, the ECB’s Big Fat Thumb on the investment grade scale stampeded fund managers into the junk market in quest of yield, especially for BB rated paper which makes up 75% of the European high yield market. So doing, these return hungry managers have crushed the the yield on the Merrill Lynch junk bond index, driving it down from 6.4% in early 2106 to an incredible 2.002% last week.

That is to say, leveraged speculators in European junk have made 100% plus returns over the last 20 months on dodgy paper that should be yielding double or triple its current rate.

In fact, the current lunatic euro-trash yield is completely off the historical charts. Euro-junk rarely yielded under 5% in the past, and had spiked to upwards of 10% at the time of Draghi’s “whatever it takes” ukase, which, in turn, was modest compared to the 25% blow-0ff high during the depths of the financial crisis.

…click on the above link to read the rest of the article…

The Federal Reserve Has Just Given Financial Markets The Greatest Sell Signal In Modern American History

The Federal Reserve Has Just Given Financial Markets The Greatest Sell Signal In Modern American History

Why have stock prices risen so dramatically since the last financial crisis?  There are certainly many factors involved, but the primary one is the fact that the Federal Reserve has been creating trillions of dollars out of thin air and has been injecting all of that hot money into the financial markets.  But now the Federal Reserve is starting to reverse course, and this has got to be the greatest sell signal for financial markets in modern American history.  Without the artificial support of the Federal Reserve and other global central banks, there is no possible way that the massively inflated asset prices that we are witnessing right now can continue.

The chart below comes from Sven Henrich, and it does a great job of demonstrating the relationship between the Fed’s quantitative easing program and the rise in stock prices.  During the last financial crisis the Fed began to dramatically increase the size of our money supply, and they kept on doing it all the way through the end of October 2017…

Unfortunately for stock traders, the Federal Reserve has now decided to change course, and that means that the process that has created these ridiculous stock prices is beginning to go in reverse.  In fact, according to Wolf Richter this reversal just started to go into motion within the past few days…

On October 31, $8.5 billion of Treasuries that the Fed had been holding matured. If the Fed stuck to its announcement, it would have reinvested $2.5 billion and let $6 billion (the cap for the month of October) “roll off.” The amount of Treasuries on the balance sheet should then have decreased by $6 billion.

…click on the above link to read the rest of the article…

The Swiss National Bank Now Owns A Record $88 Billion In US Stocks

The Swiss National Bank Now Owns A Record $88 Billion In US Stocks

In the third quarter of 2017, one in which the global economy was supposedly undergoing a unprecedented “coordinated growth spurt”, and in which central banks were preparing to unveil their QE tapering intentions, in the case of the ECB, or raising rates outright, at the Fed, what was really taking place was another central bank buying spree meant to boost confidence that things are now back to normal, using “money” freshly printed out of thin air, and spent to prop up risk assets around the world by recklessly buying stocks with no regard for price or cost.

Nowhere was this more obvious than in the latest, just released 13F from the massive hedge fund known as the “Swiss National Bank.” What it showed is that, just like in the prior quarter, and the quarter before that, and on, and on, the Swiss central bank had gone on another aggressive buying spree and following its record purchases in the first quarter, the central bank boosted its total holdings of US stocks to an all time high $87.8 billion, up 4.2% or $3.5 billion from the $84.3 billion at the end of the second first quarter.

As reported earlier this week, as of Sept.30, the Swiss central bank had accumulated foreign exchange worth 760 billion francs (roughly the same in USD) due to its relentless open market interventions to depress the Swiss franc, and has “invested” those funds created out of thin air in both stocks and bonds. At the end of the second quarter, it held 20% in equities, of which the bulk was in US stocks.

…click on the above link to read the rest of the article…

For God’s Sake, Stop!

“Most economists, it seems, believe strongly in their own superior intelligence and take themselves far too seriously. In his open letter of 22 July 2001 to Joseph Stiglitz, Kenneth Rogoff identified this problem. ‘One of my favourite stories from that era is a lunch with you and our former colleague, Carl Shapiro, at which the two of you started discussing whether Paul Volcker merited your vote for a tenured appointment at Princeton. At one point, you turned to me and said, “Ken, you used to work for Volcker at the Fed. Tell me, is he really smart ?” I responded something to the effect of, “Well, he was arguably the greatest Federal Reserve chairman of the twentieth century.” To which you replied, “But is he smart like us ?”

  • Satyajit Das.

“..Every time a report lands on their desks, central bankers must stop to think about the economic, social and political havoc their policies have caused over the past 10 years.

“The desperate attempt to avoid deflation via quantitative easing and record-low interest rates has had horrible side effects, and this observation is hardly controversial. The rich have become much richer; corporate wealth has become more concentrated; soaring house prices have created intergenerational strife; low yields have made all but the super-rich paranoid that they will be entirely unable to finance their futures. Most markets have ended up overvalued (this will really matter one day), while pension fund deficits and a constant sense of crisis have discouraged capital investment — and have possibly held down wages in the UK.

“Set a target, get a distortion. This is standard stuff. But the fact that extreme monetary policy has been going on for so long means that central bankers do not just have macro problems to feel bad about.

…click on the above link to read the rest of the article…
Olduvai IV: Courage
Click on image to read excerpts

Olduvai II: Exodus
Click on image to purchase

Click on image to purchase @ FriesenPress