Home » Posts tagged 'gdp' (Page 14)

Tag Archives: gdp

Olduvai
Click on image to purchase

Olduvai III: Catacylsm
Click on image to purchase

Post categories

Post Archives by Category

This Will Be Largest Evaporation of Wealth in Modern History

This Will Be Largest Evaporation of Wealth in Modern History

It’ll devastate China’s economy and reverberate around the world

Only a handful of countries have a higher savings rate than the Chinese do. For a still relatively poor emerging country with GDP per capita about a fifth of that in the U.S., the Chinese get an A+ in this area.

But if diversification and asset allocation are the key to preserving wealth, then the Chinese get an F!

The reason: 75% of their wealth is in real estate. They’ve overinvested in one illiquid and bubbly asset that they wrongly believe can only go higher. Relative to income, China has seven of the 10 most expensive cities in the world.

In other words, it has the greatest real estate bubble in modern history!

Price to income ratios in the top cities are off the charts. Beijing is 33.5 times income, Shanghai is 30.2 and Shenzhen is 30.0. The average condo in such tier I cities is only 650 square feet and would go for $460 per square foot, or $300,000. In a tier II city, we’re talking $100,000.

That may not sound like a lot, but the average Chinese are only making about $10,000 per year! That begs the question: how do they even do it on their incomes!?

Wade Shepard went after this question in a recent Forbes article. In China, owning your home is paramount. If you’re a man, you have zero chance of getting a date if you don’t. But with home prices running at exorbitant rates, what are their chances?

It all comes back to China’s phenomenally high savings rate. Compared with about 2% in the U.S., the Chinese on average save about 30% of their income. And for the most affluent, it’s more than double that!

…click on the above link to read the rest of the article…

Can We Grow Out Of Our Problems If We’re Not Actually Growing?

The rationale for today’s easy money policies is pretty straightforward: Falling interest rates and rising government deficits will counteract the drag of excessive debts taken on in previous stimulus programs and asset bubbles, enabling the developed world to create wealth faster than it takes on new debt. The result: a steady decline in debt/GDP to levels that allow the current system to survive without wrenching changes.

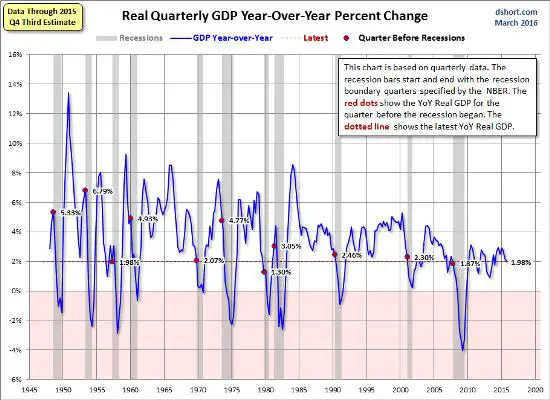
That’s a seductive, free-lunchy kind of idea — if it actually worked. But as the following chart of historical US GDP growth illustrates, as we’ve taken on more and more debt, each successive stimulus program has generated less and less growth. Compare the past few years to the rip-roaring recoveries of the 1960s through 1990s and it’s clear that whatever mechanism once converted easy money into greater wealth is no longer operating.

GDP April 16

And note that the 2% recent growth on the above chart doesn’t include the revision of Q4 2015 growth to only 1.4%, and the Atlanta Fed’s GDPNow projection of 0.4% growth for 2016’s first quarter.

GDPNow April 16

It’s the same story pretty much everywhere else. Japan, for instance:

Japan GDP April 16

Now the question becomes, how does the US and the rest of the world “grow out of its debt” if it can’t grow at all? Won’t the steady accretion of debt at every level of every society go parabolic in a zero-growth world? The answer is that mathematically speaking, this appears to be unavoidable.

So what will we do? More of the same of course:

OECD Calls for Urgent Increase in Government Spending

(Wall Street Journal) – Governments in the U.S., Europe and elsewhere should take urgent and collective steps to raise their investment spending and deliver a fresh boost to flagging economic growth, the Organization for Economic Growth and Development said Thursday.

…click on the above link to read the rest of the article…

Western Mistakes, Remade in China

Western Mistakes, Remade in China

SHANGHAI – The Chinese economy faces an enormously challenging transition. To achieve its goal of joining the world’s high-income countries, the government has rightly urged a “decisive role for the market.” But, while market competition works well in many sectors, banking is different. Indeed, over the last seven years, China’s reliance on bank-based capital allocation has led to the same mistakes that caused the 2008 financial crisis in the advanced economies.

Rapid GDP growth requires high savings and investment, and high savings almost never result from free consumer choice. States can directly finance investment, but bank credit creation can achieve the same effect. As Friedrich Hayek put it in 1925, rapid capitalist growth depended on “the ‘forced savings’ effected by the extension of additional bank credit.”

Shanghai skylineThe Contradictions of Chinese Capitalism

Introducing PS On Point.
Making sense of a world of conflict and conflicting ideas.

Japan and South Korea both used bank credit to finance high levels of investment in their periods of rapid growth. South Korea’s nationalized banks directly funded export-oriented companies. In Japan, private banks were “guided” toward the tradable sector.

But while governments dictated broad sectoral priorities, banks decided the firm-by-firm allocation and extended credit via loan contracts, which imposed financial discipline. If Japan and South Korea had instead used direct government finance, capital allocation would almost certainly have been worse.

But while Japan’s banking system helped drive stunning post-war growth, its credit-fueled real-estate boom in the 1980s and subsequent bust led to 25 years of slow growth and creeping deflation. The global financial crisis of 2008 and subsequent post-crisis malaise replicated the Japanese experience in many other countries.

As economies get richer, they become more real-estate intensive. That is partly because people devote a rising share of their income to competing for property in more attractive locations, and partly because in service-intensive economies, high-value-added activities and talent cluster in dominant cities.

…click on the above link to read the rest of the article…
Canada due for debt crisis and recession, economist argues

Canada due for debt crisis and recession, economist argues

Credit growth has to stop at some point, and then economy shrinks, argues Steve Keen

Finance Minister Bill Morneau has just delivered a budget that will put Canada deeper in debt. A Forbes columnist argues that puts Canada on track for a credit crisis.

Finance Minister Bill Morneau has just delivered a budget that will put Canada deeper in debt. A Forbes columnist argues that puts Canada on track for a credit crisis. (Sean Kilpatrick/Canadian Press)

An economist writing for Forbes magazine has tapped Canada as one of seven countries in the world that are due for a debt crisis and an ensuing recession in the next one to three years.

The trigger will be too much credit, with companies and individuals discouraged from borrowing because their debt is too high and banks then balk at lending, said Steve Keen, head of the school of economics, politics and history at Kingston University London.

A critic of conventional economics, he argues that economists failed to anticipate the global financial crisis of 2008 because they ignored the phenomenon of banks lending too much money.

That’s the situation Canada is approaching now, along with China, Australia, Sweden, Hong Kong, Korea and Norway, he writes in “The seven countries most vulnerable to a debt crisis.”

“Timing precisely when these countries will have their recessions is not possible, because it depends on when the private sector’s willingness to borrow from the banks — and the banking sector’s willingness to lend — stops,” he writes.

Government stimulus programs and programs to support first-time home buyers can postpone the pain, he argues, but credit cannot keep growing at such a rapid rate, unless GDP is growing more rapidly.

Soon to be ‘walking wounded’

“When it arrives, these countries — many of which appeared to avoid the worst of the crisis in 2008 — will join the world’s long list of walking wounded economies,” Keen says.

…click on the above link to read the rest of the article…

Bad — But Better Than What’s Coming

Talk about diminished expectations. This morning’s estimate of 1.4% Q4 GDP growth is being hailed as a pleasant surprise. Which is odd, considering that for most of the past century a number this low would have been seen as weak enough to require emergency action.

And that’s just the headline number. Dig a little deeper and the picture — at least when viewed through a non-Keynesian lens — is of a system in crisis. Consider:

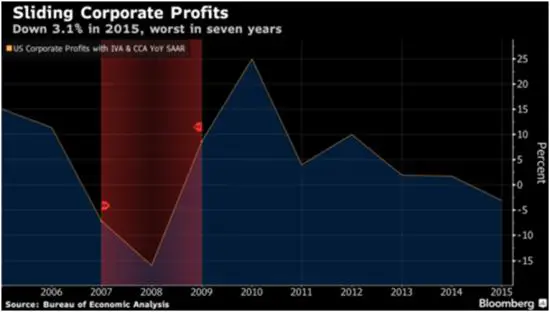
Corporate profits are, as today’s Bloomberg puts it, sliding.

Corp profits March 16

Meanwhile (also from Bloomberg),

A firm labor market and low inflation encourage households to keep shopping. Today’s fourth-quarter growth figure reflected more spending on services, particularly on recreation and transportation. “It’s really U.S. consumers who are powering the global economy forward at this point,” said Gus Faucher, an economist at PNC Financial Services Group Inc. in Pittsburgh.

But if companies are earning less money, how likely is it that they’ll step up hiring going forward? Not very. And since today fewer Americans have full time jobs than in 2007 (making the current stellar 4.9% unemployment rate look like a cruel joke) a new round of mass layoffs will make the job market even more dire for anyone hoping to support a family with full-time work.

“If profits remain depressed, the prospects for capex and hiring will come under greater pressure,” Sam Bullard, a senior economist at Wells Fargo Securities LLC in Charlotte, North Carolina, wrote in a research note.

What are the chances of profits remaining depressed? Pretty good, considering that two of the big growth drivers of the past few years have been student debt and car loans. The former is, as everyone by now knows, at levels that consign a whole generation of kids to life in their parents’ basements — not a recipe for robust consumption.

…click on the above link to read the rest of the article…

What Killed the Middle Class?

What Killed the Middle Class?

If the four structural trends highlighted below don’t reverse, the middle class is heading for extinction. 

Everyone knows the middle class is fading fast. I’ve covered this issue in depth for years, for example: Honey, I Shrunk the Middle Class: Perhaps 1/3 of Households Qualify (December 28, 2015) and What Does It Take To Be Middle Class? (December 5, 2013)

This raises an obvious question: what killed the middle class? While many commentators try to identify one killer cause (for example, the U.S. going off the gold standard in 1971), the die-off of the middle class is more akin to the die-off in honey bees, which is the result of the interaction of multiple causes (factors that increase the toxic load dumped on bees and other pollinators by modern agriculture).

Longtime collaborator Gordon T. Long and I discuss the decline of the middle class and other key topics in a new 29-minute video How did that work out for you?

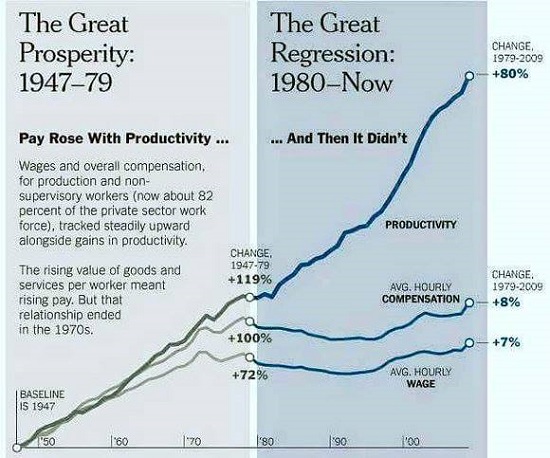
So where do we begin this detective story? With the engine of all real prosperity, productivity. This chart reveals that wages stopped rising with productivity around 1980.

Here’s another look at the same phenomenon:

Productivity has been slipping since around 2003: Alan Greenspan:”Productivity is Dead”

Cause #1: declining productivity, which means the pie of real wealth is no longer expanding.

Exhibit #2: middle class wage earners have not received any of the gains.Wages as a percentage of GDP have been falling for decades, with occasional blips up in tech/housing bubbles:

Inflation-adjusted household income has dropped back to levels first reached in the 1980s:

…click on the above link to read the rest of the article…

Remember the people involved

Remember the people involved

People_in_waders_and_boots_working_to_restore_a_pondWhen I was in University, I vividly remember one of my economics professors telling students to always remember the people involved when analyzing a policy change. I was reminded of this sage advice upon reading Matthew McCaffery’s Mises Daily article titled, Who will pay for it?” is the wrong question to ask politicians. McCaffery’s point is the question often focuses too much on the question of who and how to pay which distracts from more important issues such as what is being paid for? I would add to that, who is being paid? By emphasizing the basic problem of finding the money, what is sometimes overlooked is the problem of whether new government programs will actually work of whether they will be wasteful and counterproductive, and who the tax consumers are.

Asking questions such as “who will pay for it?” and “what, specifically, is being paid for?” are particularly pertinent given the federal budget is to be unveiled today.   Early reportssuggest cumulative budget deficits over the next two years will be well above $50 billion (about 1.3% of GDP). The question, “who will pay for it?” is answered quickly as the federal government has only three sources of revenue: current taxpayers, future taxpayers and increasing the money supply (inflation) by selling bonds to the Bank of Canada.

The consequences of higher taxes and more inflation doesn’t seem to faze many people, including some well-known economists in Canada. Doug Bandow observed that left-wing activists tend to favor corporate taxation. They imagine a society divided between businesses and people. However, firms are owned by people, employ people, sell to people, and contract with people. Taxing companies means taxing people.

…click on the above link to read the rest of the article…

Ed Butowsky: Calculating The True Cost of Living

Ed Butowsky: Calculating The True Cost of Living

Why it’s much higher than we’re told/sold 

Over the past decade, we’ve been told that inflation has been tame — actually below the target the Federal Reserve would like to see. But if that’s true, then why does the average household find it harder and harder to get by?

The ugly reality is that the true annual cost of living is far outpacing the government’s reported inflation rate. By nearly 10x in many parts of the country.

This week, we welcome Ed Butowsky, developer of the Chapwood Index, to the program. His index is a ‘real world’ measure of how prices are increasing much faster than the wages of the 99% can afford:

In my business, I wanted to make sure that I was building portfolios that weren’t just efficient but got people the rate of return that they needed. I thought: My goodness, what I need to do is give people a list of everything they spend money on and have them track quarter by quarter exactly their increases, so I can do a better job as a financial advisor in determining what return I need to target. 

I got a hold of a list of 50 major metropolitan areas and found people in every city and I gave them a job: I asked everybody to send me what items they spend their after-tax dollars on. I got about 4,000 different items. Then I took the 500 that most frequently appeared on the list and we’ve been tracking specifically these same items in every city since that period of time. I weight this list based on what percentage of a normal income people spend on each item.

…click on the above link to read the rest of the article…
Why This Sucker Is Going Down——The Case Of Japan’s Busted Bond Market

Why This Sucker Is Going Down——The Case Of Japan’s Busted Bond Market

The world financial system is booby-trapped with unprecedented anomalies, deformations and contradictions. It’s not remotely stable or safe at any speed, and most certainly not at the rate at which today’s robo-machines and fast money traders pivot, whirl, reverse and retrace.

Indeed, every day there are new ructions in the casino that warn investors to get out of harm’s way with all deliberate speed. And last night’s eruption in the Japanese bond market was a doozy.

The government of what can only be described as an old age colony sinking into certain bankruptcy sold 30-year bonds at an all-time low of 47 basis points. Let me clear here that we are talking about a record low not just for Japan but for the history of mankind.

To be sure, loaning any government 30-year money at 47 basis points is inherently a foolhardy proposition, but its just plain bonkers when it comes to Japan.

Here is its 30-year fiscal record in nutshell. Not withstanding years of chronic red ink and its recent 2014 consumption tax increase from 5% to 8%, Japan is still heading straight for fiscal oblivion. Last year (2015) it spent just under 100 trillion yen, but took in hardly 50 trillion yen of revenue, stacking the difference on its already debilitating mountain of public debt, which has now reached 240% of GDP.

That’s right. A government which is borrowing nearly 50 cents on every dollar of outlays should be paying a huge risk premium to even access the bond market. But a government with a 240% debt-to-GDP ratio peering into a demographic sinkhole would be hard pressed to borrow at any price at all on an honest free market.

…click on the above link to read the rest of the article…
The End of Globalization?

The End of Globalization?

BRUSSELS – China has just announced that last year, for the first time since it began opening up its economy to the world at the end of the 1970s, exports declined on an annual basis. And that is not all; in value terms, global trade declined in 2015. The obvious question is why.

While global trade also fell in 2009, the explanation was obvious: The world was experiencing a sharp contraction in GDP at the time. Last year, however, the world economy grew by a respectable 3%. Moreover, trade barriers have not risen significantly anywhere, and transport costs are falling, owing to the sharp decline in oil prices.

Tellingly, the so-called Baltic Dry Index, which measures the cost of chartering the large ships that carry most long-distance trade, has fallen to an all-time low. This indicates that markets do not expect a recovery, meaning that the data from 2015 could herald a new age of slowing trade. The obvious conclusion is that the once-irresistible forces of globalization are losing steam.

The situation in China is telling. In recent decades, as it became the world’s leading trading economy, China transformed the global trading system. Now the value of both imports and exports have fallen, though the former have declined more, owing to the collapse of global commodity prices.

In fact, commodity prices are the key to understanding trade trends over the last few decades. When they were high, they drove increased trade – to the point that the share of trade to GDP rose – fueling hype about the inevitable progress of globalization. But in 2012, commodity prices began to fall, soon bringing trade down with them.

…click on the above link to read the rest of the article…

Will Italian banks spark another financial crisis?

Will Italian banks spark another financial crisis?

Will Italian banks spark another financial crisis?

In the 14th century, the Medici family of Florence began its rise to prominence, investing profits from a thriving textile trade to fund what would become the largest banking institution in Europe.  The success of the legendary banking family helped to usher in the Italian Renaissance and thus change the world. Now, Italian banks seem poised to alter the world yet again.

Shares of Italy’s largest financial institutions have plummeted in the opening months of 2016 as piles of bad debt on their balance sheets become too high to ignore.  Amid all of the risks facing EU members in 2016, the risk of contagion from Italy’s troubled banks poses the greatest threat to the world’s already burdened financial system.

At the core of the issue is the concerning level of Non-Performing Loans (NPL’s) on banks’ books, with estimates ranging from 17% to 21% of total lending.  This amounts to approximately €200 billion of NPL’s, or 12% of Italy’s GDP.  Moreover, in some cases, bad loans make up an alarming 30% of individual banks’ balance sheets.

download

The red flags initially attracted the attention of the European Central Bank (ECB), prompting an official inquiry that investors viewed as a flashing ‘sell signal.’  Shares of Italian banking companies lost more than 25% in the first several weeks of the year.

Though markets have pared losses in the last few weeks, March has brought renewed concern for the health of Italy’s financial sector.  Adding more worries to fuel the fire, on Friday the ECB demanded that one such troubled Italian bank, Banca Carige SpA, provide new strategic plans and additional funding in order to bolster its balance sheet and meet supervisory requirements by the end of the month.  The news sent bank shares on yet another swoon, prompting trading halts on several as the volatility triggered maximum loss ‘circuit breakers.’

…click on the above link to read the rest of the article…

Alan Greenspan’s Pickled Economy

Former Federal Reserve Chairman Alan Greenspan resurfaced this week.  We couldn’t recall the last time we’d heard from him.  But, alas, the old fellow’s in desolate despair.

Alan-GreenspanUnexpectedly rising from the crypt: Alan Greenspan   Photo credit: AP

On Tuesday, for instance, he told Bloomberg he hasn’t been optimistic for “quite a while.”  Obviously, this is in contrast to the perennial Goldilocks attitude he had during the 1990s.  So what is it that has the Maestro playing a low dirge?

China, the dollar, Dodd-Frank, and associated unknowns are all part of his negative outlook.  But the long winter of his discontent is something else.  Greenspan said he “won’t be [optimistic] until we can resolve entitlement programs.”

Nobody wants to touch [entitlements].  But it is gradually crowding out capital investment and that is crowding out productivity and that is crowding out the standards of living,” said Greenspan.

Indeed, funding entitlement programs is becoming more burdensome by the year.  As a greater percentage of the economy’s GDP goes toward entitlement programs, a lesser percentage goes towards capital investment.  The effect of this negative feedback loop, as Greenspan infers, is quite simple.

ramirez-entitlement-cartoonAn enticing lure….   Cartoon by Michael Ramirez

Less capital investment leads to lower productivity.  Lower productivity leads to slower GDP growth.  Slower GDP growth leads to an economy that can’t keep pace with entitlement programs.  Thus, an even smaller percentage of GDP is, in turn, available for capital investment…to propel future growth.  And so on, and so forth.

1-SR-fed-spending-numbers-2012-p8-1-chart-8_HIGHRESA 2012 forecast of entitlement spending by the Heritage Foundation. This seems not exactly sustainable – click to enlarge.

What Drives Economic Growth?

Certainly, this is a basic insight.  But perhaps Greenspan is on to something much larger than just the issue of entitlement programs.  From what we can tell he’s getting at the question of economic growth.  Namely, what drives it?

…click on the above link to read the rest of the article…


Why Globalization Reaches Limits

Why Globalization Reaches Limits

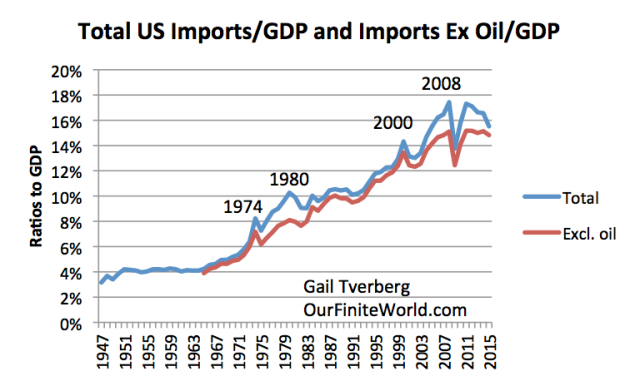
Figure 1. Ratio of Imported Goods and Services to GDP. Based in FRED data for IMPGS.

Figure 1. Ratio of Imported Goods and Services to GDP. Based in FRED data for IMPGS.

Each time imported goods and services start to surge as a percentage of GDP, these imports seem to be cut back, generally in a recession. The rising cost of the imports seems to have an adverse impact on the economy. (The imports I am showing are gross imports, rather than imports net of exports. I am using gross imports, because US exports tend to be of a different nature than US imports. US imports include many labor-intensive products, while exports tend to be goods such as agricultural goods and movie films that do not require much US labor.)

Recently, US imports seem to be down. Part of this reflects the impact of surging US oil production, and because of this, a declining need for oil imports. Figure 2 shows the impact of removing oil imports from the amounts shown on Figure 1.

Figure 2. Total US Imports of Goods and Services, and this total excluding crude oil imports, both as a ratio to GDP. Crude oil imports from https://www.census.gov/foreign-trade/statistics/historical/petr.pdf

Figure 2. Total US Imports of Goods and Services, and this total excluding crude oil imports, both as a ratio to GDP. Crude oil imports from https://www.census.gov/foreign-trade/statistics/historical/petr.pdf

If we look at the years from 2008 to the present, there was clearly a big dip in imports at the time of the Great Recession. Apart from that dip, US imports have barely kept up with GDP growth since 2008.

Let’s think about the situation from the point of view of developing nations, wanting to increase the amount of goods they sell to the US. As long as US imports were growing rapidly, then the demand for the goods and services these developing nations were trying to sell would be growing rapidly.

…click on the above link to read the rest of the article…

GDP Declines When Govt. Grows — This is Basic Common Sense

Armey Curve

A reader has contributed these charts that demonstrate why the socialist agenda is destroying the world. As the reader points out: “It seems that the optimal govt spending (share) is max 35% (US, AUS), and not >50% like in Europe. Lower govt expenditure has doubled GDP at least in the recent history.” The socialists refuse to listen simply because they are greedy. If you earn $1,000 and your rent if $200, your disposable income is $800. If government demands 10%, you have $720 to spend; if government demands 50%, you have $400. This is why we call them “public servants” for they consume wealth; they do not produce it.
OECD Debt Growth
The OECD has done studies but nobody ever pays attention. Any way you cut it, the larger the share of the economy consumed by the government, the lower the economic growth. So the sublime fool never looks at the data and simply regurgitates the same socialist propaganda into infinity. They live in a state of total denial simply because the core of their position is sheer material jealousy. They justify robbing other people because they lack the wealth they wish they had. It is just a question of greed.

How Italy will fail and drag down the European Project

How Italy will fail and drag down the European Project

Greece, Portugal and Ireland were mere test subjects for what will come. Spain would have been a challenge, but were narrowly avoided. Italy will drag the whole structure down if it continues on its current trajectory, and there is nothing to suggest it will change course.

The main problem for Italy is its stagnating level of nominal GDP, which we refer to as “Japanificaton” of the economy. While people usually think of deflation when they hear “Japan”, that is not an entirely correct observation. It is true that nominal GDP flat lined after the crisis in the 1990s which dragged down revenue. However, if it was truly a deflationary period, expenditures should fall also as prices paid for services rendered would drop concomitantly. This has not been the case and it is more correct to say Japan has been trapped in a revenue / NGDP deflation, hence the perceived need for Abenomics, or in plain English, the creation of a helluva lot of currency units to boost NGDP and revenue and thus reduce the need for bond issuance. As our first chart show, so far it has been modestly successful. Please note that Abenomics have nothing to do with creating real prosperity (no one can be that ignorant), but all about getting the spiraling debt problem under control by jacking up the inflation tax.Italy 1

…click on the above link to read the rest of the article…

Olduvai IV: Courage
Click on image to read excerpts

Olduvai II: Exodus
Click on image to purchase

Click on image to purchase @ FriesenPress