Why Recession Is Imminent, In Three Charts
Any one of these would be enough to make the case
The idea that the world’s central banks can inflate the biggest financial bubble in human history — appropriately called the everything bubble — and then deflate it gently into a soft landing is mathematically and philosophically impossible. So the question is not if but when we get a bust that’s commensurate with the boom.
Based on the following three indicators, that bust is imminent.
Massively inverted yield curve
When short-term interest rates rise above long-term rates, a slowdown usually follows. That’s because traditional banks (though not necessarily the monstrous hedge funds that the biggest banks have evolved into) make most of their money by borrowing short and lending long. In normal times, long-term rates are higher than short-term, reflecting the higher risk of lending into the distant future, so the spread between a bank’s borrowing and lending rates produces a nice spread, which translates into a decent profit.
Invert the yield curve by pushing short-term rates above long-term rates, and this business model breaks down. Banks stop making suddenly-unprofitable loans, their customers have less money to spend and invest, and the economy shrinks.
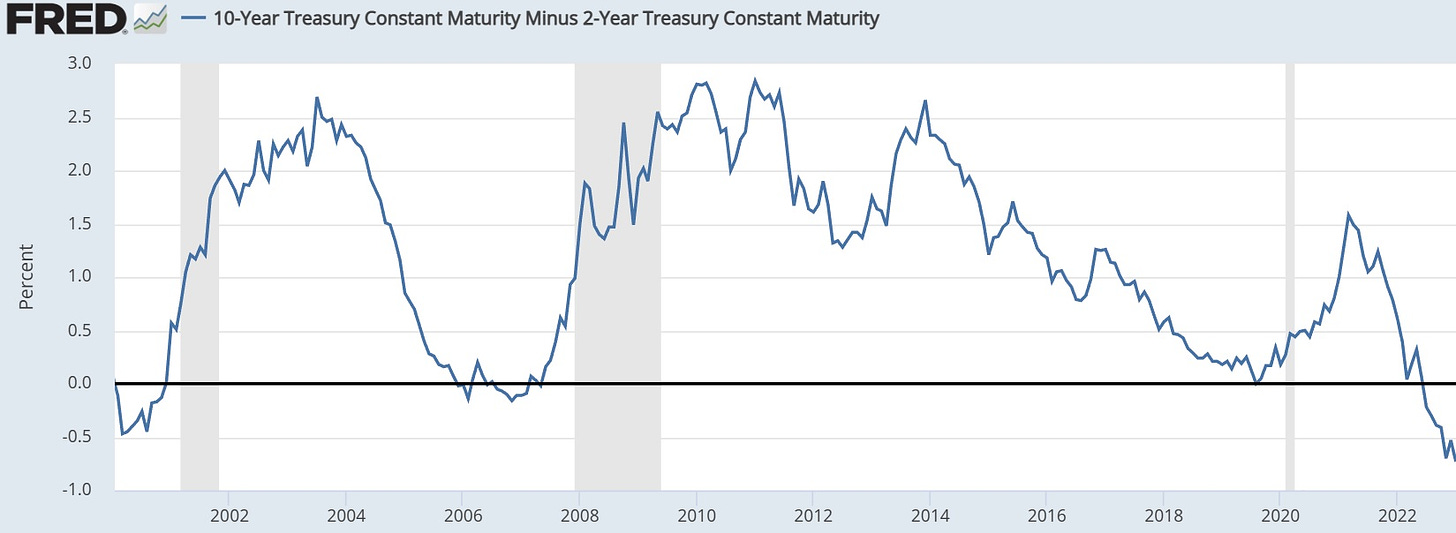
Note two things on the following chart, which depicts the spread between 10-year and 2-year Treasury bond yields. First, when this spread went slightly negative (i.e., 2-year rates higher than 10-year) in 2000 and 2007, recession followed within a year or so. Second, today’s yield curve is a lot more than slightly negative. It is, in fact, one for the record books, implying that the credit markets expect a dramatic slowdown.

Shrinking money supply
A Ponzi scheme needs ever-greater amounts of money flowing in to avoid collapse. Today’s global economy is a classic example of a Ponzi scheme. Therefore, it needs an increasing money supply to function.
…click on the above link to read the rest…