September Non-OPEC Oil Production Slips
Below are a number of oil, crude plus condensate (C + C ), production charts for Non-OPEC countries created from data provided by the EIA’s International Energy Statistics and updated to September 2021. Information from other sources such as OPEC, the STEO and country specific sites such as Russia, Brazil, Norway and China is used to provide a short term outlook for future output and direction for a few countries and the world.

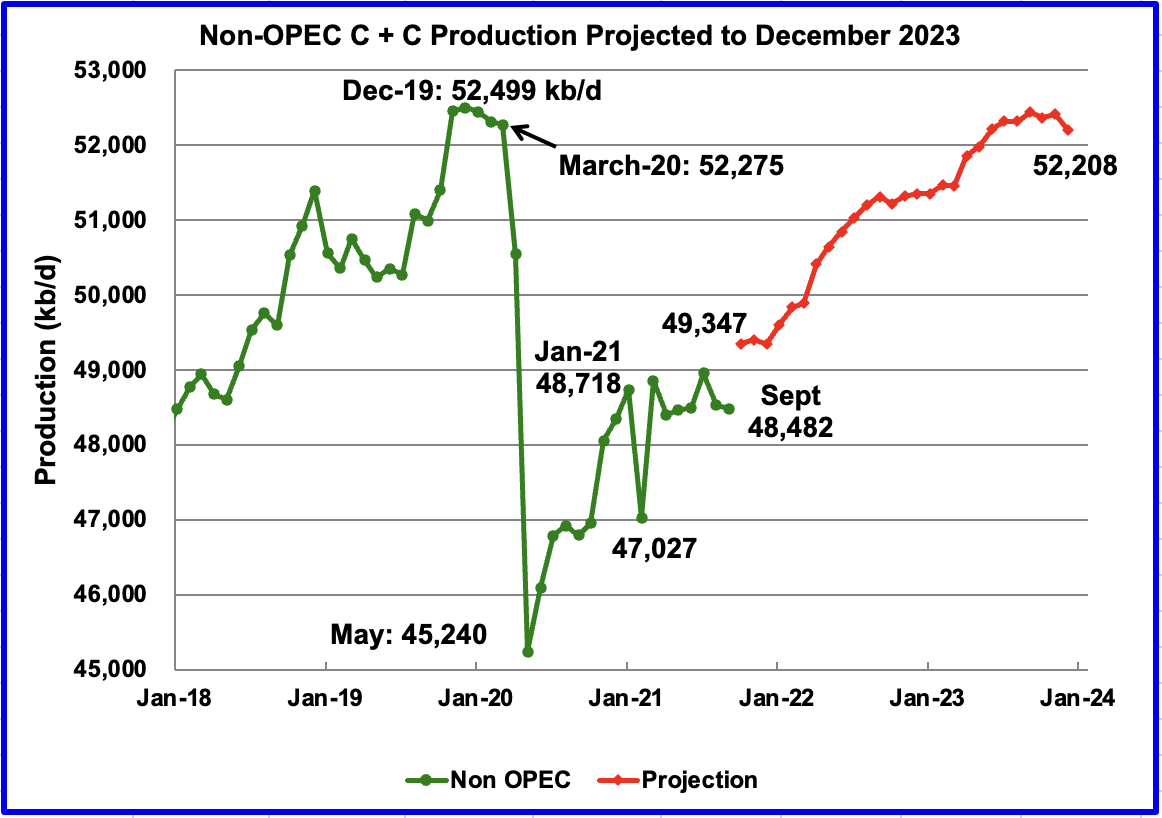
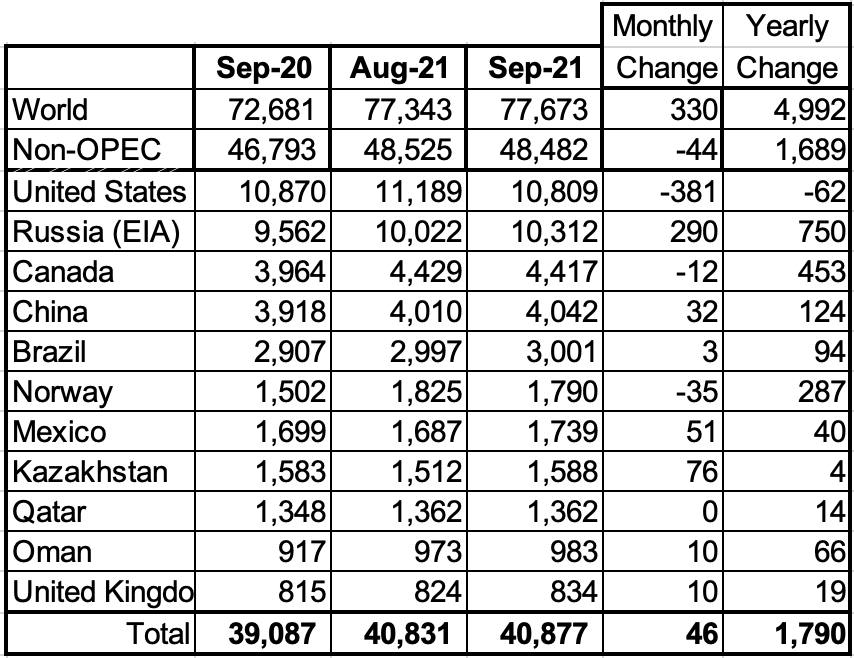
September Non-OPEC production declined by 44 kb/d to 48,482 kb/d. The biggest changes in production occurred in the US, -381 kb/d and Russia, +290 kb/d.
Using data from the January 2022 STEO, a projection for Non-OPEC oil output was made for the time period October 2021 to December 2023 (Red graph). Output is expected to reach 52,208 kb/d in December 2023, which is 291 kb/d lower than the December 2019 pre-covid peak of 52,499 kb/d.
Output in October is expected to rebound to 49,347 kb/d, an increase of 865 kb/d. The majority of the 865 kb/d increase will come from the recovery of US production in October, 651 kb/d, and close to 250 kb/d from OPEC.

Above are listed the world’s 11th largest Non-OPEC producers. The original criteria for inclusion in the table was that all of the countries produced more than 1,000 kb/d. The last two have currently fallen below 1,000 kb/d.
In September, these 11 countries produced 84.3% of the Non-OPEC output. On a YoY basis, Non-OPEC production increased by 1,689 kb/d while on a MoM basis production decreased by 44 kb/d to 48,482 kb/d. World YoY September output was up by 4,992 kb/d.
Production by Country

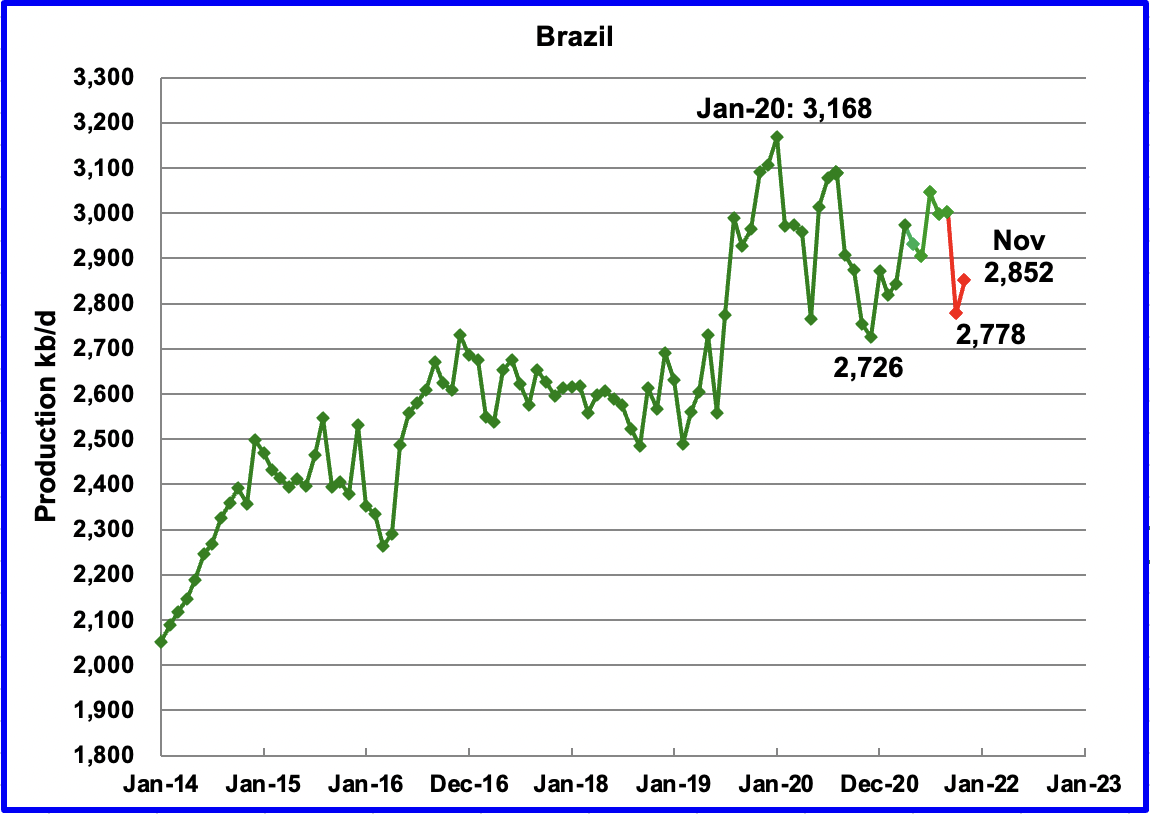
The EIA reported Brazil’s September production increased by 3 kb/d to 3,001 kb/d. According to this source, October output dropped by 223 kb/d to 2,778 kb/d in October and then rebounded to 2,852 kb/d in November. (Red Markers).
…click on the above link to read the rest of the article…