Putting Federal Debt In Perspective Against those Responsible In The Future
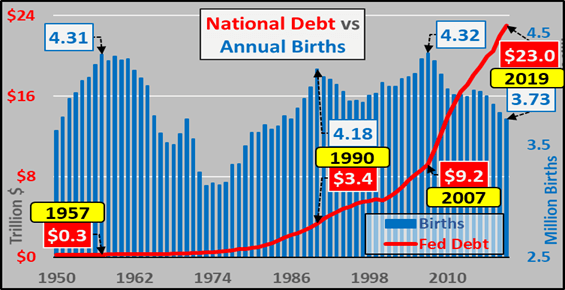
Since 2007, US federal debt has risen 150% while annual US births (legal and otherwise) have fallen almost 14%. Said otherwise, over the dozen years since 2007, federal debt has increased by $13.8 trillion while 5.2 million fewer births have occurred over the same period than the Census projected. This is probably worth a little closer look. Starting with…
US federal debt, split between publicly held debt and IG (Intra-Governmental holdings; aka Social Security trust fund, etc.). Clearly, publicly held debt is skyrocketing since 2007 while IG growth is decelerating and will turn to net declines (as SS turns to a net seller) within the decade. Relatively soon, all debt issued will be marketable and significantly more debt will be needed in order to pay for both the spiraling deficit alongside the declining IG holdings.

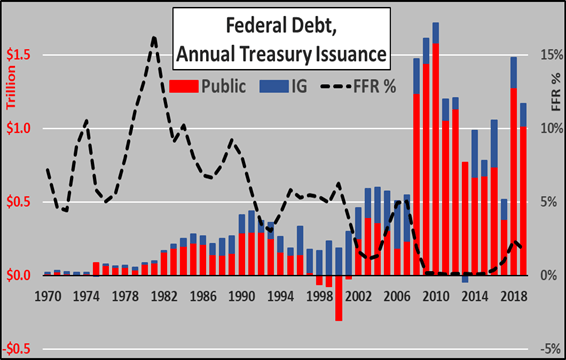
Next, looking at the annual issuance of federal debt, breaking out the annual issuance of publicly held marketable debt (red columns) versus IG (blue columns). ***Noteworthy, since August 1st of 2019, the Treasury has issued $920 billion in net new debt through October 23rd. The chart below is based on the assumption the Treasury will issue another $160 billion through the last two months plus the remainder of October (with a net issuance of $1.1 trillion for calendar year 2019).

Since debt is an obligation to be repaid or serviced in the future, I’ll put this in context with federal debt continuously divided by the future, the quantity of annual births. Below, annual births from 1950 through 2019 (blue columns) versus federal debt through 2019 (red line). ***Yes, I’m making a great leap to note that births will continue to fall in 2019…as they have been falling at an accelerating rate through Q1 of 2019, as noted by the CDC (HERE).

…click on the above link to read the rest of the article…