EIA’s Electric Power Monthly – September 2019 Edition with data for July


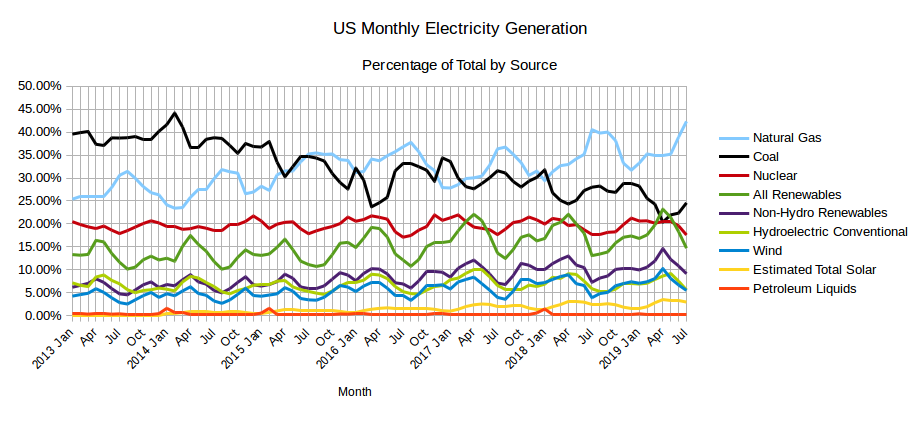
The EIA released the latest edition of their Electric Power Monthly on September 24th, with data for July 2019. The table above shows the percentage contribution of the main fuel sources to two decimal places for the last two months and the year 2019 to date.

The Table immediately above shows the absolute amounts of electricity generated in gigawatt-hours by the main sources for the last two months and the year to date. In July the absolute amount of electricity generated increased, as is usual for the month of July when compared to June for the period covered by the charts, January 2013 to date. Coal and Natural Gas between them, fueled 66.92% of US electricity generation in July. The contribution of zero carbon and carbon neutral sources declined from 37.86% in June to 32.25% in July.
The 12,055 GWh generated by Solar in July 2019 is a record, exceeding the previous record of 11,8549 GWh, set in the previous month, June 2019. It is possible that the output from solar in August could exceed the output in July as was the case in 2014 and 2015. While the percentage contribution from solar did not decline between the months of May and June it declined slightly in July 2019 as is customary when the total amount generated ramps up heading into the midsummer peak. The increase in production from solar has not continued to keep pace with the total increase in generation from June to July. However, as solar capacity continues to increase, in future years it can be expected that the contribution from solar will keep pace with the total and eventually increase going into the summer months.
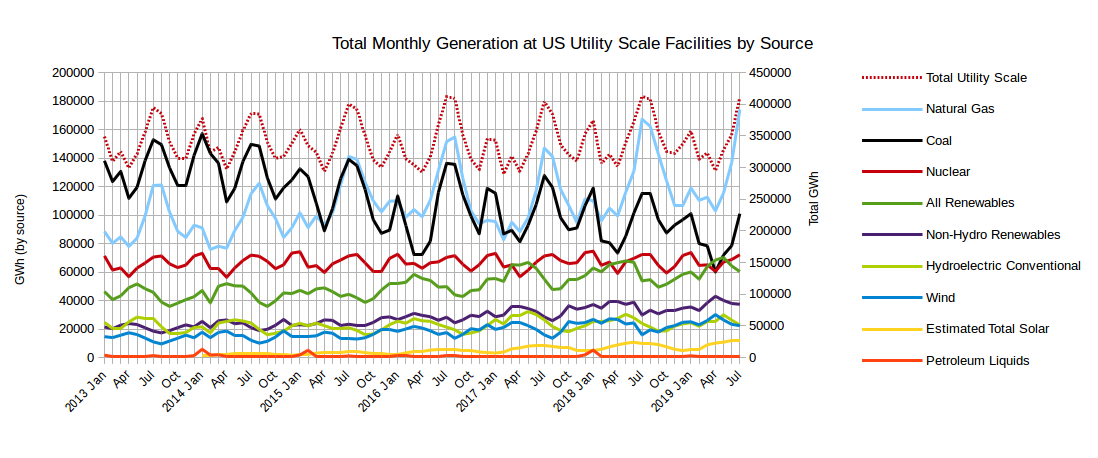
The graph below shows the absolute monthly production from the various sources since January 2013, as well as the total amount generated (right axis).

…click on the above link to read the rest of the article…