The EIA’s Optimistic Outlook
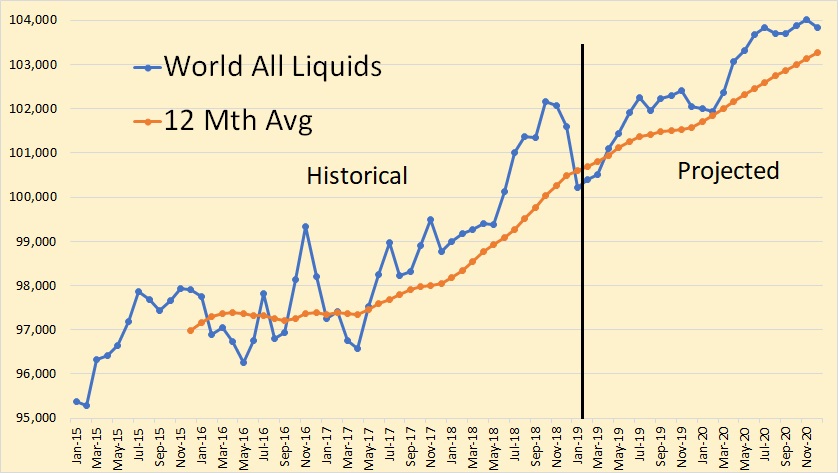
Most of the data below is taken from from the EIA’s Short-Term Energy Outlook. The data through February, 2019 is the EIA’s best estimate of past production and all data from March 2019 through December 2020 is the EIA’s best estimate of future production. However in most cases February production is highly speculative so I drew the “projection” line between January and February.

Understand the above chart is Total Liquids, not C+C as I usually post. As you can see the EIA expects world petroleum liquids to keep climbing ever upwards.

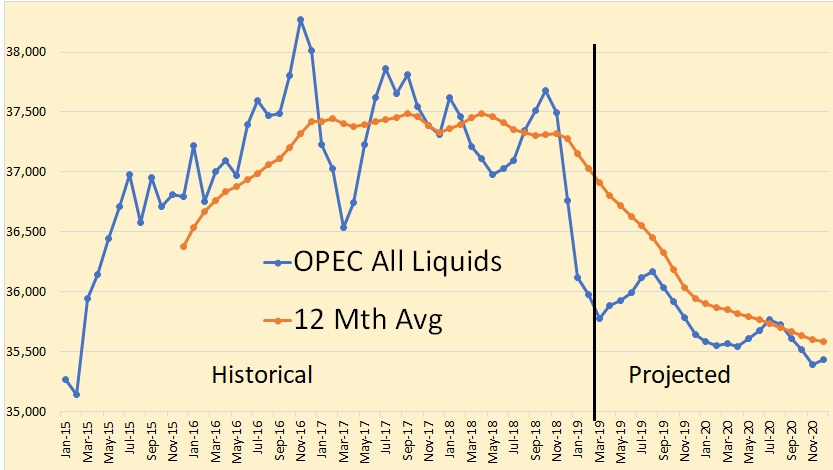
This is the EIA’s data for OPEC all liquids with Production data from April 2019 through December 2020.

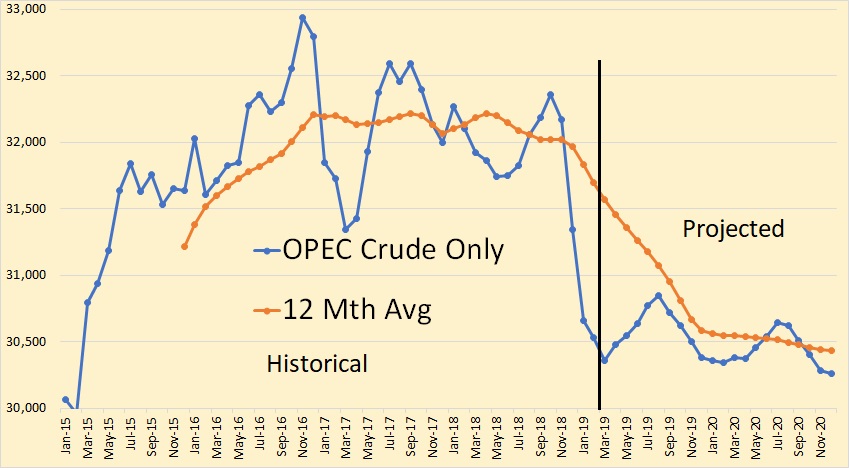
Notice the EIA expects OPEC production to keep declining through December 2020. Also they expect total liquids to decline slightly faster than crude only. This is interesting since neither condensate nor other liquids are subject to OPEC quotas.
About two years ago I made note that the EIA expected Non-OPEC to plateau but they expected OPEC to keep increasing into the future. Now they have completely reversed themselves as they expect all future growth, at least for the next two years, to come from Non-OPEC countries.
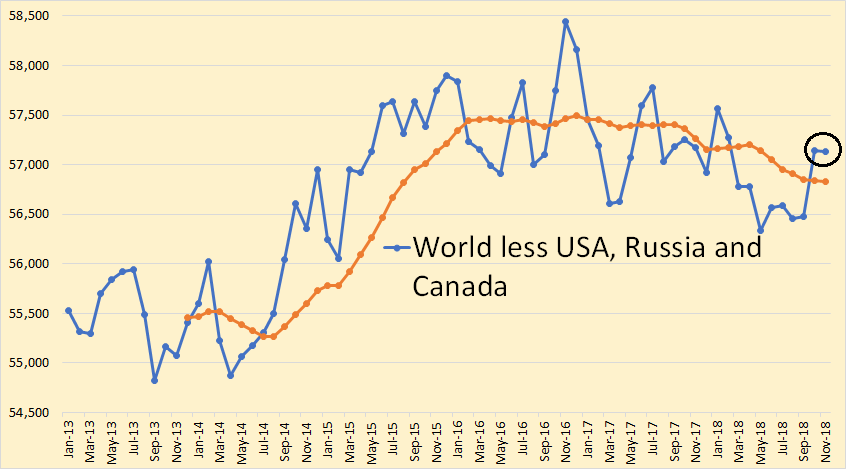
The below chart is from the EIA’a Monthly Energy review and is C+C through November 2018.

Virtually all crude oil increase since 2016 has come from three countries, USA, Russia and Canada. The spike upward (circled) in October and November 2018 was partially due to OPEC prepping for cuts. Every OPEC country made heroic efforts to increase productio during those two months in order to increase their quota. Quotas were set in December.
…click on the above link to read the rest of the article…