LATEST WEALTH DATA SHOWS DISPROPORTIONATE GAINS TO THE RICH DURING ERA OF QE
The latest ONS Wealth and Assets Survey, released last Thursday, once again showed the sheer extent of wealth inequality in the UK. A comparison of percentile figures with those from the previous wave suggests households in the wealthiest 10% gained on average nearly 700 times as much as the poorest 10% between 2012-2014 and 2014-2016.
The average total wealth of the of the bottom 10 percentile households rose by £330 between 2012-2014 and 2014-2016 (from £5,293 to £5623). The average total wealth of the top 10 percentile households increased by £229,541 over the same period (from £1,663,912 to £1,893,453).
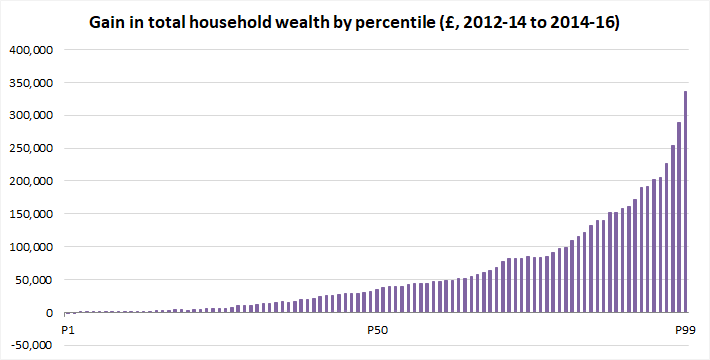
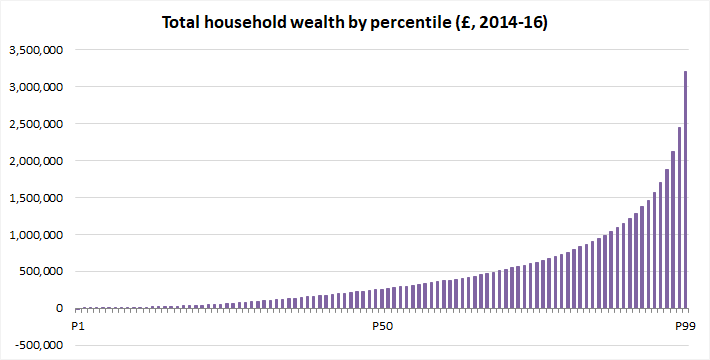
The distribution of total wealth across UK households is extremely unequal. Naturally, so too are the gains in wealth in recent years.
The figures are significant because they are the latest to contradict the position taken by Bank of England governor Mark Carney in a 2016 speech, when he used the ONS data to claim that the “poorest have gained the most” from the Bank’s quantitative easing programme. As Positive Money showed in an analysis from October last year, the Bank painted a misleading picture by using relative rather than absolute figures. Data from the the 2006-08 to 2012-14 waves of the Wealth and Assets Survey showed an absolute gain for the wealthiest 10% almost 200 times greater than that for the poorest.
…click on the above link to read the rest of the article…