- Rising commodity prices, including oil, are feeding through to PPI
- Unemployment data suggests wages may begin to rise faster
- Federal Reserve tightening will continue, other Central Banks may follow
- The bull market will be nine years old in March, the second longest in history
Since March 2009, the US stock market has been trending broadly higher. If we can continue to make new highs, or at least, not correct to the downside by more than 20%, until August of this year it will be the longest equity bull-market in US history.
The optimists continue to extrapolate from the unexpected strength of 2017 and predict another year of asset increases, but by many metrics the market is expensive and the risks of a significant correction are become more pronounced.
Equity volatility has been consistently low for the longest period in 60 years. Technical traders are, of course, long the market, but, due to the low level of the VIX, their stop-loss orders are unusually close the current market price. A small correction may trigger a violent flight to the safety of cash.
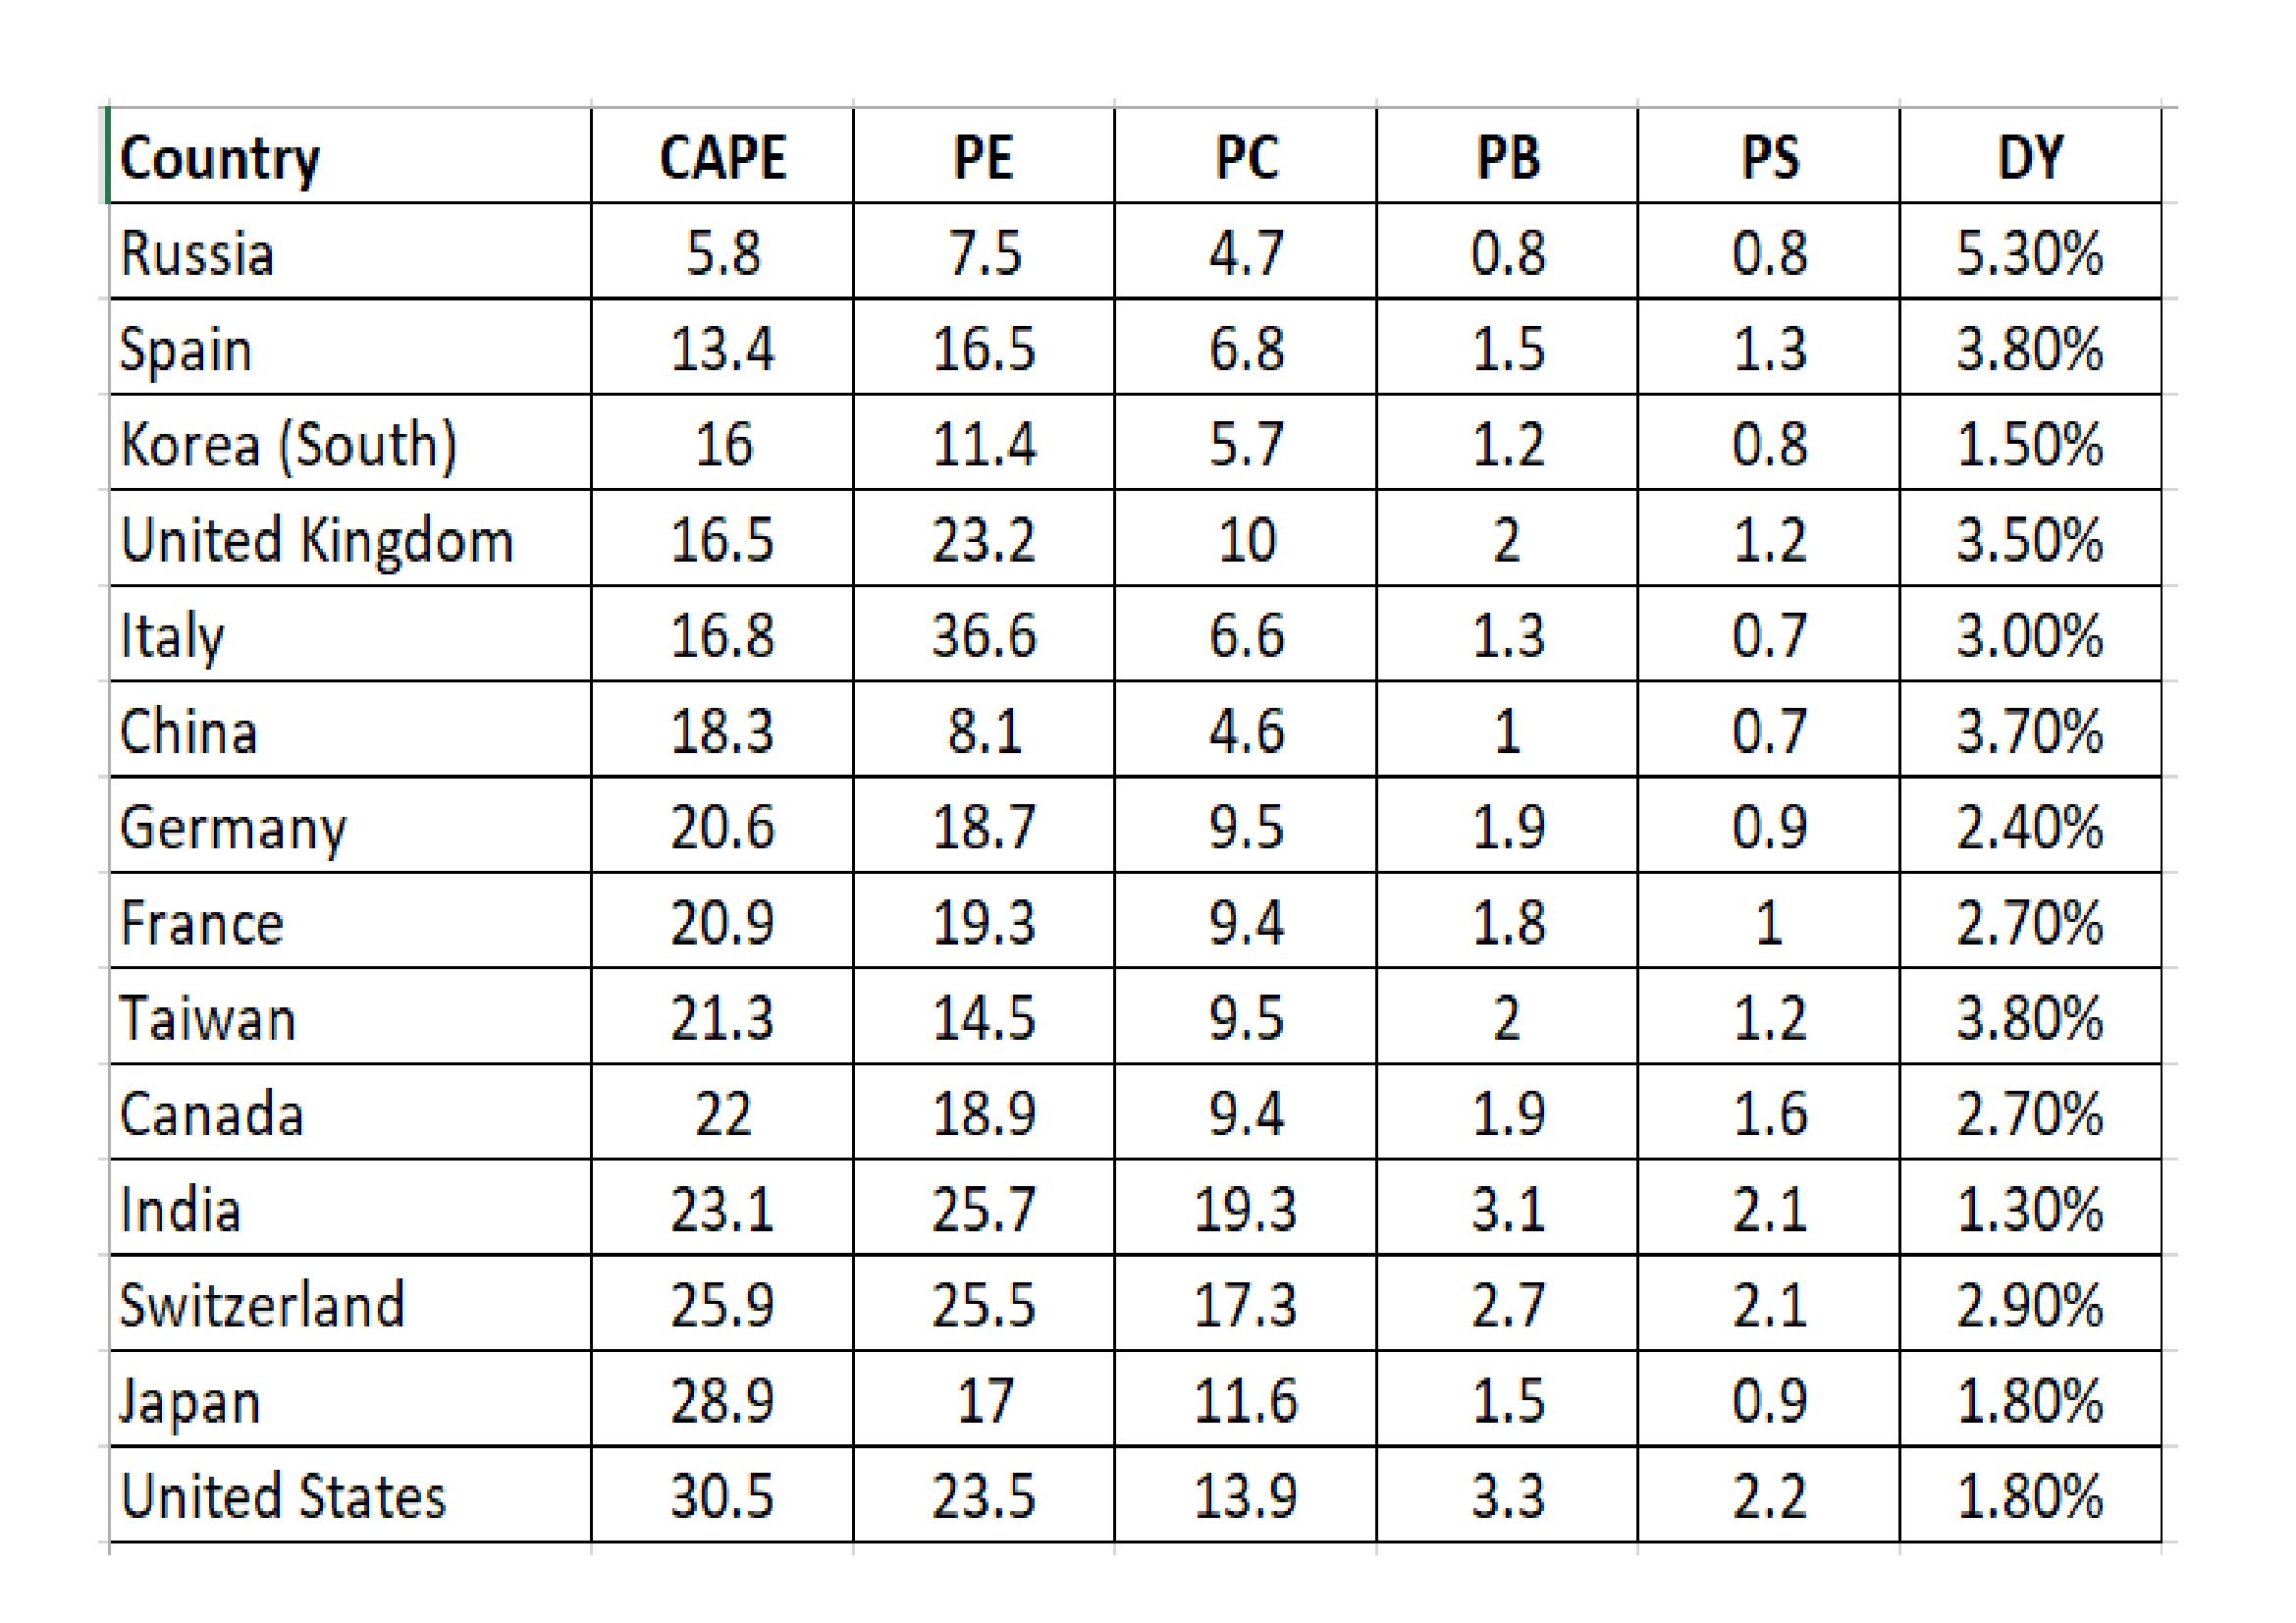
Meanwhile in Japan, after more than two decades of under-performance, the stock market has begun to play catch-up with its developed nation counterparts. Japanese stock valuation is not cheap, however, as the table below, which is sorted by the CAPE ratio, reveals:-

Source: Star Capital
Global economic growth surprised on the upside last year. For the first time since the great financial crisis, it appears that the Central Bankers experiment in balance sheet expansion has spilt over into the real-economy.
An alternative explanation is provided in this article – Is Stimulus Responsible for the Recent Improved Trends in the U.S. and Japan? – by Dent Research – here are some selected highlights:-
…click on the above link to read the rest of the article…