Home » Posts tagged 'Stock Market Correction'

Tag Archives: Stock Market Correction

Olduvai
Click on image to purchase

Olduvai III: Catacylsm
Click on image to purchase

Post categories

Post Archives by Category

The Real Reason Why Stock Markets Will Continue To Crumble This Year

The Real Reason Why Stock Markets Will Continue To Crumble This Year

Public sentiment on the economy is generally influenced by to two false indicators — the national unemployment rate and stock markets. This is not to say the average person tracks either of these numbers very vigorously; they don’t. What they do is hear these numbers on the morning news, the radio news on their way to work (if they are employed) or they hear them on the evening news just before bed. If the jobless rate is low and the Dow is high, then all is right with the world, at least financially.

When it comes to the economy, most people are lost.

The average American, in particular, is not as oblivious to the world of political and social discourse as they are on economics. Whether on the left or the right of the political spectrum, most citizens know that lines are being drawn and ideological battles are accelerating into realms of the extreme.  Conservatives and the liberty activists that stand at the front line of the culture war understand quite well the threat of globalism and the “philosopher king” elitism of international financiers. They know that these criminals must eventually be dealt with if freedom and stability are to return to the world.

There is a rather common disinformation tactic used to manipulate people within conservative circles that has made a resurgence lately in the wake of the Trump election win. It is the idea that Americans within the “working class” aren’t interested in “high-minded” debates over philosophical conflicts, such as the conflicts between individualism versus collectivism and globalism. There is also the notion that “real” Americans could not care less about the elitist culprits behind the political theater of the false left/right paradigm.

This attitude is presented as a superior one. That is to say, disinformation agents play to people’s egos, suggesting that the working class should be focused on putting food on the table and money in their wallets and that the rest of this “intellectual nonsense” should be ignored as frivolous.

…click on the above link to read the rest of the article…

DOW JONES INDEX CORRECTION & CRASH LEVELS: A Chart All Investors Must See

DOW JONES INDEX CORRECTION & CRASH LEVELS: A Chart All Investors Must See

As the Dow Jones Index continues to drop like a rock, the worst is yet to come.  Today, investors once again plowed into the markets because they are following the Mainstream Financial advice of BUYING THE DIP.  Unfortunately, those who bought the dip before yesterday’s 1,032 point drop and the 400+ point drop this afternoon, have thrown good money after bad.

Of course, we could see a late day rally to calm investor’s nerves…. but we could also see an increased sell-off.  Either way, I could really give a rat’s arse.  Why?  Well, let’s just say the Dow Jones Index has a long way to fall before it gets back to FAIR VALUE.  However, my fair value is likely much lower than the Mainstream analysts’ forecasts.

I wanted to publish this post today but will be putting together a Youtube video with more detail this weekend.  However, let’s take a look at the Dow Jones Index chart from my Youtube video:

If you haven’t seen this video, I highly recommend that you do.  When I published that video, the Dow Jones Index was trading at 26,100.  Today it is already down to 23,400.  However, as I stated, we have much further down to go.  Here is my newest chart:

While the Dow Jones Index has already declined by 2,500 points since my first chart, I wanted to provide the different correction and crash levels as I see it taking place on the Dow Jones Index in the future.  The first level the Dow Jones will reach its Support level at about 18,000 points.  Once this level is broken, then it breaks down to the 200 Month Moving Average (RED line) at 13,000.  Who knows how long it would take to get down to 13,000, but it will.

…click on the above link to read the rest of the article…

The Risk of a Correction in the Equity Bull Market

  • Rising commodity prices, including oil, are feeding through to PPI
  • Unemployment data suggests wages may begin to rise faster
  • Federal Reserve tightening will continue, other Central Banks may follow
  • The bull market will be nine years old in March, the second longest in history

Since March 2009, the US stock market has been trending broadly higher. If we can continue to make new highs, or at least, not correct to the downside by more than 20%, until August of this year it will be the longest equity bull-market in US history.

The optimists continue to extrapolate from the unexpected strength of 2017 and predict another year of asset increases, but by many metrics the market is expensive and the risks of a significant correction are become more pronounced.

Equity volatility has been consistently low for the longest period in 60 years. Technical traders are, of course, long the market, but, due to the low level of the VIX, their stop-loss orders are unusually close the current market price. A small correction may trigger a violent flight to the safety of cash.

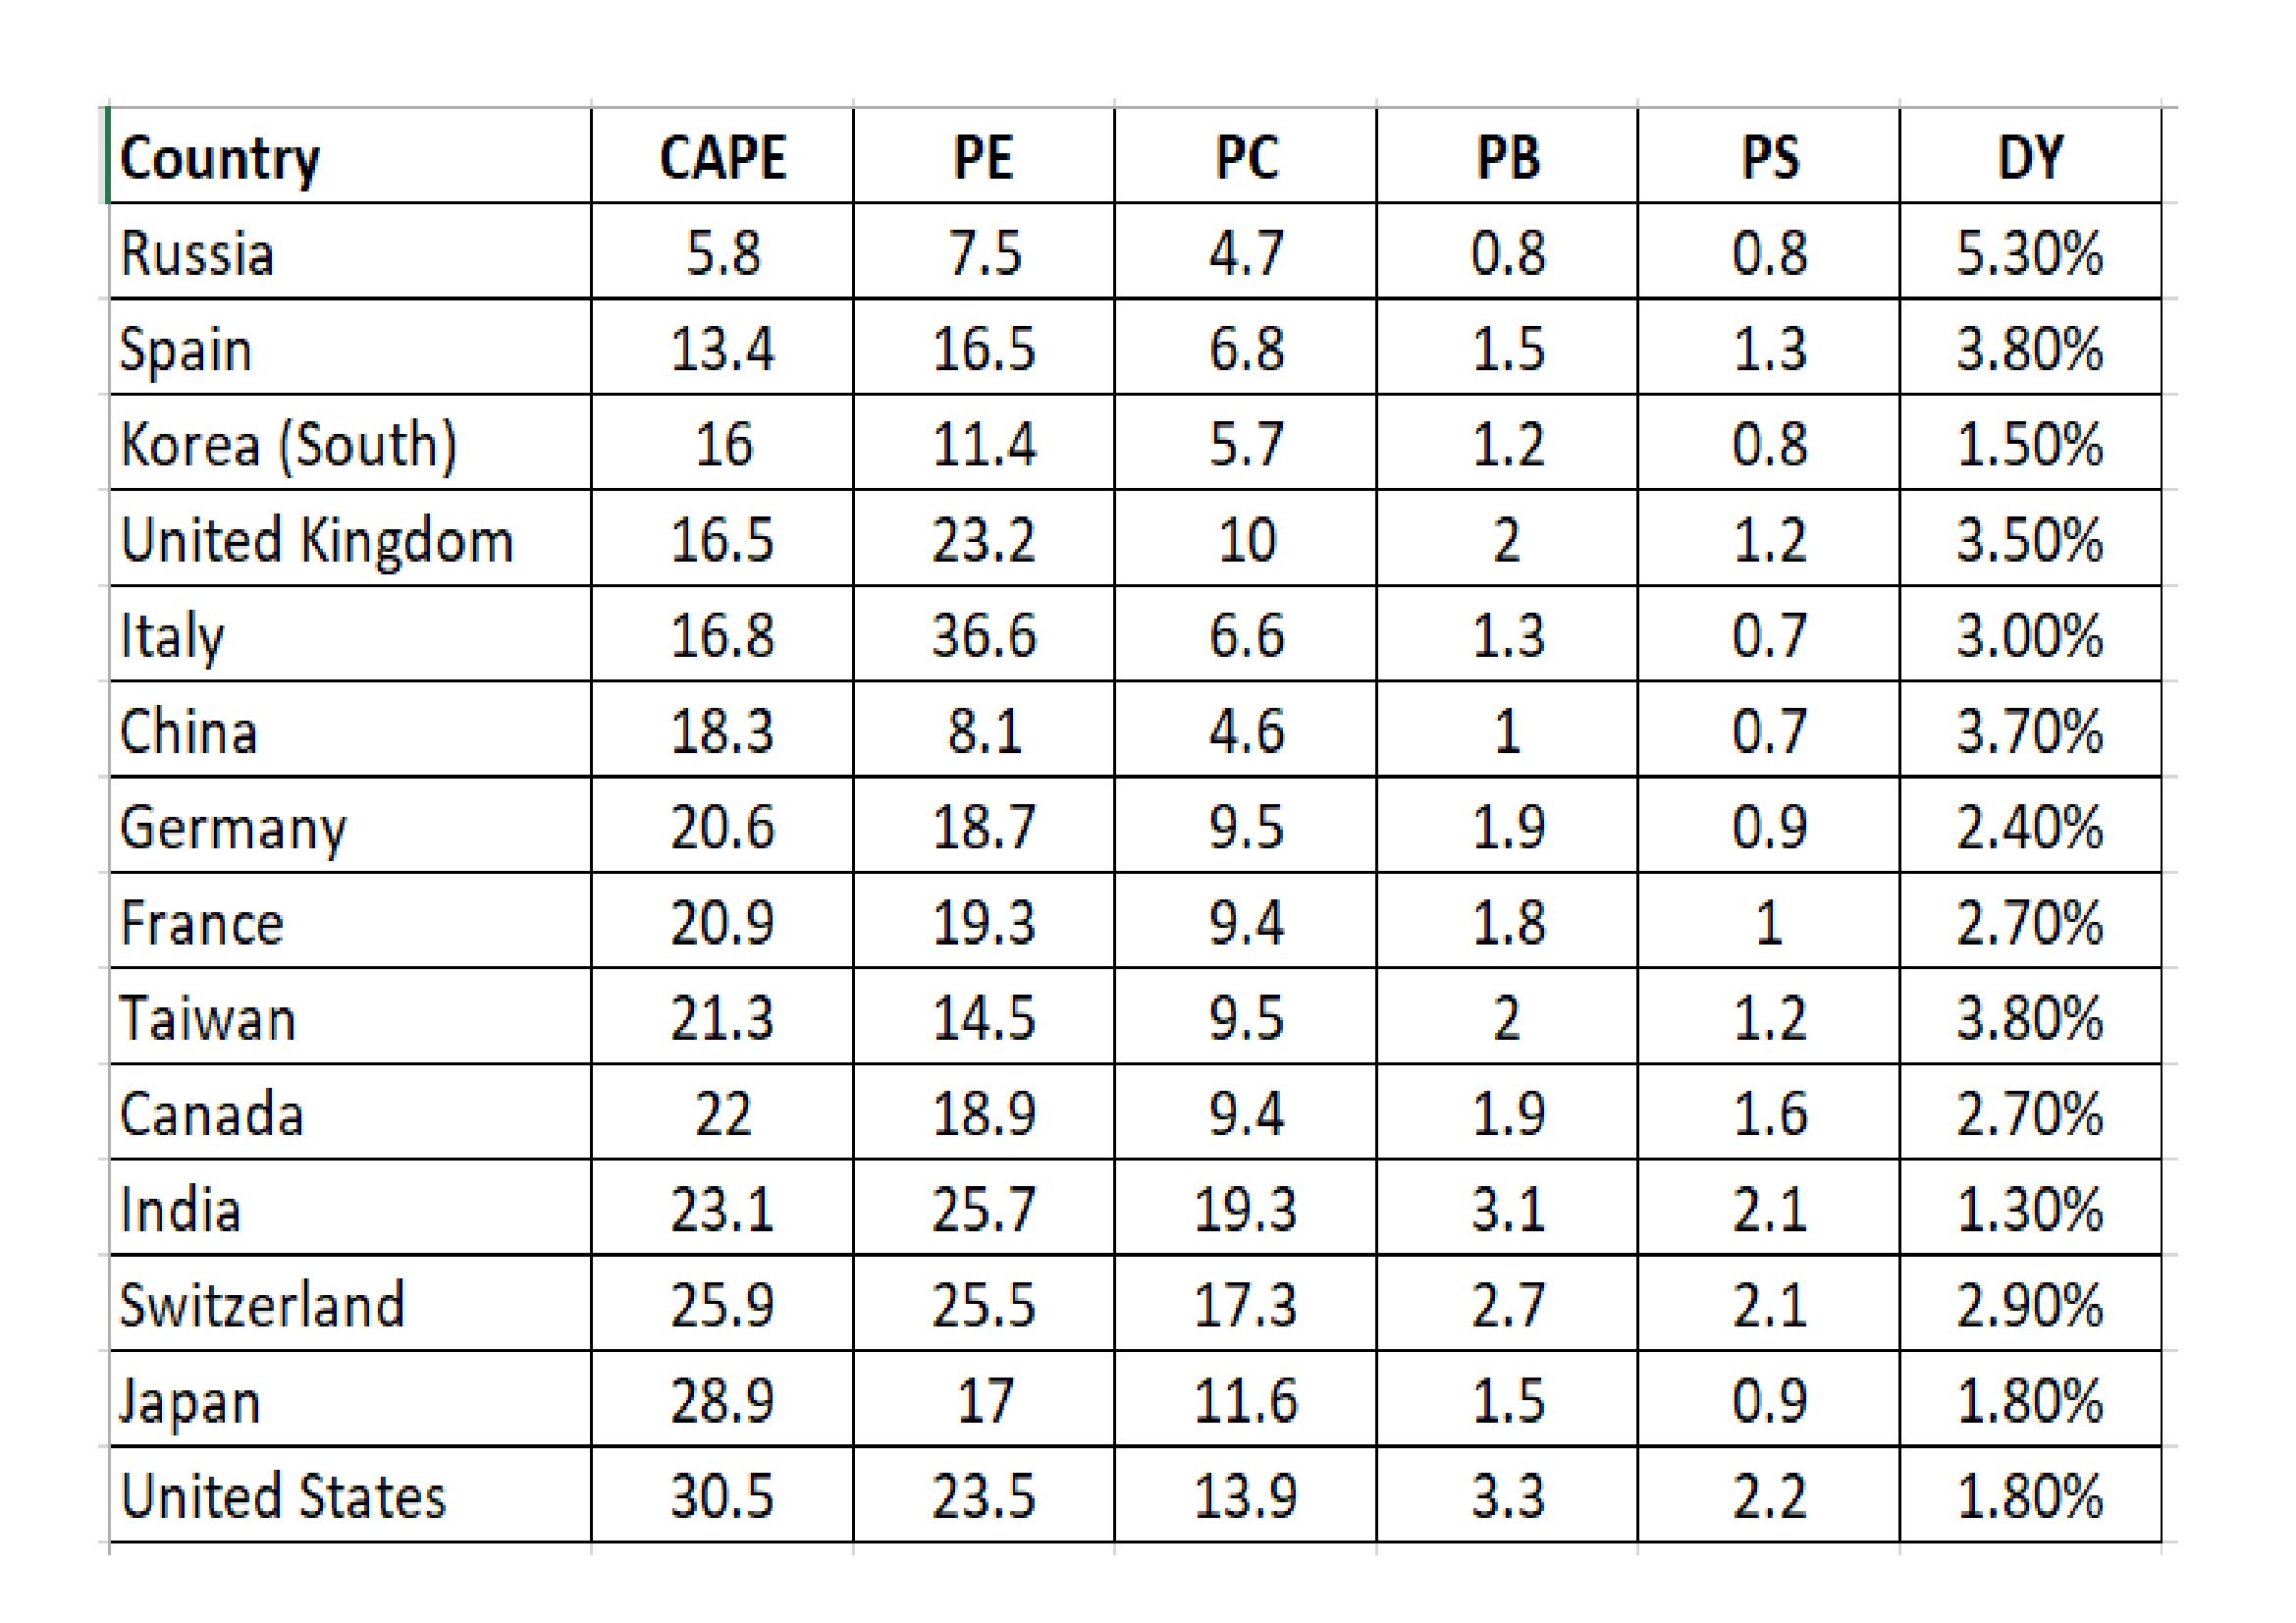
Meanwhile in Japan, after more than two decades of under-performance, the stock market has begun to play catch-up with its developed nation counterparts. Japanese stock valuation is not cheap, however, as the table below, which is sorted by the CAPE ratio, reveals:-

Star_Capital_-_Equity_Valuations_31-12-2017

Source: Star Capital

Global economic growth surprised on the upside last year. For the first time since the great financial crisis, it appears that the Central Bankers experiment in balance sheet expansion has spilt over into the real-economy.

An alternative explanation is provided in this article – Is Stimulus Responsible for the Recent Improved Trends in the U.S. and Japan? – by Dent Research – here are some selected highlights:-

…click on the above link to read the rest of the article…

September 2015 Sure Started Off With Quite A Bang, Eh?

September 2015 Sure Started Off With Quite A Bang, Eh?

Bang Explosion - Public DomainAfter enduring their worst August in 17 years, U.S. stocks are off to their worst start to a September in 13 years.  Just yesterday, I declared that we would be entering the “danger zone” this month, and it didn’t take long for the action to begin.  Historically, this month is the worst month of the year for stocks, and most of the biggest stock market crashes throughout our history have come in the fall.  On Tuesday, the Dow plunged another 469 points, and it is now down more than 10 percent from the peak of the market back in May.  That means that we have officially entered “correction” territory.  Asian stocks also crashed hard on Tuesday, so did European stocks, and the price of oil plummeted about 8 percent.  For a long time, there have been a lot of people out there that have been warning that a financial crisis would happen in the second half of 2015, and they are being proven right.  It is actually happening.

Of course there will be plenty of ups and downs still to come.  I cannot emphasize enough that we should fully expect waves of panic selling and waves of panic buying.  This always happens during any market crash.

For instance, just consider what happened when the tech bubble crashed.  The following analysis comes from Graham Summers

In a six month period, investors moved stocks down 19%, up 8%, then down 27%, then up 21%, then down 22%, then up 34%, then down 17%, then up 16%, then down 28%, then up 16%, and finally down 17%. Only at that point did stocks break their trendline for the bubble (the blue line) and it became obvious that the bubble had burst.

…click on the above link to read the rest of the article…


Olduvai IV: Courage
Click on image to read excerpts

Olduvai II: Exodus
Click on image to purchase

Click on image to purchase @ FriesenPress