Canada Home Values Hit “First Quarterly Decline since Q1 2009” as Household Debt Binge Hits New High
How exposed are over-indebted household to rising interest rates?
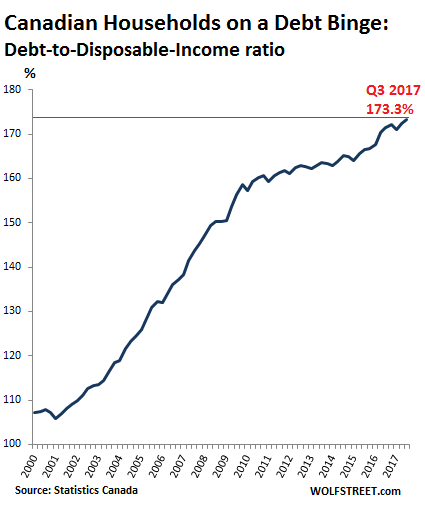
Household debt in Canada rose to a new record of C$2.11 trillion in the third quarter 2017, up 5.2% from a year ago and up 10.7% from two years ago, Statistics Canada said on Thursday in its quarterly report on national balance sheets. Mortgages accounted for 65.6% of the total. Canada’s infamous household-debt-to-disposable income ratio, one of the highest in the world, rose to a breath-taking record of 173.3%.
The ratio means that households, on average, owed C$1.73 for every dollar of after-tax income earned. This chart shows how the indebtedness in relationship to after-tax income has soared since 2001, when Canada’s housing boom took off in earnest:
While US households “deleveraged” somewhat during the Great Recession, mostly by defaulting on their debts when housing crashed and jobs vanished, Canadian households barely took a breather as there was no housing bust in Canada. Hence the consistently rising and record-breaking debt-to-disposable income ratio above.
Disposable income in 2016 got hit by “a significant downward revision,” based on new data received from Canada’s tax collection agency, Statistics Canada said. This resulted “in an upwards shift to this ratio.”
The debt-to-disposable-income ratio of 173%, scary as it is, is just a national average. But it’s not normally the top of the income categories that get in trouble. It’s the lower categories.
In a separate report also released on Thursday on the distribution of income and assets, Statistics Canada added to this debate:
Economy-wide debt-to-asset and debt-to-disposable-income ratios can mask the financial risk associated with increasing debt for a given group of Canadian households.
In 2016, the national average debt-to-disposable-income ratio was 172.1%. Decomposing this by household disposable income quintile reveals that the debt-to-disposable-income ratio for the bottom income earning households was 333.4%, while the debt-to-disposable-income ratio for the top was 128.3%.
…click on the above link to read the rest of the article…