US 2015 Oil Production and Future Oil Prices
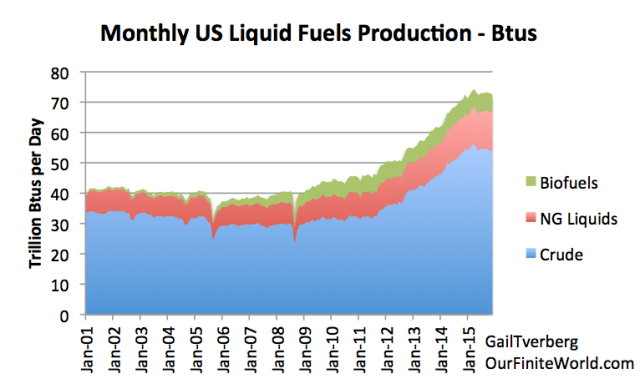
Figure 1. US Liquid Fuels production by month based on EIA March 2016 Monthly Energy Review Reports.
US oil production clearly flattened out in 2015. If we look at changes relative to the same month, one-year prior, we see that as of December 2014, growth was very high, increasing by 18.0% relative to the prior year.
By December 2015, growth over the prior year finally turned slightly negative, with production for the month down 0.2% relative to one year prior. It should be noted that in the above charts, amounts are on an “energy produced” or “British Thermal Units” (Btu) basis. Using this approach, ethanol and natural gas liquids get less credit than they would using a barrels-per-day approach. This reflects the fact that these products are less energy-dense.
Figure 3 shows the trend in month-by-month production.
Figure 3. US total liquids production since January 2013, based on EIA’s March 2016 Monthly Energy Review.
The high month for production was April 2015, and production has been down since then. The production of natural gas liquids and biofuels has tended to continue to rise, partially offsetting the fall in crude oil production. Production amounts for recent months include estimates, and actual amounts may differ from these estimates. As a result, updated EIA data may eventually show a somewhat different pattern.
…click on the above link to read the rest of the article…


