Home » Posts tagged 'gail tverberg' (Page 9)

Tag Archives: gail tverberg

Olduvai
Click on image to purchase

Olduvai III: Catacylsm
Click on image to purchase

Post categories

Post Archives by Category

Deflationary Collapse Ahead?

Deflationary Collapse Ahead?

Both the stock market and oil prices have been plunging. Is this “just another cycle,” or is it something much worse? I think it is something much worse.

Back in January, I wrote a post called Oil and the Economy: Where are We Headed in 2015-16? In it, I said that persistent very low prices could be a sign that we are reaching limits of a finite world. In fact, the scenario that is playing out matches up with what I expected to happen in my January post. In that post, I said

Needless to say, stagnating wages together with rapidly rising costs of oil production leads to a mismatch between:

  • The amount consumers can afford for oil
  • The cost of oil, if oil price matches the cost of production

This mismatch between rising costs of oil production and stagnating wages is what has been happening. The unaffordability problem can be hidden by a rising amount of debt for a while (since adding cheap debt helps make unaffordable big items seem affordable), but this scheme cannot go on forever.

Eventually, even at near zero interest rates, the amount of debt becomes too high, relative to income. Governments become afraid of adding more debt. Young people find student loans so burdensome that they put off buying homes and cars. The economic “pump” that used to result from rising wages and rising debt slows, slowing the growth of the world economy. With slow economic growth comes low demand for commodities that are used to make homes, cars, factories, and other goods. This slow economic growth is what brings the persistent trend toward low commodity prices experienced in recent years.

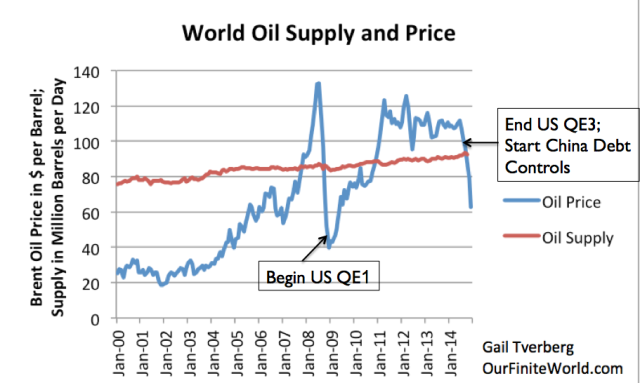
A chart I showed in my January post was this one:

Figure 1. World Oil Supply (production including biofuels, natural gas liquids) and Brent monthly average spot prices, based on EIA data.

…click on the above link to read the rest of the article…


How Economic Growth Fails

How Economic Growth Fails

We all know generally how today’s economy works:

Figure 1

Our economy is a networked system. I have illustrated it as being similar to a child’s building toy. Ever-larger structures can be built by adding more businesses and consumers, and by using resources of various kinds to produce an increasing quantity of goods and services.

Figure 2. Dome constructed using Leonardo Sticks

There is no overall direction to the system, so the system is said to be “self-organizing.”

The economy operates within a finite world, so at some point, a problem ofdiminishing returns develops. In other words, it takes more and more effort (human labor and use of resources) to produce a given quantity of oil or food, or fresh water, or other desirable products. The problem of slowing economic growth is very closely related to the question: How can the limits we are reaching be expected to play out in a finite world? Many people imagine that we will “run out” of some necessary resource, such as oil, but I see the situation differently. Let me explain a few issues that may not be obvious.

1. Our economy is like a pump that works increasingly slowly over time, as diminishing returns and other adverse influences affect its operation. Eventually, it is likely to stop.

As nearly as I can tell, the way economic growth occurs (and stops taking place) is as summarized in Figure 3.

Figure 3. Overview of our economic predicament

As long as (a) energy and other resources are cheap, (2) debt is readily available, and (3) “overhead” in the form of payments for government services, business overhead, and interest payments on debt are low, the pump can continue working as normal. As various parts of the pump “gum up,” the economic growth pump slows down. It is likely to eventually stop, once it becomes too difficult to repay debt with interest with the meager level of economic growth achieved.


…click on the above link to read the rest of the article…

Nine Reasons Why Low Oil Prices May “Morph” Into Something Much Worse

Nine Reasons Why Low Oil Prices May “Morph” Into Something Much Worse

Why are commodity prices, including oil prices, lagging? Ultimately, it comes back to the question, “Why isn’t the world economy making very many of the end products that use these commodities?” If workers were getting rich enough to buy new homes and cars, demand for these products would be raising the prices of commodities used to build and operate cars, including the price of oil. If governments were rich enough to build an increasing number of roads and more public housing, there would be demand for the commodities used to build roads and public housing.

It looks to me as though we are heading into a deflationary depression, because prices of commodities are falling below the cost of extraction. We need rapidly rising wages and debt if commodity prices are to rise back to 2011 levels or higher. This isn’t happening. Instead, Janet Yellen is talking about raising interest rates later this year, and  we are seeing commodity prices fall further and further. Let me explain some pieces of what is happening.

1. We have been forcing economic growth upward since 1981 through the use of falling interest rates. Interest rates are now so low that it is hard to force rates down further, to encourage further economic growth. 

Falling interest rates are hugely beneficial for the economy. If interest rates stop dropping, or worse yet, begin to rise, we will lose this very beneficial factor affecting the economy. The economy will tend to grow even less quickly, bringing down commodity prices further. The world economy may even start contracting, as it heads into a deflationary depression.

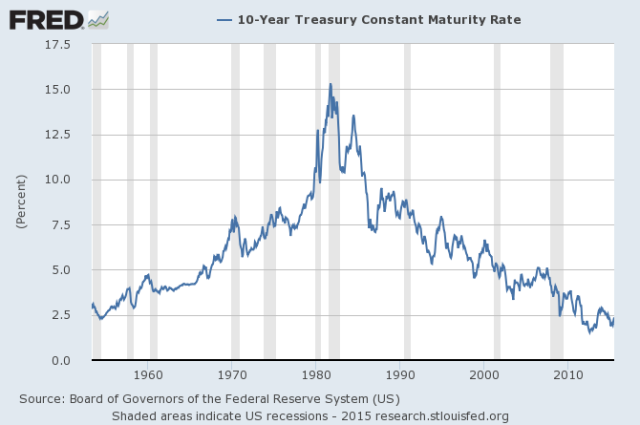
If we look at 10-year US treasury interest rates, there has been a steep fall in rates since 1981.

Figure 1. Chart prepared by St. Louis Fed using data through July 20, 2015.

…click on the above link to read the rest of the article…


What Greece, Cyprus, and Puerto Rico Have in Common

What Greece, Cyprus, and Puerto Rico Have in Common

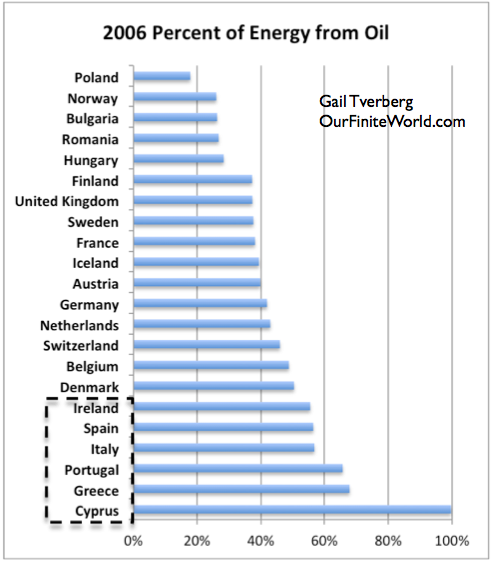
We all know one thing that Greece, Cyprus, and Puerto Rico have in common–severe financial problems. There is something else that they have in common–a high proportion of their energy use is from oil. Figure 1 shows the ratio of oil use to energy use for selected European countries in 2006.

Figure 1. Oil as a percentage of total energy consumption in 20006, based on June 2015 Energy Information data.

Greece and Cyprus are at the bottom of this chart. The other “PIIGS” countries (Ireland, Spain, Italy, and Portugal) are immediately above Greece. Puerto Rico is not European so is not on Figure 1, but it if were shown on this chart, it would between Greece and Cyprus–its oil as a percentage of its energy consumption was 98.4% in 2006. The year 2006 was chosen because it was before the big crash of 2008. The percentages are bit lower now, but the relationship is very similar now.

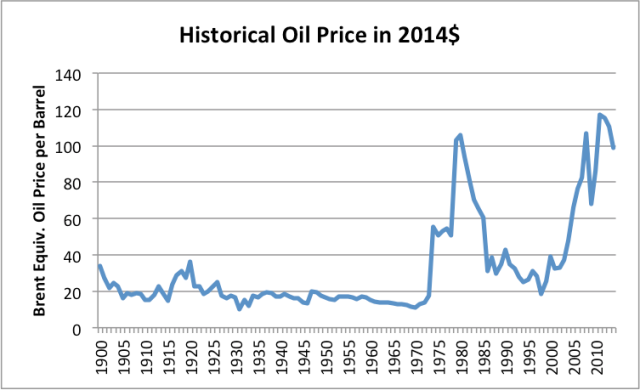
Why would high oil consumption as a percentage of total energy be a problem for countries? The issue, as I see it, is competitiveness (or lack thereof) in the world marketplace. Years ago, say back in the early 1900s, when countries built up their infrastructure, oil price was much lower than today–less than $20 a barrel (even in inflation-adjusted dollars). Between 1985 and 2000 there was another period when prices were below $40 barrel. Back then, the price of oil was not too different from the price of other types of energy, so an energy mix slanted toward oil was not a problem.

Figure 2. Historical World Energy Price in 2014$, from BP Statistical Review of World History 2015.

Oil prices are now in the $60 barrel range. This is still high by historical standards. Furthermore, much of the financial difficulty countries have gotten into has occurred in the recent past, when oil prices were in the $100 per barrel range.

While countries with a large share of oil in their energy mix tend to fare poorly, at least some countries with a preponderance of cheap energy fuels in their energy mix have tended to do very well. For example, China’s economy has grown rapidly in recent years. In 2006, its share of oil in its energy mix was only 23.0%, putting it below Norway but above Poland, if it were included in Figure 1.

…click on the above link to read the rest of the article…

BP Data Suggests We Are Reaching Peak Energy Demand

BP Data Suggests We Are Reaching Peak Energy Demand

Some people talk about peak energy (or oil) supply. They expect high prices and more demand than supply. Other people talk about energy demand hitting a peak many years from now, perhaps when most of us have electric cars.

Neither of these views is correct. The real situation is that we right now seem to be reaching peak energy demand through low commodity prices. I see evidence of this in the historical energy data recently updated by BP (BP Statistical Review of World Energy 2015). Of course,

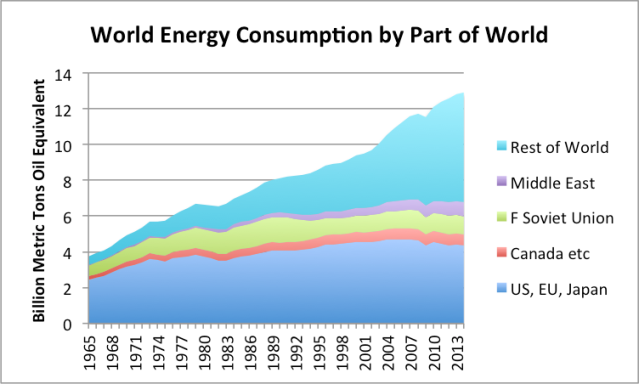
Growth in world energy consumption is clearly slowing. In fact, growth in energy consumption was only 0.9% in 2014. This is far below the 2.3% growth we would expect, based on recent past patterns. In fact, energy consumption in 2012 and 2013 also grew at lower than the expected 2.3% growth rate (2012 – 1.4%; 2013 – 1.8%).

Figure 1- Resource consumption by part of the world. Canada etc. grouping also includes Norway, Australia, and South Africa. Based on BP Statistical Review of World Energy 2015 data.

Recently, I wrote that economic growth eventually runs into limits. The symptoms we should expect are similar to the patterns we have been seeing recently (Why We Have an Oversupply of Almost Everything (Oil, labor, capital, etc.)). It seems to me that the patterns in BP’s new data are also of the kind that we would expect to be seeing, if we are hitting limits that are causing low commodity prices.

One of our underlying problems is that energy costs that have risen faster than most worker’s wages since 2000. Another underlying problem has to do with globalization. Globalization provides a temporary benefit. In the last 20 years, we greatly ramped up globalization, but we are now losing the temporary benefit globalization brings. We find we again need to deal with the limits of a finite world and the constraints such a world places on growth.

…click on the above link to read the rest of the article…


Why EIA, IEA, and BP Oil Forecasts are Too High

Why EIA, IEA, and BP Oil Forecasts are Too High

When forecasting how much oil will be available in future years, a standard approach seems to be the following:

  1. Figure out how much GDP growth the researcher hopes to have in the future.
  2. “Work backward” to see how much oil is needed, based on how much oil was used for a given level of GDP in the past. Adjust this amount for hoped-for efficiency gains and transfers to other fuel uses.
  3. Verify that there is actually enough oil available to support this level of growth in oil consumption.

In fact, this seems to be the approach used by most forecasting agencies, including EIA, IEA and BP. It seems to me that this approach has a fundamental flaw. It doesn’t consider the possibility of continued low oil prices and the impact that these low oil prices are likely to have on future oil production. Hoped-for future GDP growth may not be possible if oil prices, as well as other commodity prices, remain low.

Future Oil Resources Seem to Be More Than Adequate

It is easy to get the idea that we have a great deal of oil resources in the ground. For example, if we start with BP Statistical Review of World Energy, we see that reported oil reserves at the end of 2013 were 1,687.9 billion barrels. This corresponds to 53.3 years of oil production at 2013 production levels.

If we look at the United States Geological Services 2012 report for one big grouping–undiscovered conventional oil resources for the world excluding the United States, we get a “mean” estimate of 565 billion barrels. This corresponds to another 17.8 years of production at the 2013 level of oil production.

…click on the above link to read the rest of the article…


Cuba: Figuring Out Pieces of the Puzzle

Cuba: Figuring Out Pieces of the Puzzle

Cuba is an unusual country for quite a few reasons:

  • The United States has had an embargo against Cuba since 1960, but there has recently been an announcement that the US will begin to normalize diplomatic relations.
  • The leader of Cuba between 1959 and 2008 was Fidel Castro. Fidel Castro is a controversial figure, with some viewing him is a dictator who nationalized property of foreign citizens without compensation. Citizens of Cuba seem to view him as more of as a Robin Hood figure, who helped the poor by bringing healthcare and education to all, equalizing wages, and building many concrete block homes for people who had only lived in shacks previously.
  • If we compare Cuba to its nearest neighbors Haiti and Dominican Republic (both of which were also former sugar growing colonies of European countries), we find that Cuba is doing substantially better than the other two. In per capita CPI in Purchasing Power Parity, in 2011, Cuba’s average was $18,796, while Haiti’s was $1,578, and the Dominican Republic was $11,263. In terms of the Human Development Index (which measures such things as life expectancy and literacy), in 2013, Cuba received a rating of .815, which is considered “very high”. Dominican Republic received a rating of .700, which is considered “High.” Haiti received a rating of .471, which is considered “Low.”
  • Cuba is known for its permaculture programs (a form of organic gardening), which helped increase Cuba’s production of fruit and vegetables in the 1990s and early 2000s.
  • In spite of all of these apparently good outcomes of Cuba’s experimentation with equal sharing of wealth, in recent years Cuba seems to be moving away from the planned economy model. Instead, it is moving to more of a “mixed economy,” with more entrepreneurship encouraged.


…click on the above link to read the rest of the article…

Why We Have an Oversupply of Almost Everything (Oil, labor, capital, etc.)

Why We Have an Oversupply of Almost Everything (Oil, labor, capital, etc.)

The Wall Street Journal recently ran an article called, Glut of Capital and Labor Challenge Policy Makers: Global oversupply extends beyond commodities, elevating deflation risk. To me, this is a very serious issue, quite likely signaling that we are reaching what has been called Limits to Growth, a situation modeled in 1972 in a book by that name.

What happens is that economic growth eventually runs into limits. Many people have assumed that these limits would be marked by high prices and excessive demand for goods. In my view, the issue is precisely the opposite one: Limits to growth are instead marked by low prices and inadequate demand. Common workers can no longer afford to buy the goods and services that the economy produces, because of inadequate wage growth. The price of all commodities drops, because of lower demand by workers. Furthermore, investors can no longer find investments that provide an adequate return on capital, because prices for finished goods are pulled down by the low demand of workers with inadequate wages.

Evidence Regarding the Connection Between Energy Consumption and GDP Growth

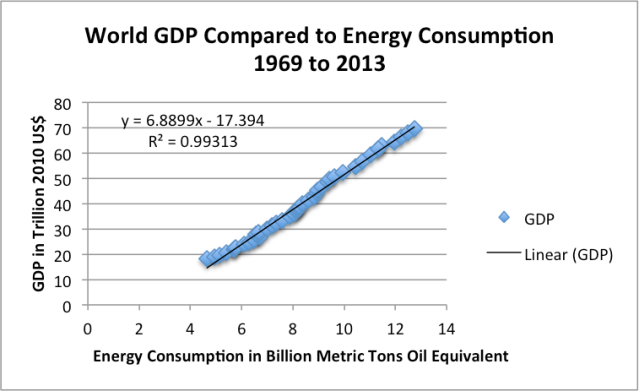
We can see the close connection between world energy consumption and world GDP using historical data.


Figure 1. World GDP in 2010$ compared (from USDA) compared to World Consumption of Energy (from BP Statistical Review of World Energy 2014).

This chart gives a clue regarding what is wrong with the economy. The slope of the line implies that adding one percentage point of growth in energy usage tends to add less and less GDP growth over time, as I have shown in Figure 2. This means that if we want to have, for example, a constant 4% growth in world GDP for the period 1969 to 2013, we would need to gradually increase the rate of growth in energy consumption from about 1.8% = (4.0% – 2.2%) growth in energy consumption in 1969 to 2.8% = (4.0% – 1.2%) growth in energy consumption in 2013.

…click on the above link to read the rest of the article…


Overview of Our Energy Modeling Problem

Overview of Our Energy Modeling Problem

We live in a world with limits, yet our economy needs growth. How can we expect this scenario to play out? My view is that this problem will play out as a fairly near-term financial problem, with low oil prices leading to a fall in oil production. But not everyone comes to this conclusion. What were the views of early researchers? How do my views differ?

In my post today, I plan to discuss the first lecture I gave to a group of college students in Beijing. A PDF of it can be found here: 1. Overview of Energy Modeling Problem. A MP4 video is available as well on my Presentations/Podcasts Page.

Many Limits in a Finite World

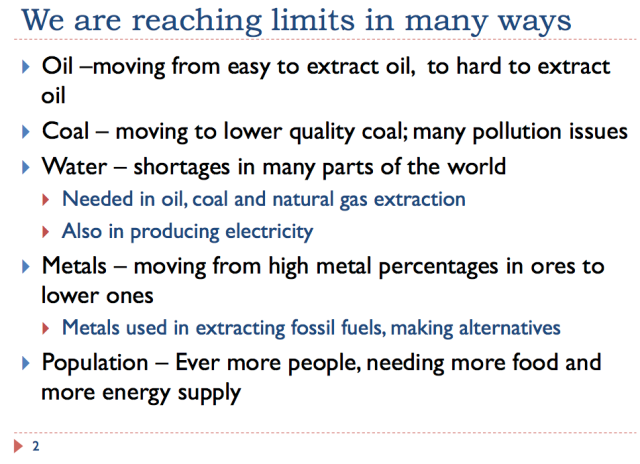
We live in a world with limits. These limits are not just energy limits; they come in many different forms:

2 We are reaching limits in many ways

All these limits work together. We can work around these limits, but the workarounds are higher cost–for example, substituting less polluting energy resources for more polluting energy resources, or extracting lower grade ores instead of high-grade ores. When lower grade ores are used, we need to process more waste material, raising costs because of greater energy use. When population rises, we must change our agricultural approaches to increase food production per acre cultivated.


The problem we reach with any of these workarounds is diminishing returns. We can keep increasing output, but doing so requires disproportionately more inputs of many kinds (including human labor, mineral resources, fresh water, and energy products) to produce the same quantity of output. This creates higher costs, and can lead to financial problems. This phenomenon is one of the major things that a model of a finite world should reflect.

…click on the above link to read the rest of the article…


The oil glut and low prices reflect an affordability problem

The oil glut and low prices reflect an affordability problem

For a long time, there has been a belief that the decline in oil supply will come by way of high oil prices. Demand will exceed supply. It seems to me that this view is backward–the decline in supply will come through low oil prices.

The oil glut we are experiencing now reflects a worldwide affordability crisis. Because of a lack of affordability, demand is depressed. This lack of demand keeps prices low–below the cost of production for many producers. If the affordability issue cannot be fixed, it threatens to bring down the system by discouraging investment in oil production.

This lack of affordability is affecting far more than oil products. A recent article in The Economist talks about LNG prices being depressed. LNG capacity ramped up quickly in response to high prices a few years ago. Now there is a glut of LNG capacity, and prices are far below the cost of extraction and shipping for many LNG suppliers. At least temporary contraction seems likely in this sector.

If we look at World Bank Commodity Price data, we find that between 2011 and 2014, the inflation-adjusted price of Australian coal decreased by 41%. In the same period, the inflation-adjusted price of rubber is down 58%, and of iron ore is down 59%. With those types of price drops, we can expect huge cutbacks on production of many types of goods.


…click on the above link to read the rest of the article…

Charts showing the long-term GDP-energy tie (Part 2 – A New Theory of Energy and the Economy)

Charts showing the long-term GDP-energy tie (Part 2 – A New Theory of Energy and the Economy)

In Part 1 of this series, I talked about why cheap fuels act to create economic growth. In this post, we will look at some supporting data showing how this connection works. The data is over a very long time period–some of it going back to the Year 1 C. E.

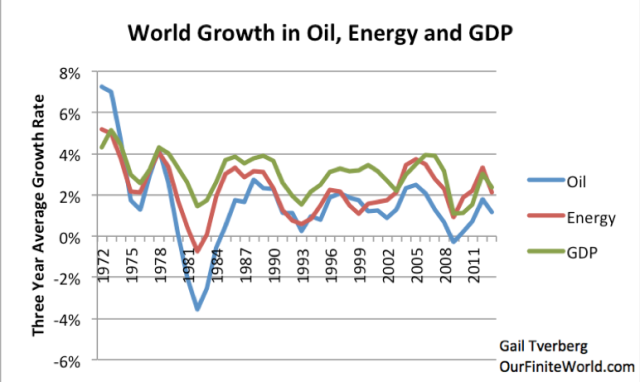
We know that there is a close connection between energy use (and in fact oil use) and economic growth in recent years.

Figure 1. Comparison of three-year average growth in world real GDP (based on USDA values in 2005$), oil supply and energy supply. Oil and energy supply are from BP Statistical Review of World Energy, 2014.

In this post, we will see how close the connection has been, going back to the Year 1 CE. We will also see that economies that can leverage their human energy with inexpensive supplemental energy gain an advantage over other economies. If this energy becomes high cost, we will see that countries lose their advantage over other countries, and their economic growth rate slows.

A brief summary of my view discussed in Part 1 regarding how inexpensive energy acts to create economic growth is as follows:

…click on the above link to read the rest of the article…

Gail Tverberg: This Is The Beginning Of The End For Oil Production

Gail Tverberg: This Is The Beginning Of The End For Oil Production

Why the shale collapse is ushering in a permanent turndown

With the recent collapse in the price of oil, Gail Tverberg, returns to discuss the likely impact on the US shale oil industry, as well as the global market for oil.

Gail is a professional actuary who applies classic risk assessment procedures to global resources: studying issues such as oil & natural gas depletion, water shortages, climate change, etc. These days, she writes at her website OurFiniteWorld.com.

While as an actuary, Gail is one to avoid hyperbole and the let the numbers speak, her analysis of the outlook for future oil production is nothing short of dire:

What we need is cheap energy. We need cheap, liquid oil. When it’s high-priced it really messes up the economy. We need oil to run our cars and to operate our trucks and such things, but it needs to be cheap. And it suddenly is today.

But, you have to be able to keep pulling it out at that same price. And the critical thing is, we can’t keep pulling it out at that price. What is going to happen, I’m afraid, is that once production goes down, we won’t be able to get it back up again.


…click on the above link to read the rest of the article…

Eight Pitfalls in Evaluating Green Energy Solutions | Our Finite World

Eight Pitfalls in Evaluating Green Energy Solutions | Our Finite World.

Does the recent climate accord between US and China mean that many countries will now forge ahead with renewables and other green solutions? I think that there are more pitfalls than many realize.

Pitfall 1. Green solutions tend to push us from one set of resources that are a problem today (fossil fuels) to other resources that are likely to be problems in the longer term.  

The name of the game is “kicking the can down the road a little.” In a finite world, we are reaching many limits besides fossil fuels:

…click on the above link to read the rest of the article…

Olduvai IV: Courage
Click on image to read excerpts

Olduvai II: Exodus
Click on image to purchase

Click on image to purchase @ FriesenPress