Home » Posts tagged 'john rubino' (Page 6)

Tag Archives: john rubino

Olduvai
Click on image to purchase

Olduvai III: Catacylsm
Click on image to purchase

Post categories

Post Archives by Category

Silver Looks Way Better Than Gold Right Now

Silver Looks Way Better Than Gold Right Now

Normally the action in the gold and silver futures markets tends to be pretty similar, since the same general forces affect both precious metals. When inflation or some other source of anxiety is ascendant, both metals rise, and vice versa.

But lately – perhaps in a sign of how confused the world is becoming – gold and silver traders have diverged. Taking gold first, the speculators – who tend to be wrong at major inflection points – remain extremely bullish. Commercial traders, meanwhile – who tend to be right when speculators are wrong – are extremely bearish, with short positions more than double their longs. Historically that’s been a setup for a big drop in gold’s price.

Viewed as a chart with the gray bars representing speculators and red bars the commercials, and where divergence is bearish and convergence bullish, the result is pretty ugly.

But now check out silver. Where gold futures speculators’ long positions are three times their short bets, silver spculators are actually more short than long. In other words, the people who are usually wrong are bearish. The commercials, meanwhile, are almost in balance, which is usually bullish for silver’s subsequent action.

Shown graphically, speculators and commercials are meeting the middle at zero, something that’s both very rare and very positive.

What does this mean? One possible explanation is that silver has gotten too cheap relative to gold and needs to be revalued. That could happen in several ways, with both metals rising but silver rising more, or both falling but silver falling less. Or with gold dropping while silver rises, as improbable as that seems.

As the chart below illustrates, gold has recently been rising relative to silver (or silver has been falling relative to gold) with the gold/silver ratio now close to 80, meaning that it takes 80 ounces of silver to buy one ounce of gold.

…click on the above link to read the rest of the article…

Consumers In Surprising Places Are Borrowing Like Crazy

Consumers In Surprising Places Are Borrowing Like Crazy

The Money Bubble is inflating at different speeds in different places. But apparently no culture is immune:

Household Debt Sees Quiet Boom Across the Globe

(Wall Street Journal) – A decade after the global financial crisis, household debts are considered by many to be a problem of the past after having come down in the U.S., U.K. and many parts of the euro area.But in some corners of the globe—including Switzerland, Australia, Norway and Canada—large and rising household debt is percolating as an economic problem. Each of those four nations has more household debt—including mortgages, credit cards and car loans—today than the U.S. did at the height of last decade’s housing bubble.

At the top of the heap is Switzerland, where household debt has climbed to 127.5% of gross domestic product, according to data from Oxford Economics and the Bank for International Settlements. The International Monetary Fund has identified a 65% household debt-to-GDP ratio as a warning sign.

In all, 10 economies have debts above that threshold and rising fast, with the others including New Zealand, South Korea, Sweden, Thailand, Hong Kong and Finland.

In Switzerland, Australia, New Zealand and Canada, the household debt-to-GDP ratio has risen between five and 10 percentage points over the past three years, paces comparable to the U.S. in the run-up to the housing bubble. In Norway and South Korea they’re rising even faster.

The IMF says a five percentage-point increase in household debt over a three-year period is associated with a hit to GDP growth of 1.25 percentage points three years down the road. The historical record suggests that large debts lead to a short-term economic boost but long-term struggles, as a greater share of the economy’s resources go to servicing the spending binge associated with high debts. The IMF also finds rising household debts are associated with greater risks of banking crashes and financial crisis.

…click on the above link to read the rest of the article…

Find The Sentence That Dooms Pension Funds (Don’t Worry, It’s Highlighted)

Find The Sentence That Dooms Pension Funds (Don’t Worry, It’s Highlighted)

The “pension crisis” is one of those things — like electric cars and nuclear fusion — that’s definitely coming but never seems to actually arrive. However, for pension funds the reason a crisis hasn’t yet happened is also the reason that it will happen, and soon:

The Risk Pension Funds Can’t Escape

(Wall Street Journal) – Public pension funds that lost hundreds of billions during the last financial crisis still face significant risk from one basic investment: stocks.That vulnerability came into focus earlier this month as markets descended into correction territory for the first time since February 2016. The California Public Employees’ Retirement System, the largest public pension fund in the U.S., lost $18.5 billion in value over a 10-day trading period ended Feb. 9, according to figures provided by the system.

The sudden drop represented 5% of total assets held by the pension fund, which had roughly half of its portfolio in equities as of late 2017. It gained back $8.1 billion through last Friday as markets recovered.

“It looks like 2018 is likely to be more turbulent than what we have experienced the last couple of years,” the fund’s chief investment officer, Ted Eliopoulos, told his board last Monday at a public meeting.

Retirement systems that manage money for firefighters, police officers, teachers and other public workers are increasingly reliant on stocks for returns as the bull market nears its ninth year. By the end of 2017, equities had surged to an average 53.6% of public pension portfolios from 50.3% one year earlier, according to figures released earlier this month by the Wilshire Trust Universe Comparison Service.

Those average holdings were the highest on a percentage basis since 2010, according to the Wilshire Trust Universe Comparison Service data, and near the 54.6% average these funds held at the end of 2007.

…click on the above link to read the rest of the article…

The World Embraces Debt At Exactly The Wrong Time

The World Embraces Debt At Exactly The Wrong Time

Self-destruction usually happens in stages. At first there’s a binge in which the thrill outweighs the sense of transgression. This is usually followed by remorse, acknowledgement of risks, and an attempt to reform.

But straight-and-narrow is exhausting, and because of this is frequently just temporary, eventually giving way to a kind of capitulation in which the addict drops even the pretense of self-control.

2018 is apparently the year in which the world enters this final stage of its addiction to debt. Wherever you look, leverage is soaring as governments, corporations and individuals just give up and embrace the idea that borrowing is no longer a necessary evil, but simply necessary. Some recent examples:

China January new loans surge to record 2.9 trillion yuan, blow past forecasts

(Reuters) – China’s banks extended a record 2.9 trillion yuan ($458.3 billion) in new yuan loans in January, blowing past expectations and nearly five times the previous month as policymakers aim to sustain solid economic growth while reining in debt risks.

Net new loans surpassed the previous record of 2.51 trillion yuan in January 2016, which is likely to support growth not only in China but may underpin liquidity globally as major Western central banks begin to withdraw stimulus.

Corporate loans surged to 1.78 trillion yuan from 243.2 billion yuan in December, while household loans rose to 901.6 billion yuan in January from 329.4 billion yuan in December, according to Reuters calculations based on the central bank data.

Outstanding yuan loans grew 13.2 percent in January from a year earlier, also faster than an expected 12.5 percent rise and compared with an increase of 12.7 percent in December.

———————–

Total US household debt soars to record above $13 trillion

(CNBC) – Total household debt rose by $193 billion to an all-time high of $13.15 trillion at year-end 2017 from the previous quarter, according to the Federal Reserve Bank of New York’s Center for Microeconomic Data report released Tuesday.

…click on the above link to read the rest of the article…

The Fed’s Impossible Choice, In Three Charts

The Fed’s Impossible Choice, In Three Charts

Critics of “New Age” monetary policy have been predicting that central banks would eventually run out of ways to trick people into borrowing money. There are at least three reasons to wonder if that time has finally come:

Wage inflation is accelerating
Normally, towards the end of a cycle companies have trouble finding enough workers to keep up with their rising sales. So they start paying new hires more generously. This ignites “wage inflation,” which is one of the signals central banks use to decide when to start raising interest rates. The following chart shows a big jump in wages in the second half of 2017. And that’s before all those $1,000 bonuses that companies have lately been handing out in response to lower corporate taxes. So it’s a safe bet that wage inflation will accelerate during the first half of 2018.


The conclusion: It’s time for higher interest rates.

The financial markets are flaking out
The past week was one for the record books, as bonds (both junk and sovereign) and stocks tanked pretty much everywhere while exotic volatility-based funds imploded. It was bad in the US but worse in Asia, where major Chinese markets fell by nearly 10% — an absolutely epic decline for a single week.

Normally (i.e., since the 1990s) this kind of sharp market break would lead the world’s central banks to cut interest rates and buy financial assets with newly-created currency. Why? Because after engineering the greatest debt binge in human history, the monetary authorities suspect that even a garden-variety 20% drop in equity prices might destabilize the whole system, and so can’t allow that to happen.

The conclusion: Central banks have to cut rates and ramp up asset purchases, and quickly, before things spin out of control.

…click on the above link to read the rest of the article…

Really Bad Ideas, Part 6: Money That “Rots And Rusts”

Really Bad Ideas, Part 6: Money That “Rots And Rusts”

In the next downturn (which may have started last week, yee-haw), the world’s central banks will face a bit of poetic justice: To keep their previous policy mistakes from blowing up the world in 2008, they cut interest rates to historically – some would say unnaturally — low levels, which doesn’t leave the usual amount of room for further cuts.

Now they’re faced with an even bigger threat but are armed with even fewer effective weapons. What will they do? The responsible choice would be to simply let the overgrown forest of bad paper burn, setting the stage for real (that is, sustainable) growth going forward. But that’s unthinkable for today’s monetary authorities because they’ll be blamed for the short-term pain while getting zero credit for the long-term gain.

So instead they’ll go negative, cutting interest rates from near-zero to less than zero — maybe a lot less. And their justifications will resemble the following, published by The Economist magazine last week.

Why sub-zero interest rates are neither unfair nor unnatural

When borrowers are scarce, it helps if money (like potatoes) rots.DENMARK’S Maritime Museum in Elsinore includes one particularly unappetising exhibit: the world’s oldest ship’s biscuit, from a voyage in 1852. Known as hardtack, such biscuits were prized for their long shelf lives, making them a vital source of sustenance for sailors far from shore. They were also appreciated by a great economist, Irving Fisher, as a useful economic metaphor.

Imagine, Fisher wrote in “The Theory of Interest” in 1930, a group of sailors shipwrecked on a barren island with only their stores of hardtack to sustain them. On what terms would sailors borrow and lend biscuits among themselves? In this forlorn economy, what rate of interest would prevail?

…click on the above link to read the rest of the article…

Finally, An Honest Inflation Index – Guess What It Shows

Finally, An Honest Inflation Index – Guess What It Shows

Central bankers keep lamenting the fact that record low interest rates and record high currency creation haven’t generated enough inflation (because remember, for these guys inflation is a good thing rather than a dangerous disease).

To which the sound money community keeps responding, “You’re looking in the wrong place! Include the prices of stocks, bonds and real estate in your models and you’ll see that inflation is high and rising.”

Well it appears that someone at the Fed has finally decided to see what would happen if the CPI included those assets, and surprise! the result is inflation of 3%, or half again as high as the Fed’s target rate.

New York Fed Inflation Gauge is Bad News for Bulls

(Bloomberg) – More than 20 years ago, former Fed Chairman Alan Greenspan asked an important question “what prices are important for the conduct of monetary policy?” The query was directly related to asset prices and whether their stability was essential for economic stability and good performance. No one has ever offered a coherent answer even though the recessions of 2001 and 2008-2009 were primarily due to a sharp correction in asset prices.A new underlying inflation gauge, or UIG, created by the staff of the New York Fed may finally provide the answer. Its broad-based measure of inflation includes consumer and producer prices, commodity prices and real and financial asset prices. The New York Fed staff concluded that the new inflation gauge detects cyclical turning points in underlying inflation and has a better track record than the consumer price series.

The latest reading shows inflation of almost 3 percent for the past 12 months, compared with 1.8 percent for the consumer price index and 1.8 percent for core consumer prices, which exclude food and energy. Since the broad-based UIG is advancing 100 basis points above CPI, it indicates that asset prices are large, persistent and reflect too easy monetary policy.

…click on the above link to read the rest of the article…

We Give Up! Government Spending And Deficits Soar Pretty Much Everywhere – John Rubino

We Give Up! Government Spending And Deficits Soar Pretty Much Everywhere - John Rubino

A recurring pattern of the past few decades involves governments promising to limit their borrowing, only to discover that hardly anyone cares. So target dates slip, bonds are issued, and the debts keep rising.

This time around the timing is especially notable, since eight years of global growth ought to be producing tax revenues sufficient to at least moderate the tide of red ink. But apparently not.

In Japan, for instance, government debt is now 250% of GDP, a figure which economists from, say, the 1990s, would have thought impossible.

Over the past decade the country’s leaders have proposed a series of plans for balancing the budget, and actually did manage to shrink debt/GDP slightly in 2016.

But now they seem to have given up, and are looking for excuses to keep spending:

Japan plans extra budget of $24-26 billion for fiscal 2017

(Hellenic Shipping News) – Japan’s government is set to compile an extra budget worth around 2.7-2.9 trillion yen ($24-26 billion) for the fiscal year to March 2018, with additional bond issuance of around 1 trillion yen to help fund the spending, government sources told Reuters. Following October’s big election win, Prime Minister Shinzo Abe’s cabinet has made plans to beef up childcare support, boost productivity at small and medium-sized companies, and strengthen competitiveness of the farm, fishery and forestry industries.

In the UK, a balanced budget has been pushed back from 2025 to 2031:

Britain in the red until 2031: Bid to balance the books pushed back yet again

(Daily Mail) – Philip Hammond’s ambition to get Britain’s finances back into the black receded further last night – as the Treasury watchdog said he would struggle to eliminate the deficit before 2031. The Chancellor had promised to balance the books by 2025. The target has been pushed back twice already, after George Osborne’s pledge in his 2010 Budget to balance the books ‘within five years’, before he revised the figure to 2020. 

…click on the above link to read the rest of the article…

Suddenly, “De-Dollarization” Is A Thing

Suddenly, “De-Dollarization” Is A Thing

For what seems like decades, other countries have been tiptoeing away from their dependence on the US dollar. China, Russia, and India have cut deals in which they agree to accept each others’ currencies for bi-lateral trade while Europe, obviously, designed the euro to be a reserve asset and international medium of exchange.

These were challenges to the dollar’s dominance, but they weren’t mortal threats.

What’s happening lately, however, is a lot more serious. It even has an ominous-sounding name: de-dollarization. Here’s an excerpt from a much longer article by “strategic risk consultant” F. William Engdahl:

Gold, Oil and De-Dollarization? Russia and China’s Extensive Gold Reserves, China Yuan Oil Market

(Global Research) – China, increasingly backed by Russia—the two great Eurasian nations—are taking decisive steps to create a very viable alternative to the tyranny of the US dollar over world trade and finance. Wall Street and Washington are not amused, but they are powerless to stop it.So long as Washington dirty tricks and Wall Street machinations were able to create a crisis such as they did in the Eurozone in 2010 through Greece, world trading surplus countries like China, Japan and then Russia, had no practical alternative but to buy more US Government debt—Treasury securities—with the bulk of their surplus trade dollars. Washington and Wall Street could print endless volumes of dollars backed by nothing more valuable than F-16s and Abrams tanks. China, Russia and other dollar bond holders in truth financed the US wars that were aimed at them, by buying US debt. Then they had few viable alternative options.

Viable Alternative Emerges
Now, ironically, two of the foreign economies that allowed the dollar an artificial life extension beyond 1989—Russia and China—are carefully unveiling that most feared alternative, a viable, gold-backed international currency and potentially, several similar currencies that can displace the unjust hegemonic role of the dollar today.

…click on the above link to read the rest of the article…

The Perfect Crash Indicator Is Flashing Red

The Perfect Crash Indicator Is Flashing Red

And what’s the first thing you sell when you lose your job and your stocks are tanking? That very same RV. Which makes new RV sales a useful indicator of our place in the business cycle.

What does it say now? Here you go:

Notice the mini-spike in the late 1990s and the major spike in mid-2000s, both of which were followed by corrections. Now note the mega-spike from 2010 and 2016.

And how are things going so far this year? Well, the space is on fire:

‘The RV space is on fire’: Millennials expected to push sales to record highs

(CNBC) – RV shipments are expected to surge to their highest level ever, according to a forecast from the Recreation Vehicle Industry Association.It would be the industry’s eighth consecutive year of gains.

Thor Industries and Winnebago Industries posted huge growth in their most recent earnings report.

Those shipments are accelerating, and should grow even more next year, the group said. Sales in the first quarter rose 11.7 percent from 2016.

Much of the growth can be attributed to strong sales of trailers, smaller units that can be towed behind an SUV or minivan, which dominate the RV market. The industry also is drawing in new customers.

As the economy has strengthened since the Great Recession, and consumer confidence improved, sales have picked up, said Kevin Broom, director of media relations for RVIA.

…click on the above link to read the rest of the article…

The Middle East Is Blowing Up

The Middle East Is Blowing Up

Every day brings another scary headline from the Middle East — which makes it easy to treat them as background noise rather than a clear and present danger. But the latest batch is reminiscent of the Balkans circa 1914, which means it may be time to tune back in. Some examples:

A US Navy jet shot down a Syrian warplane.Syria is a Russian client state, so this puts the US and Russia on opposite sides in a shooting war.

Russia warned the US that it takes the destruction of its client’s military assets seriously. It suspended the hot line Washington and Moscow have used to avoid collisions in Syrian airspace and threatened to target US aircraft.

Iran has begun launching missiles into Syria targeting ISIS. This is new in at least two ways: 1) Iran hasn’t used those particular missiles in decades, and 2) it was not previously active in Syria. This escalation from advising the Assad regime to actually killing people and blowing things up adds another player on Russia’s side against the US.

Iran and the US trade threats. US Secretary of State Rex Tillerson accused Iran of destabilizing the region and promised that the United States would support “those elements inside the Islamic Republic which would bring about peaceful government transition.” Iran called those remarks “unwise and clear meddling in Iran’s internal affairs.”

Saudi Arabia claimed to arrest members of Iran’s Revolutionary Guard who were attacking a Saudi offshore oil facility, and said that three of the attackers were being interrogated. One day later Iran accused Saudi Arabian border guards of opening fire on Iranian fishermen in the area, killing one of them.

…click on the above link to read the rest of the article…

Soaring Global Debt Sets Stage For “Unprecedented Private Deleveraging”

Soaring Global Debt Sets Stage For “Unprecedented Private Deleveraging”

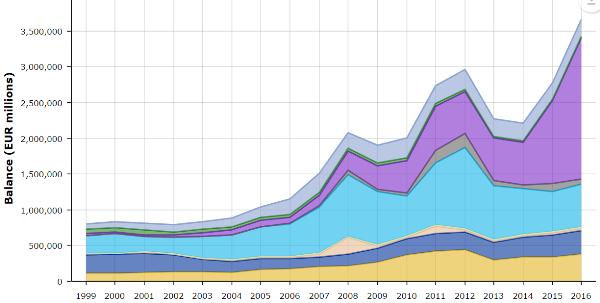
The UK’s Telegraph just published an analysis of global debt that pretty much sums up the coming crisis. Here’s an excerpt with a couple of the more hair-raising charts:

Global debt explodes at ‘eye-watering’ pace to hit £170 trillion

Global debt has climbed at an “eye-watering” pace over the past decade, soaring to a fresh high of £170 trillion last year, according to the Institute of International Finance (IIF).The IIF said total debt levels, including household, government and corporate debt, climbed by more than $70 trillion over the last 10 years to a record high of $215 trillion (£173 trillion) in 2016 – or the equivalent of 325pc of global gross domestic product (GDP).

It said emerging markets posed “a growing source of concern” to financial stability and the global economy as debt burdens in these countries climb at a rapid pace.

Growing vulnerabilities
The IIF data showed the increase was partly driven by a “spectacular rise” in emerging markets, where total debt stood at $55 trillion at the end of 2016, or 215pc of total emerging market GDP.

Debt has risen from $16 trillion in 2006 and $7.4 trillion in 1996.

The body, which represents the world’s top financial institutions, said a wave of maturing debt this year presented a “growing refinancing risk”.

It estimates that more than $1.1 trillion of emerging market bonds and loans will mature this year, with dollar-denominated debt accounting for a fifth of all redemptions.

The Bank of England’s Financial Policy Committee (FPC) said on Tuesday that credit in China continued to grow at a “rapid” pace.

Corporate credit in the world’s second largest economy has climbed to 166pc of nominal GDP.

The IMF at the end of last year warned of broader risks to the global economy.

…click on the above link to read the rest of the article…

Maybe The Recovery Wasn’t Real After All

Maybe The Recovery Wasn’t Real After All

Then it all started to evaporate. Lackluster manufacturing and consumer spending reports sent the Atlanta Fed’s reading of Q1 GDP off a cliff to less than 1%:

And this morning the Wall Street Journal highlighted some recent changes in the yield curve that point towards further slowing:

Flatter Yield Curve in 2017 Shows Growth Concern Lingers

Long-term Treasury yields have declined modestly, while short-term yields have risen.A flattening of the Treasury yield curve in 2017 is a worrying sign for investors banking on resurgent U.S. inflation and growth.

Long-term Treasury yields, which are largely driven by the U.S. economic and inflation outlook, have declined modestly this year, following a sharp rise in the wake of the November election of Donald Trump as president. The 10-year U.S. Treasury yield has fallen to 2.396% from 2.446% at the end of 2016.

At the same time, short-term yields, which are more influenced by monetary policy, have risen in 2017 as Federal Reserve officials have made clear that they expect to continue raising the fed-funds rate through the rest of the year.
As a result, the yield premium on the 10-year note relative to the two-year note—known in the market as the 2-10 spread—slipped Wednesday to 1.107 percentage points, its lowest level since the election.

FIRST QUARTER REPORT CARD
While the yield curve, like all market indicators, is subject to the ebb and flow of investor sentiment, economic data and political developments, a flattening yield curve gets special attention from investors world-wide because it can serve as an early signal of both economic slowing and overpricing in riskier asset classes.

…click on the above link to read the rest of the article…

2016 Debt Binge Produces (Surprise!) 2017 Inflation. Guess What That Means For 2018?

2016 Debt Binge Produces (Surprise!) 2017 Inflation. Guess What That Means For 2018?

Swiss inflation rises at highest monthly rate in 5 years 

China February producer inflation fastest in nearly nine years 

Year-over-year import prices at highest level in five years 

ECB keeps bond-buying, rates unchanged amid inflation flare-up 

Food inflation doubles in a month as UK shoppers start to feel the pinch 

What happened? Well, towards the end of 2015 most of the world’s major governments apparently got spooked by deflation and decided to ramp up their borrowing and money creation. China, for instance, generated the following stats in 2016:

  • New loans totaling 12.65 trillion yuan, or $1.8 trillion.
  • M2 money supply growth of 11%.
  • Debt-to-GDP ratio jump from 254% to 277%.

In Europe, the European Central Bank ramped up its bond buying program, pumping about a trillion newly-created euros into the Continental economy:

And the US increased its federal government debt by over $1 trillion, presumably spending the proceeds on things that raise wages or increase the demand for commodities.

Since there’s no way for the growth of global production to match this blistering pace of new money creation, the result is higher prices for just about everything. Oil and most other industrial materials are more expensive, wages are rising, long-term interest rates (the cost of money) are up; you name it, it went up in the past year.

What comes after a debt-driven spike in inflation? History is pretty clear on this one: instability, as rising interest rates spook the fixed income markets and rising business costs spook stock speculators.

…click on the above link to read the rest of the article…

Alan Greenspan: Ron Paul Was Right About The Gold Standard

Alan Greenspan: Ron Paul Was Right About The Gold Standard

As John Rubino eloquently puts it, “when the history of these times is written, former Fed Chair Alan Greenspan will be one of the major villains, but also one of the greatest mysteries. This is so because he has, in effect, been three different people.” Greenspan started his public life brilliantly, as a libertarian thinker who said some compelling and accurate things about gold and its role in the world. An example from 1966: “This is the shabby secret of the welfare statists’ tirades against gold. Deficit spending is simply a scheme for the confiscation of wealth. Gold stands in the way of this insidious process. It stands as a protector of property rights. If one grasps this, one has no difficulty in understanding the statists’ antagonism toward the gold standard.”

Yet everything changed a few decades later when Greenspan was put in charge of the Federal Reserve in the late 1980s, instead of applying the above wisdom, for example by limiting the bank’s interference in the private sector and letting market forces determine winners and losers, he did a full 180, intervening in every crisis, creating new currency with abandon, and generally behaving like his old ideological enemies, the Keynesians. Predictably, debt soared during his long tenure.

Along the way he was also instrumental in preventing regulation of credit default swaps and other derivatives that nearly blew up the system in 2008. His view of those instruments:

The reason that growth has continued despite adversity, or perhaps because of it, is that these new financial instruments are an increasingly important vehicle for unbundling risks.

…click on the above link to read the rest of the article…

Olduvai IV: Courage
Click on image to read excerpts

Olduvai II: Exodus
Click on image to purchase

Click on image to purchase @ FriesenPress