Home » Posts tagged 'gdp' (Page 6)

Tag Archives: gdp

Olduvai
Click on image to purchase

Olduvai III: Catacylsm
Click on image to purchase

Post categories

Post Archives by Category

Global GDP Still Propped Up By A Massive Amount Of Debt

Global GDP Still Propped Up By A Massive Amount Of Debt

While the government agencies and economists continue to publish strong GDP figures, they seem to overlook how much debt it took to produce that growth.  Or should I say, the “supposed growth.”  The days of adding one dollar of debt to get one dollar of GDP growth have been long gone for more than 40 years.  And, as global debt has increased, it has forced governments to lower interest rates.

Yes, it’s really that simple.  I get a good chuckle when I hear analysts talk about rising interest rates to 10-15%.  If the U.S. Government interest rate on the Treasury Bonds increased to just 5%, Uncle Sam would be paying over a trillion dollars a year just to service the debt.  So, no… we aren’t going to see 10-15% rates again.

Well, we could… but, most of the global debt would have to collapse or be forgiven.  Unfortunately, if global debt vaporizes or is forgiven, then the entire economy collapses as well.  We must remember, GDP growth is also driven by oil production growth.  There is no way in HADES that the oil industry can fund future production with 10-15% interest rates.  IT JUST AIN’T GONNA HAPPEN.

Why?  If it weren’t for the Fed dropping rates down to nearly zero, the Great U.S. Shale Oil Ponzi Scheme and the six million barrels per day of unprofitable shale oil production would have been a pipe dream.  I can assure you that the shale oil industry could not fund operations or service their debt with 10-15% interest rates.

Most shale oil companies are paying on average between 4-5% interest to service their debt.  If the companies’ interest rates double or triple, then it would make it extremely difficult to service the shale industry debt that is estimated to be $280-$300 billion.

…click on the above link to read the rest of the article…

Why we get bad diagnoses for the world’s energy-economy problems

Why we get bad diagnoses for the world’s energy-economy problems

The world economy seems to be seriously ill. The problem is not overly high oil prices, but that does not rule out energy as being a major underlying problem.

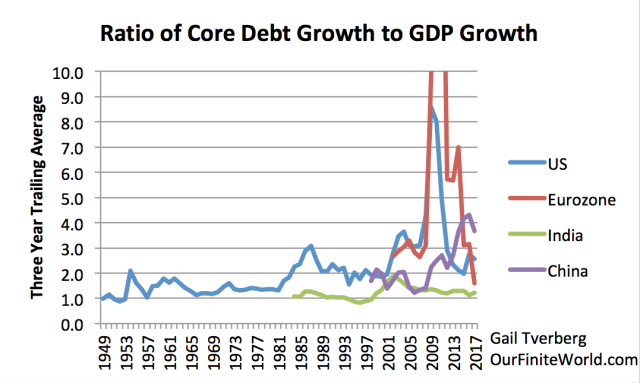
Two of the symptoms of the economy’s malaise are slow wage growth and increasing wage disparity. Tariffs are being added as solutions to these issues. Radical leaders are increasingly being elected. The Bank for International Settlements and the International Monetary Fund have raised concerns about the world’s aggregate debt levels. The IMF has even suggested that a second Great Depression might be ahead if major banks should fail in the manner that Lehman Brothers did in 2008.

Figure 1. Ratio of Core Debt Growth (non-financial debt including governmental debt) to GDP, based on data of the Bank of International Settlements.

If the economy were a human being, we would send it to a physician for a diagnosis regarding what is wrong. What really is needed is a physician who has a wide overview, and thus can understand the many symptoms. Hopefully, the physician can also provide a reasonable prognosis of what lies ahead.

Individual specialists studying the world’s economic and energy problems tend to look at these problems from narrow points of view. Some examples include:

  •  Curve fitting and cycle analysis using economic data by country since World War II, as is often performed by economists
  • Analysis of oil supply based on technically recoverable reserves or resources
  • Analysis of fresh water supply problems
  • Analysis of population problems, including rising population relative to arable land, and rising retiree population relative to working population
  • Analysis of ocean problems, including rising acidity and depleting fish stocks
  • Analysis of the expected impact of CO2 production from fossil fuels on climate
  • Analysis of rising debt levels

…click on the above link to read the rest of the article…

The Fourth Turning & War of the Worlds

THE FOURTH TURNING & WAR OF THE WORLDS

Image result for fake news cnn Image result for illegal immigrant invasion

Image result for bomb hoax Image result for fourth turning war

“In retrospect, the spark might seem as ominous as a financial crash, as ordinary as a national election, or as trivial as a Tea Party. The catalyst will unfold according to a basic Crisis dynamic that underlies all of these scenarios: An initial spark will trigger a chain reaction of unyielding responses and further emergencies. The core elements of these scenarios (debt, civic decay, global disorder) will matter more than the details, which the catalyst will juxtapose and connect in some unknowable way. If foreign societies are also entering a Fourth Turning, this could accelerate the chain reaction. At home and abroad, these events will reflect the tearing of the civic fabric at points of extreme vulnerability – problem areas where America will have neglected, denied, or delayed needed action.” – The Fourth Turning – Strauss & Howe

The paragraph above captures everything that has happened, is happening, and will happen during this Fourth Turning. It was written over two decades ago, but no one can deny its accuracy regarding our present situation. The spark was a financial crash. The response to the financial crash by the financial and governmental entities, along with their Deep State co-conspirators who created the financial collapse due to their greed and malfeasance, led to the incomprehensible election of Donald Trump, as the deplorables in flyover country evoked revenge upon the corrupt establishment.

The chain reaction of unyielding responses by the left and the right accelerates at a breakneck pace, with absolutely no possibility of compromise. A new emergency or winner take all battle seems to be occurring on a weekly basis, with the mid-term elections as the likely trigger for the next phase of this Fourth Turning.

…click on the above link to read the rest of the article…
Here’s a Simple Solution to the Growth/De-Growth Debate

HERE’S A SIMPLE SOLUTION TO THE GROWTH/DE-GROWTH DEBATE

A number of high-profile economists – people like Carlota Perez and Michael Liebreich – have recently come out swinging in favor of “green growth” theory, trying to assuage mounting public concerns about the fact that climate change and ecological breakdown are being driven by capitalist growth.

What’s interesting about these interventions is that they explicitly pit themselves against their opposite – the idea of de-growth.  Even just a year or two ago, de-growth wouldn’t have been part of the conversation.  Once the province of ecological economists, it’s now gaining more mainstream attention as the evidence against growth mounts – and orthodox economists have no choice but to reckon with it.

But as they try to edge their way around certain prickly facts, their arguments get stranger and stranger.

Green growth theory relies on the assumption that GDP growth can be permanently and absolutely decoupled from resource use and emissions, and at a pace that’s fast enough to reverse ecological breakdown and keep us under 1.5 degrees, so that GDP can continue growing forever while environmental impacts decline.

There’s just one problem.  There’s no evidence that this is feasible.

Let’s start with emissions.  Fortunately, we know that GDP can be absolutely decoupled from emissions.  The real question is whether we can decarbonize fast enough to stay under 1.5 degrees, without relying on fanciful negative emissions technologies.  The answer, sadly, is no.  If we carry on with growth as usual, we need to decarbonize at a rate of 11% per year. That’s more than five times faster than the historic rate of decarbonization and about three times faster than what scientists project is possible, even under highly optimistic conditions.

…click on the above link to read the rest of the article…

Degrowth: A Call For Radical Abundance

When orthodox economists first encounter the idea of degrowth, they often jump to the conclusion that the objective is to reduce GDP.  And because they see GDP as equivalent to social wealth, this makes them very upset.

Nothing could be further from the truth.

I reject the fetishization of GDP as an objective in the existing economy, so it would make little sense for me to focus on GDP as the objective of a degrowth economy.  Wanting to cut GDP is as senseless as wanting to grow it.

The objective, rather, is to scale down the material throughput of the economy.  From an ecological standpoint, that’s what matters.  And indeed some orthodox economists might even agree.  Where we differ is that while they persist in believing (against the evidence) that this can be done while continuing to grow GDP, I acknowledge that it is likely to result in a reduction of GDP, at least as we presently measure it.  In other words, if we were to keep measuring the economy by GDP, that’s what we would see in a degrowth scenario.

And that’s okay.

It’s okay, because we know that human beings can thrive without extremely high levels of GDP.

There are many pieces to this argument, but I want to focus on one here in particular.  One of the core claims of degrowth economics is that by restoring public services and expanding the commons, people will be able to access the goods that they need to live well without needing high levels of income.

Take London, for instance.  Housing prices in London are astronomically high, to the point where a normal one-bedroom flat can cost upwards of $1 million.

…click on the above link to read the rest of the article…

We Should Ditch GDP as a Measure of Economic Activity

This article exposes the false economic concepts behind GDP, which is only the visible tip of a large iceberg of economic deceit. Describing an increase in GDP as economic growth owes its meagre validity to imprecise definition. An economy does not grow, only the quantity of fiat currency deployed grows. A successful economy progresses our condition, our wealth, our standards of living. The evolution of misleading statistics such as GDP to their current condition is only governed by their usefulness to governments, not as an objective development of sound theory by seekers of truth.

There are perhaps two plausible reasons for producing the GDP statistic, other than employing statisticians, and both have nothing to do with economics. By compiling the figures, a government keeps track of its tax base, and it can enter into the game of my-country-is-bigger-than-yours.

In international comparisons of economic performance, gross domestic product adjusted for price inflation is the most common metric used. Countries are ranked by size, and success is measured by the rate of growth in GDP. This is important to the political class.

About two years ago, I was told that the Indonesian central bank had a plan to do away with cash entirely, because it would bring unrecorded transactions into Indonesia’s GDP, promoting it from sixteenth to perhaps the thirteenth largest nation measured by GDP. I have no idea if this was true, but allegedly, this was important to the Indonesian government.

We should not be surprised if going cashless is partly motivated to give the illusion of GDP growth, in the same way that in 2014 the EU decided to add in estimated contributions from prostitution and drug dealing. These are examples of why and how GDP is manipulated to produce a goal-sought answer.

…click on the above link to read the rest of the article…

US Gross National Debt Jumps by $1.27 Trillion in Fiscal 2018, Hits $21.5 Trillion

US Gross National Debt Jumps by $1.27 Trillion in Fiscal 2018, Hits $21.5 Trillion

But wait — these are the Boom Times!

The US gross national debt jumped by $84 billion on September 28, the last business day of fiscal year 2018, the Treasury Department reported Monday afternoon. During the entire fiscal year 2018, the gross national debt ballooned by $1.271 trillion to a breath-taking height of $21.52 trillion.

Just six months ago, on March 16, it had pierced the $21-trillion mark. At the end of September 2017, it was still $20.2 trillion. The flat spots in the chart below, followed by the vertical spikes, are the results of the debt-ceiling grandstanding in Congress:

These trillions are whizzing by so fast they’re hard to see. What was that, we asked? Where did that go?

Over the fiscal year, the gross national debt increased by 6.3% and now amounts to 105.4% of current-dollar GDP.

But this isn’t the Great Recession when tax revenues collapsed because millions of people lost their jobs and because companies lost money or went bankrupt as their sales collapsed and credit froze up; and when government expenditures soared because support payments such as unemployment compensation and food stamps soared, and because there was some stimulus spending too.

But no – these are the good times. Over the last 12-month period through Q2, the economy, as measured by nominal GDP grew 5.4%. “Nominal” GDP rather than inflation-adjusted (“real”) GDP because the debt isn’t adjusted for inflation either, and we want an apples-to-apples comparison.

The increases in the gross national debt have been a fiasco for many years. Even after the Great Recession was declared over and done with, the gross national debt increased on average by $954 billion per fiscal year from 2011 through 2017.

…click on the above link to read the rest of the article…

Strong GDP Data and Individuals’ Wellbeing

In the New York Times September 14 2018 in an article – We’re Measuring The Economy All Wrong, the writer of the article David Leonhardt complains that despite strong gross domestic product data (GDP) most people don’t feel it. The writer of the article argues that,

The trouble is that a handful of statistics dominate the public conversation about the economy despite the fact that they provide a misleading portrait of people’s lives. Even worse, the statistics have become more misleading over time.

According to the accepted rules of thumb, recessions are about at least two quarters of negative growth in real gross domestic product (GDP). Recessions, according to this way of thinking, are seen as something associated with the so-called strength of the economy. The stronger an economy is the less likely it is to fall into a recession. The major cause of recessions is seen as various shocks, such as a sharp increase in the price of oil or some disruptive political events, or natural disasters or a sudden fall in consumer outlays on goods and services. Obviously then, if an economy is strong enough to cope with these shocks then recessions can be prevented, or at least made less painful. For instance, a well-managed company with a well-managed inventory is likely to withstand the effects of various shocks versus a poorly managed company.

Severity of a recession and the strength of the economy

We suggest that recessions are not about two quarters of negative growth in real GDP, or declines in various economic indicators as such. They are also not about successful inventory management. We would suggest that recessions are not about how resilient an economy is to various external and internal shocks.

…click on the above link to read the rest of the article…

There Goes The Credit Impulse: Why Chinese Consumption Is On The Verge Of Collapse

Recently we discussed how in addition to the widely manipulated Chinese GDP data, new concerns had emerged about official data involving Chinese industrial profits, because while China’s National Bureau of Statistics has traditionally reported positive year-on-year growth rates in percentage terms, growth in absolute yuan terms has been negative. This deviation, which barely happened in the past, has reinforced scepticism over the quality of Chinese “data” and fueled fresh suspicion that the NBS generates data outcomes that match the policy goals of the Chinese government leadership instead of reflecting the true state of the economy.

More recently, similar worries have been noted over China’s consumption data, which have been sending what Goldman politely calls “mixed signals lately”, and which a more cynical take would dub “massaged”, if not outright fabricated. Which, with China’s economy increasingly turning into a consumption-driven model like that of the US, is a problem if economists, analysts and investors are unable to get an accurate grasp on consumption trends in the world’s second largest economy.

The problem in a nutshell: NBS retail sales slowed in Q2 and also in July, while NBS household consumption expenditure and GDP final consumption contribution (quarterly data) rebounded relatively strongly in Q2. Other widely observed consumption data include 100 major retailers’ sales, with the data painting a bearish picture in recent months and showing negative year-over-year growth in July.

This, as Goldman notes in a Saturday report, has led many investors to ask: where does the divergence come from and how has consumption been growing in reality?

…click on the above link to read the rest of the article…

Turkey: A harbinger of a global debt crisis?

The economic crisis brewing in Turkey seems to have surprised many. This was probably, at least partly, due to the ‘period of tranquility’ created by the central banks with theirs ‘unorthodox measures’. Many seem to have imagined that the “synchronized global growth” spurt were here to last. But, it was just a mirage, run by the stimulus of China and the major central banks.

As we warned in May, the global quantitative tightening will bring an end to the current business cycle. This is for a multitude of reasons (see Q-review 1/2018), but the most pressing of them is the fact that QT will raise interest rates and suppress liquidity. It will raise the costs of indebted companies, drive zombie companies to insolvency and ultimately crash the asset markets. A global debt crisis of epic proportions and depression are likely to follow. Turkey is showing what it might look like.

The debt conundrum

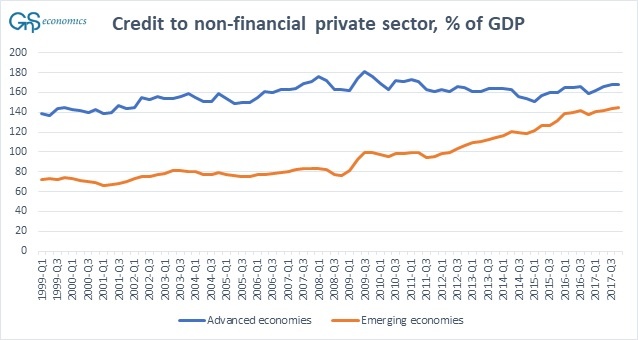
The current business cycle has had two exceptional features. First has been the steep rise in the balance sheets of central banks and the second the very fast growth of the non-financial sector debt, especially in the emerging economies. Figure 1 presents the private non-financial sector debt as a percentage of GDP in advanced and emerging economies. It shows the miniscule deleveraging in advanced economies and the harrowing rise in the private non-financial debt in the emerging economies since 2009.

Figure 1. Credit (debt) to non-financial private sector as a share of GDP in advanced and emerging economies. Source: GnS Economics, BIS

The rise of the non-financial private debt in emerging economies coincides with the QE programs of the major central banks.

…click on the above link to read the rest of the article…

If the Economy is So Good, Why are Wages Flat?

If the Economy is So Good, Why are Wages Flat?

Photo by Nathaniel St. Clair

We are supposedly seven years into a “recovery” from the global economic collapse that commenced in 2008. The latest evidence offered to promote this oft-peddled mantra is that U.S. gross domestic product showed a strong uptick for the second quarter of 2018, an annualized rate of 4.1 percent, nearly double that of the first quarter.

Coupled with the ongoing decline in unemployment (although standard unemployment rates greatly underestimate the true rate of employment), orthodox economists, conservative propagandists and apologists for the Trump administration would have use believe happy days are here again.

So why aren’t our wages increasing?

In part, it is because the true unemployment rate is not nearly so low as the “official” unemployment rate used by governments around the world, and thus the ranks of unemployed and underemployed are sufficiently large that there is no upward pressure on wages. Orthodox economists, dedicated as they are to ignoring any evidence that doesn’t match their models designed to “prove” that all manners of capitalist excess are as natural as the tides of the ocean — and thus in practice the professional wing of conservative propagandists — have various excuses for stagnant wages and ever increasing inequality. A favorite among these is an alleged “skills mismatch” — too many unskilled workers and a shortage of skilled workers for the high-tech jobs of today.

The data tells a different story, however. A 2014 report by the National Employment Law Project found that low-wage jobs were created at a faster pace than higher-paid jobs were lost in the first years to that point. The Project reported this breakdown:

* Lower-wage industries ($9.48 per hour to $13.33) constituted 22 percent of the 2008-2010 losses, but 44 percent of jobs gained since then.

…click on the above link to read the rest of the article…
Weekly Commentary: $247 Trillion and (Rapidly) Counting

Weekly Commentary: $247 Trillion and (Rapidly) Counting

I chronicled mortgage finance Bubble excess on a weekly basis. Relevant data were right there in plain sight, much of it courtesy of the Federal Reserve. Yet only after the Bubble burst did it all suddenly become obvious. Flashing warning signs were masked by manic delusions of endless prosperity and faith in the almighty “inside the beltway”. These days, data for the global government finance Bubble is not as easily-accessible, though there is ample evidence for which to draw conclusions. It will all be frustratingly obvious in hindsight.

The Institute of International Finance is out with their latest data that, unfortunately, is not made available in detail to the general public. Global debt ended the first quarter at a record $247 Trillion, or 318% of GDP. Even after a decade of historic Credit inflation, global debt continues to expand at (“Terminal Phase”) double-digit rates (11.1% y-o-y).

Global debt growth accelerated during the first quarter to $8.0 Trillion – and surged $30 Trillion over just the past five quarters. In a single data point not to be disregarded, Global Debt Has Expanded (a difficult to fathom) $150 Trillion, or 150%, Over the Past Ten Years. Actually, the trajectory of Bubble-period Credit expansion may seem rather familiar. It’s been, after all, a replay of the reckless U.S. mortgage Credit episode, only on a much grander global scale.

July 10 – Financial Times (Jonathan Wheatley): “The amount of debt in the world increased by nearly $25tn in the year to the end of March, piling more pressure on a global financial system already struggling to deal with rising US interest rates, widening spreads for borrowers and a strengthening US dollar. The Institute of International Finance… said total debts owed by households, governments and financial and non-financial corporations amounted to $247.2tn at the end of March, up from $222.6tn a year earlier and an increase of nearly $8tn in the first quarter alone.

…click on the above link to read the rest of the article…

Canada’s Real Estate Sector Faces Difficult Transition

The great Canadian real estate bull market has pushed home prices to dizzying heights over the past two decades. And with ever-rising prices it has sucked in more capital and resources creating an almost self enforcing feedback loop, where an entire economy has become dependent on rising house prices. This misallocation of capital and resources is particularly well documented in the labour force where every year the number of realtors, mortgage brokers, and homebuilders seems to grow exponentially. Per Stats Canada, the share of employment tied to construction as well as finance, insurance and real estate is nearly two standard deviations above its long-term average.

I’m no economist but somehow it seems building an economy dependant on selling each other more expensive homes is probably not the greatest long term growth strategy. To illustrate this point we can see here that residential investment as a percentage of GDP now outpaces investment in machinery equipment research and development.

Source: Ben Rabidoux, North Cove Advisors

Currently there are over 55,000 new homes under construction across BC, with a record high number of housing starts also underway. This has created a massive shortage in the trades sector, while sending construction costs and house prices higher. However, with the real estate market across BC now beginning to slow, particularly in greater Vancouver, which saw housing sales across all property types drop to a 17 year low, early indications suggest a potential difficult transition may be underway.  With the help of Ben Rabidoux of North Cove advisors, we can see that job growth in British Columbia is been in a funk in recent months.

BC job growth
Source: Ben Rabidoux, North Cove Advisors

For simplicity sake, we can estimate how this would affect the real estate broker space, where real estate commissions now command 2% of Canadian GDP. Through the first four months of 2018, British Columbians have spent nearly $2 billion less on residential real estate.

…click on the above link to read the rest of the article…

Areas Of The World More Vulnerable To Collapse

Areas Of The World More Vulnerable To Collapse

Certain areas of the world are more vulnerable to economic and societal collapse.  While most analysts gauge the strength or weakness of an economy based on its outstanding debt or debt to GDP ratio, there is another factor that is a much better indicator.  To understand which areas and regions in the world that will suffer a larger degree of collapse than others, we need to look at their energy dynamics.

For example, while the United States is still the largest oil consumer on the planet, it is no longer the number one oil importer.  China surpassed the United States by importing a record 8.9 million barrels per day (mbd) in 2017.  This data came from the recently released BP 2018 Statistical Review.  Each year, BP publishes a report that lists each countries’ energy production and consumption figures.

BP also lists the total oil production and consumption for each area (regions and continents).  I took BP’s figures and calculated the Net Oil Exports for each area.  As we can see, the Middle East has the highest amount of net oil exports with 22.3 million barrels per day in 2017:

The figures in the chart above are shown in “thousand barrels per day.”  Russia and CIS (Commonwealth Independent States) came in second with 10 mbd of net oil exports followed by Africa with 4 mbd and Central and South America with 388,000 barrels per day.  The areas with the negative figures are net oil importers.

The area in the world with the largest net oil imports was the Asia-Pacific region at 26.6 mbd followed by Europe with 11.4 mbd and North America (Canada, USA & Mexico) at 4.1 mbd.

Now, that we understand the energy dynamics shown in the chart above, the basic rule of thumb is that the areas in the world that are more vulnerable to collapse are those with the highest amount of net oil imports.

…click on the above link to read the rest of the article…

Do We Really Borrow From Only Ourselves? Does the Debt/GDP Ratio Means Anything?

QUESTION: Mr. Armstrong, the famous economist Paul Krugman says that debt is ok when we owe it to ourselves. He calls it “deficit scolding” as he wrote in the New York Times. Would you like to comment on this statement?

GH

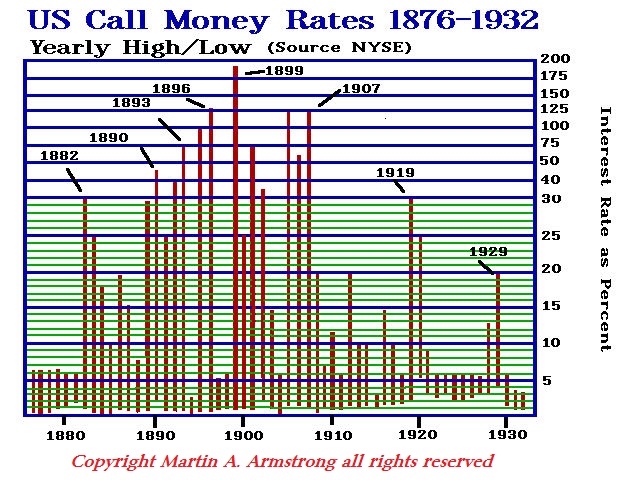
ANSWER: Paul Krugman seems to lack any historical understanding of how nations rise and fall. Anyone who claims debt is OK and can be infinite because “we” owe it to ourselves is clueless. He wrote in the article you referred to that “we have a more or less stable ratio of debt to GDP, and no hint of a financing problem.” The debt to GDP ratio is interesting but totally irrelevant. China’s debt to GDP stands at 250%, the USA at 103%, and Greece buckled at 186%. Obviously, this ratio is rather meaningless as a forecasting tool. I have published this chart on call money rates previously. In my studies, I quickly discovered that you cannot reduce the cause of any effect to a single issue. We can see that the peak in call money rates took place during 1899 and it was the lowest in 1929 when the Great Depression hit. You can’t even claim that if interest rates hit some magical level the stock market would crash. The world is far more complicated than just this one-dimensional approach to everything.

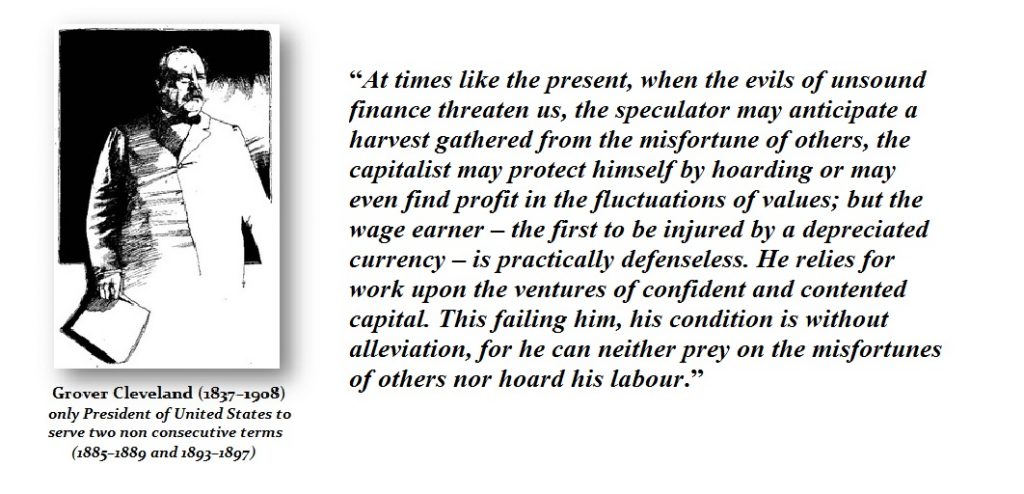
Capital flows were fleeing the USA in 1899 so interest rates went higher with a shortage of money. In 1929, the capital was in the USA for it rushed here because of World War I. The inflow of capital created an excess so the peak in call money rates was lower than 1899 when capital was fleeing. We even have the world of President Grover Cleveland from the Panic of 1893 commenting on the net capital outflow because of the “unsound” financial policy of the Silver Democrats.

…click on the above link to read the rest of the article…

Olduvai IV: Courage
Click on image to read excerpts

Olduvai II: Exodus
Click on image to purchase

Click on image to purchase @ FriesenPress