Home » Posts tagged 'gdp' (Page 4)
Tag Archives: gdp
GDP Estimates Crash on Dismal Economic Reports
GDP Estimates Crash on Dismal Economic Reports

GDP Estimates are well below 1.0% following industrial production and retail sales estimates.
The GDPNow model forecast for the fourth quarter took a dive today to 0.3% from 1.0% a week ago. Similarly, the Nowcast model fell to 0.4% from 0.7%.
Pat Higgins at GDPNow explains:
“The GDPNow model estimate for real GDP growth (seasonally adjusted annual rate) in the fourth quarter of 2019 is 0.3 percent on November 15, down from 1.0 percent on November 8. After this morning’s retail trade releases from the U.S. Census Bureau, and this morning’s industrial production report from the Federal Reserve Board of Governors, the nowcasts of fourth-quarter real personal consumption expenditures growth and fourth-quarter real gross private domestic investment growth decreased from 2.1 percent and -2.3 percent, respectively, to 1.7 percent and -4.4 percent, respectively.”
Real gross private domestic development is now clocking at -4.4%.
Wow.
Recession Warnings
A bit ago I noted Industrial Production Dives and It’s Not All Strike Related.
Trucking provide another recession warning: Freight Volumes Negative YoY for 11th Straight Month
Donald Broughton, founder of Broughton Capital and author the Cass Freight Index says the index signals contraction, possibly by the end of the year. That’s just one one month away.
Strike Resolved
The GM strike is resolved. We will soon find out how much strike-related damage there was, but the risk is over-estimating the rebound going forward.
The trade deal with China is still unresolved.
World Debt Downgrade Warning – Moody’s
World Debt Downgrade Warning – Moody’s

◆ A World Debt Downgrade Warning (WDDW) has been issued by credit rating agency Moody’s due to deepening global geopolitical uncertainty and risks
◆ Moody’s has issued a debt downgrade warning to the entire world on fears that severe political turmoil from London to Hong Kong poses a threat to the global economy (see News below)
◆ Moody’s have a bleak outlook for government debt amid political instability in a report published just this Monday
◆ Moody’s said political and geopolitical turbulence is exacerbating a slowdown in national and global GDP growth, aggravating structural ‘bottlenecks’ centred on massive banking and sovereign debt and increasing the risk of economic or financial shocks
◆ Moody’s identified the emergence of influential “populist” movements and suggested this is undermining the effectiveness of domestic policy, weakening institutional strength and compounding social and governance risks
◆ “Overall, the global environment is becoming less predictable for the 142 sovereigns we rate, encompassing $63.2 trillion in debt outstanding,” according to the report
NEWS and COMMENTARY
Moody’s issues debt downgrade warning to the entire world
Moody’s offers bleak outlook for government debt amid political instability
Moody’s has negative outlook for sovereigns
Gold firms as doubts over U.S.-China trade deal curb risk appetite
China likely to ‘intervene’ in Hong Kong’s affairs more following the protests (BAML)Trump says China trade deal ‘close’ but dashes hopes for signing details
Global trade is likely contracting and we’re now ‘betting’ on a US-China deal, OECD chief says
China’s gold-backed crypto looming as ‘Pearl Harbor type event’ for US dollar in 2020 – Keiser Report

GOLD PRICES (LBMA – USD, GBP & EUR – AM/ PM Fix)
12-Nov-19 1455.00 1452.05, 1134.03, 1130.42 & 1319.69 1318.17
11-Nov-19 1465.50 1458.70, 1144.41 1132.39 & 1328.33 1321.87
08-Nov-19 1466.85 1464.15, 1144.58 1142.62 & 1328.09 1328.13
07-Nov-19 1484.10 1484.25, 1153.44 1156.82 & 1339.40 1341.76
06-Nov-19 1488.55 1486.05, 1155.26 1154.51 & 1342.23 1341.31
05-Nov-19 1504.60 1488.95, 1166.37 1156.17 & 1352.18 1344.67
04-Nov-19 1509.20 1509.45, 1168.57 1169.52 & 1352.39 1353.98
01-Nov-19 1509.85 1508.80, 1165.76 1164.49 & 1354.79 1351.28
31-Oct-19 1506.40 1510.95, 1163.09 1168.57 & 1348.53 1356.53
How the GDP Framework Creates the Illusion That By Means of Money Pumping the Central Bank Can Grow an Economy
HOW THE GDP FRAMEWORK CREATES THE ILLUSION THAT BY MEANS OF MONEY PUMPING THE CENTRAL BANK CAN GROW AN ECONOMY
In response to a weakening in the yearly growth rate of key economic indicators such as industrial production and real gross domestic product (GDP) some commentators have raised the alarm of the possibility of a recession emerging.
Some other commentators are dismissive of this arguing that the likelihood of a recession ahead is not very high given that other important indicators such as consumer outlays as depicted by the annual growth rate of retail sales and the state of employment appear to be in good shape (see charts).
Most experts tend to assess the strength of an economy in terms of real gross domestic product (GDP), which supposedly mirrors the total amount of final goods and services produced.
To calculate a total, several things must be added together. In order to add things together, they must have some unit in common. It is not possible however to add refrigerators to cars and shirts to obtain the total amount of final goods.
Since total real output cannot be defined in a meaningful way, obviously it cannot be quantified. To overcome this problem economists employ total monetary expenditure on goods, which they divide by an average price of goods. However, is the calculation of an average price possible?
Suppose two transactions are conducted. In the first transaction, one TV set is exchanged for $1,000. In the second transaction, one shirt is exchanged for $40. The price or the rate of exchange in the first transaction is $1000/1TV set. The price in the second transaction is $40/1shirt. In order to calculate the average price, we must add these two ratios and divide them by 2. However, $1000/1TV set cannot be added to $40/1shirt, implying that it is not possible to establish an average price.
…click on the above link to read the rest of the article…
Fourth Turning Economics
Fourth Turning Economics
“In retrospect, the spark might seem as ominous as a financial crash, as ordinary as a national election, or as trivial as a Tea Party. The catalyst will unfold according to a basic Crisis dynamic that underlies all of these scenarios: An initial spark will trigger a chain reaction of unyielding responses and further emergencies. The core elements of these scenarios (debt, civic decay, global disorder) will matter more than the details, which the catalyst will juxtapose and connect in some unknowable way. If foreign societies are also entering a Fourth Turning, this could accelerate the chain reaction. At home and abroad, these events will reflect the tearing of the civic fabric at points of extreme vulnerability – problem areas where America will have neglected, denied, or delayed needed action.” – The Fourth Turning – Strauss & Howe

The quote above captures the current Fourth Turning perfectly, even though it was written more than a decade before the 2008 financial tsunami struck. With global debt now exceeding $250 trillion, up 60% since the Crisis began, and $13 trillion of sovereign debt with negative yields, it is clear to all rational thinking individuals the next financial crisis will make 2008 look like a walk in the park. We are approaching the eleventh anniversary of this crisis period, with possibly a decade to go before a resolution.
As I was thinking about what confluence of economic factors might ignite the next bloody phase of this Fourth Turning, I realized economic factors have been the underlying cause of all four Crisis periods in American history.
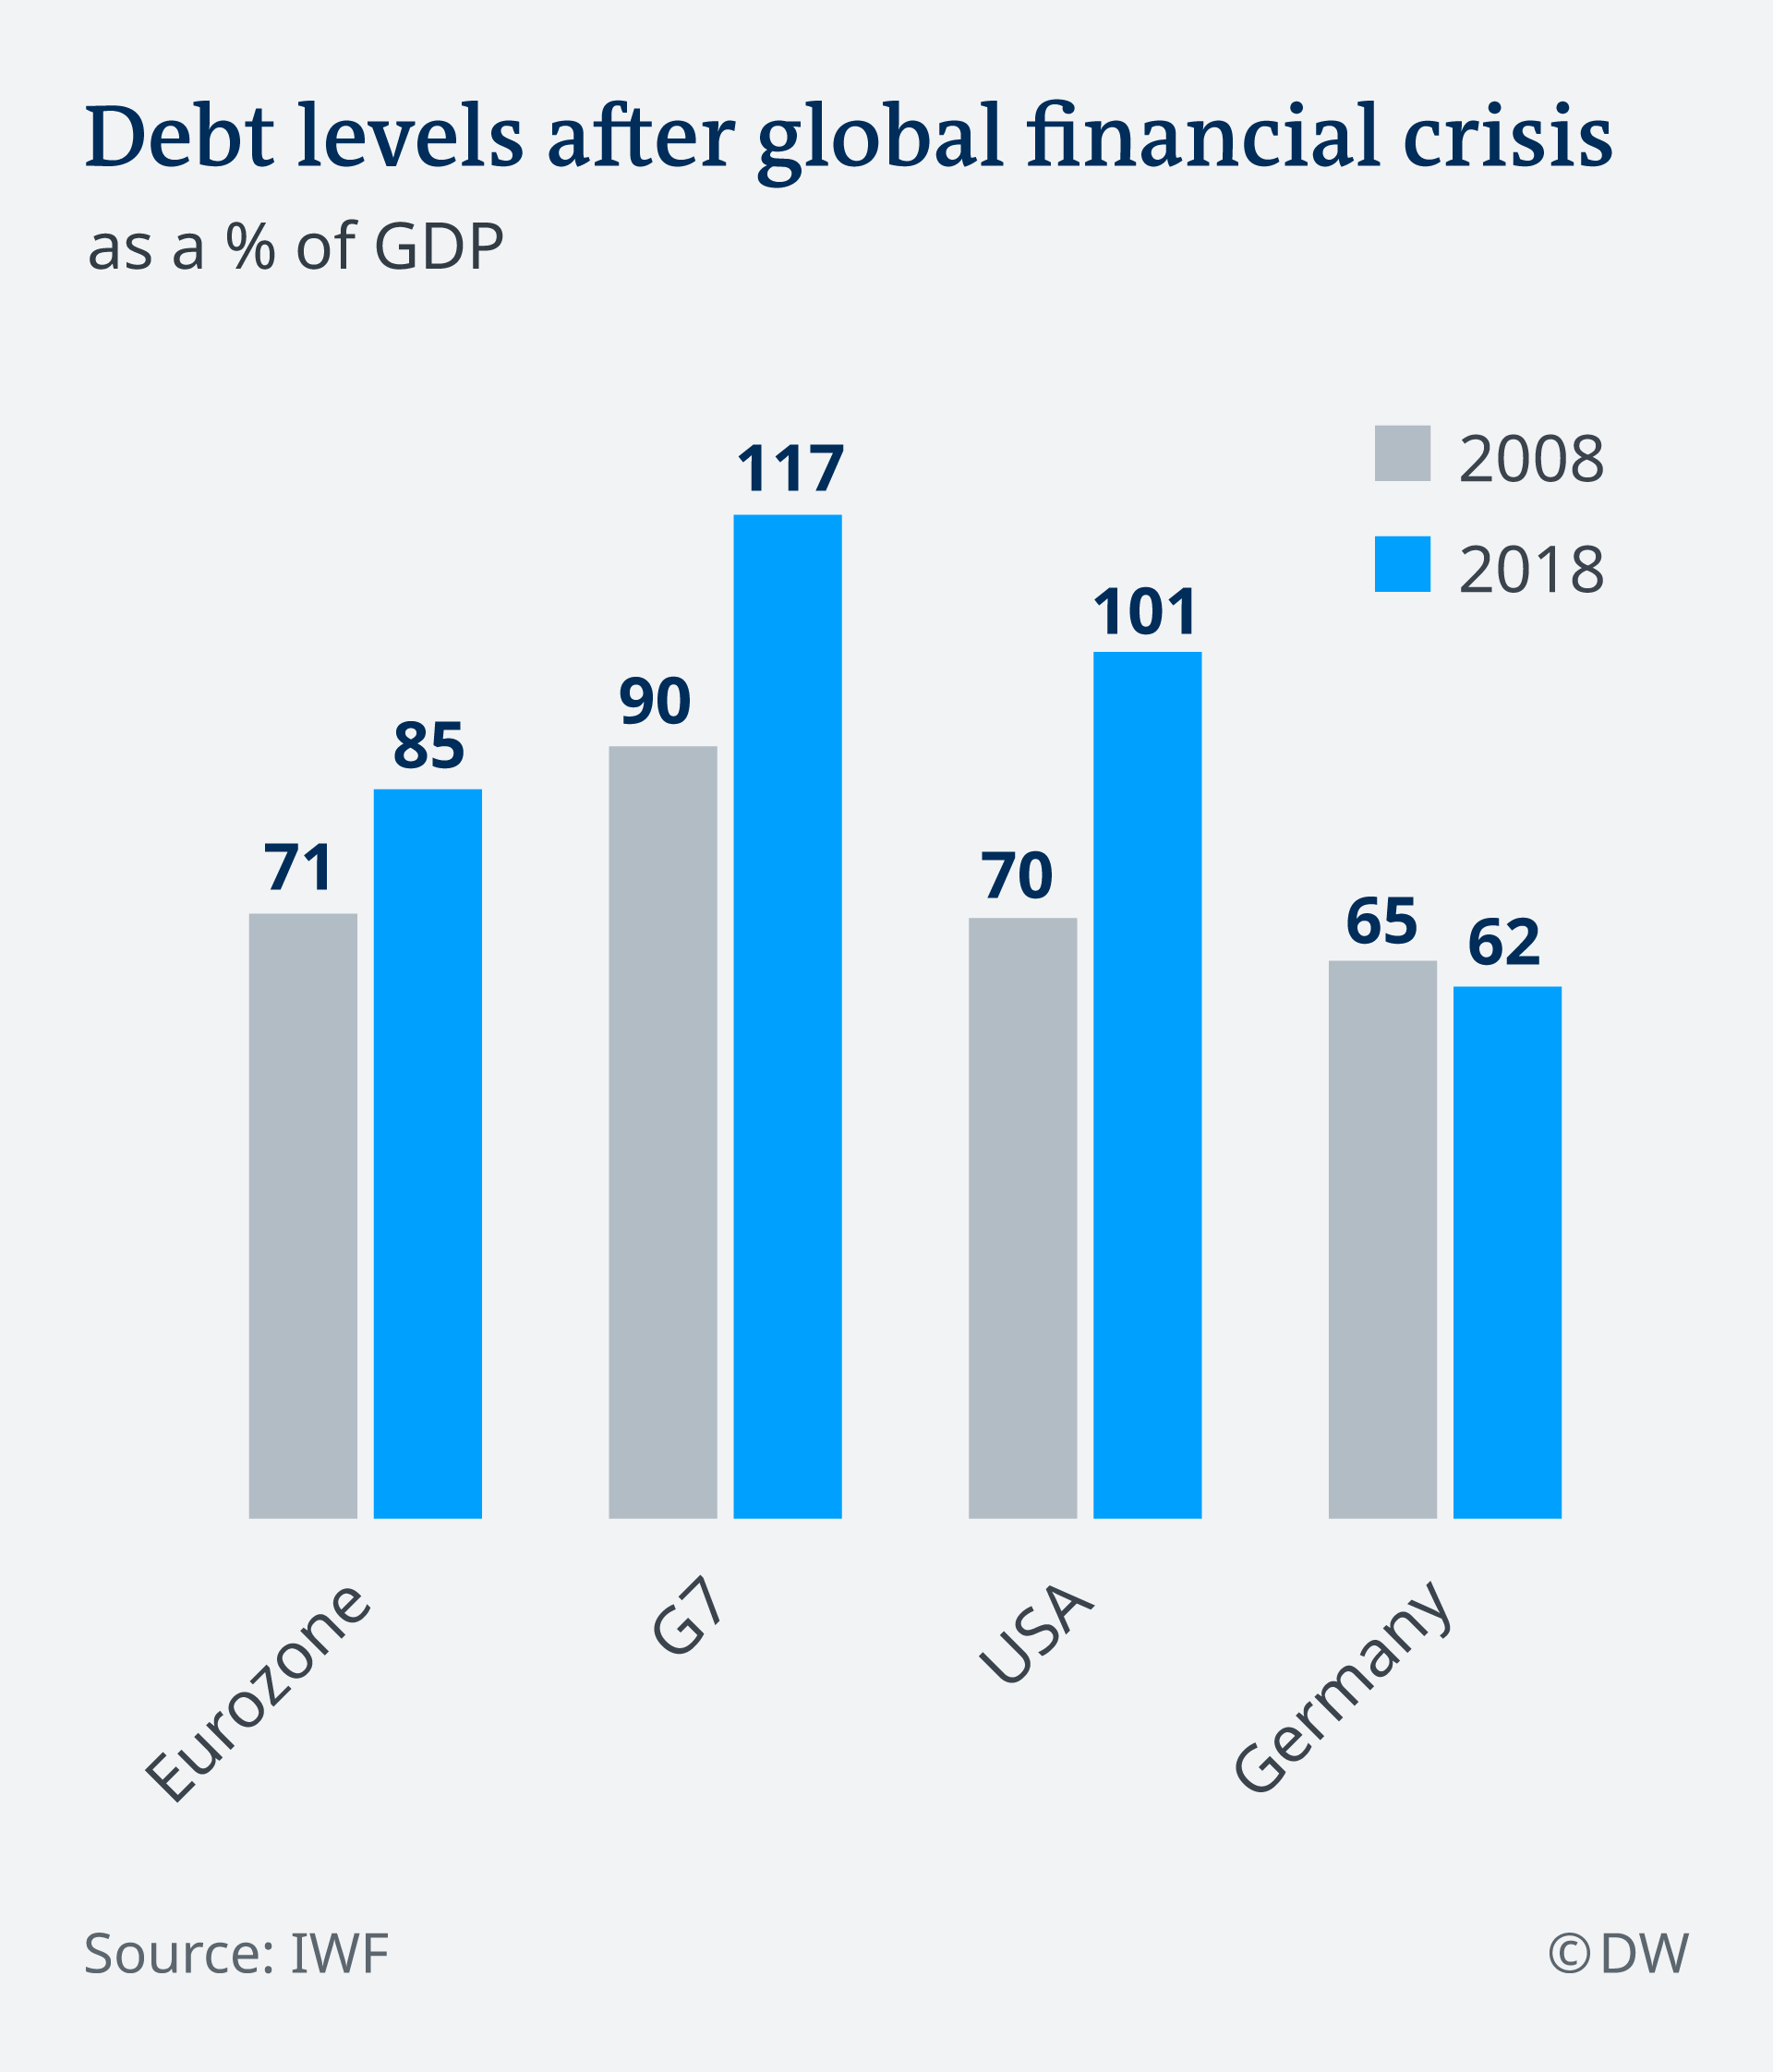
The specific details of each crisis change, but economic catalysts have initiated all previous Fourth Turnings and led ultimately to bloody conflict. There is nothing in the current dynamic of this Fourth Turning which argues against a similar outcome. The immense debt, stock and real estate bubbles, created by feckless central bankers, corrupt politicians, and spineless government apparatchiks, have set the stage for the greatest financial calamity in world history.
…click on the above link to read the rest of the article…
A tale of two deflations
A tale of two deflations
Japanification is a term that has re-emerged recently. It refers to the prolonged economic stagnation of Japan, which commenced after a financial crash in the early 1990s. The stagnation of Japan has been marked by very low inflation (recurring periods of deflation), stagnating productivity growth and a massive increase in government debt.
However, at the same time as the financial crisis that started the long stagnation in Japan, there was a similar crisis in a small northern country, Finland. Finland had followed such a similar economic trajectory as Japan that it was dubbed the “Japan of the North”. However, while Japan fell into a prolonged economic malaise, the Finnish economy returned to growth just four years after the onset of the crisis (see Figure 1).
What caused the difference between these two outcomes?
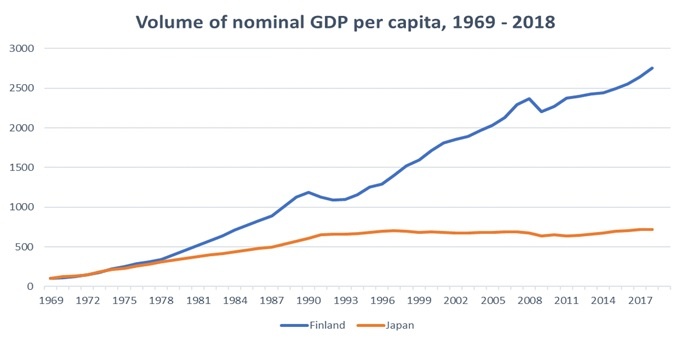
Figure 1. Volume of nominal, local currency GDP per capita in Finland and Japan between 1969 and 2018 (1969=100). Note: due to the recurrent deflation periods in Japan, comparisons using the constant (real) GDP per capita are not feasible. Source: GnS Economics, World Bank
The boom of Finland and Japan
Both Japan and Finland were relatively poor countries in the 1950s. Both were on the losing side of the Second World War (Japan had primarily fought against the U.S. and Finland against the Soviet Union) which made them temporary outcasts in the new global political order. After they regained a place in global politics, both established an ambitious industrialization program.
In both countries monetary and fiscal policies, under a regime of currency regulation, were used to channel resources towards industrialization. Capital flows were tightly-managed, and interest rates were set below market-clearing levels. This forced national savings toward investment and allowed for only essential consumption.
…click on the above link to read the rest of the article…
Global Debt Hits $246 Trillion, 320% Of GDP, As Developing Debt Hits All Time High
Global Debt Hits $246 Trillion, 320% Of GDP, As Developing Debt Hits All Time High
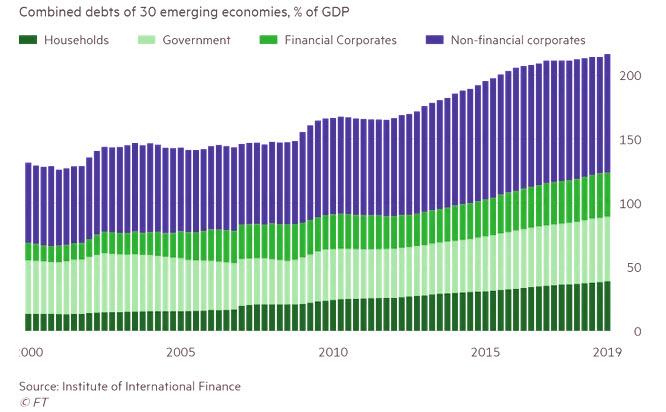
According to the latest IIF Global Debt Monitor released today, debt around the globe hit $246 trillion in Q1 2019, rising by $3 trillion in the quarter, and outpacing the rate of growth of the global economy as total debt/GDP rose to 320%
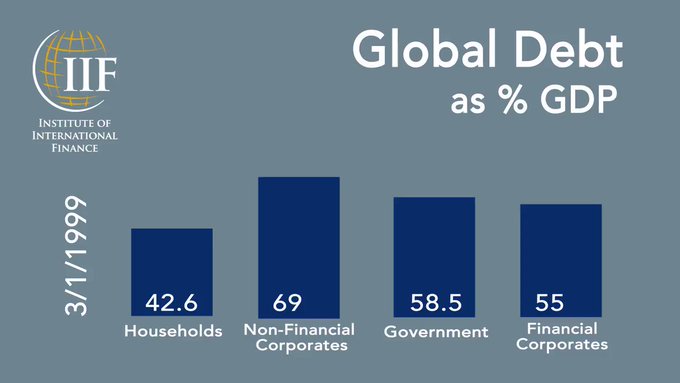


NEW Global Debt Monitor: Global debt hit $246T in Q1 2019, nearly 320% of GDP.
Debt by sector, Q1 2019 (as % of GDP):
Households: 59.8%
Gov’t: 87.2%
Financial corporates: 80.8%
This was the second-highest dollar number on record after the first three months of 2018, though debt was higher in 2016 and 2017 as a share of world GDP. Total debt was broken down as follows:
- Households: 60% of GDP
- Non-financial corporates: 91% of GDP
- Government 87% of GDP
- Financial Corporations: 81% of GDP
And while the developed world has some more to go before regaining the prior all time leverage high, with borrowing led by the U.S. federal government and by global non-financial business, total debt in emerging markets hit a new all time high, thanks almost entirely to China…
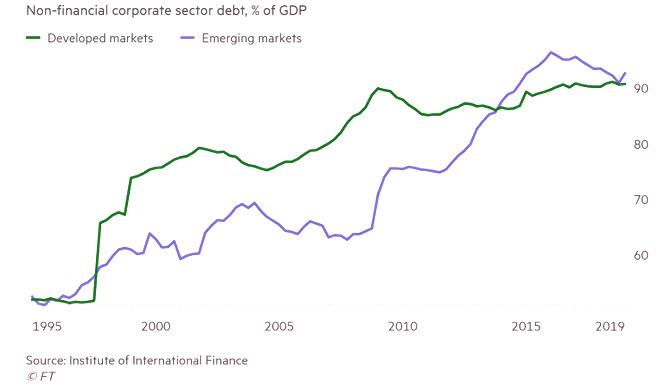
… which has been on such a debt issuance rampage, it would make even Uncle Sam blush, as Chinese corporations owed the equivalent of more than 155% of GDP in March, or nearly $21 trillion, up from about 100% of GDP, or $5 trillion, two decades ago.
And here is a startling fact: according to Fundamental Intelligence, a bond market consultancy, Chinese firms accounted for 42% of all corporate bonds issued in EMs this year, which it warned raised the risk of defaults next year and in 2021.
As a result of China’s ravenous debt appetite, emerging economies had the highest-ever level of debt (both corporate and household) at the end of Q1, both in dollar terms and as a share of their gross domestic product, according to the FT’s report on the latest IIF data.
Bizarro World: The Herd Has Truly Gone MadYou’re not crazy. The world we now live in is
Bizarro World: The Herd Has Truly Gone MadYou’re not crazy. The world we now live in is
Men, it has been well said, think in herds; it will be seen that they go mad in herds, while they only recover their senses slowly, and one by one.
~ Charles Mackay (1841)
Like me, you may often feel gobsmacked when looking at the world around you.
How did things get so screwed up?
The simple summary is: the world has gone mad.
It’s not the first time.
History is peppered with periods when the minds of men (and women) deviated far from the common good. The Inquisition, the Salem witch trials, the rise of the Third Reich, Stalin’s Great Purge, McCarthy’s Red Scares — to name just a few.
Like it or not, we are now living during a similar era of self-destructive mass delusion. When the majority is pursuing — even cheering on — behaviors that undermine its well-being. Except this time, the stakes are higher than ever; our species’ very existence is at risk.
Bizarro Economics
Evidence that the economy is sliding into recession continues to mount.
GDP is slowing. Earnings warnings issued by publicly-traded companies are at a 13-year high. The most reliable recession predictor of the past 50 years, an inverted US Treasury curve, has been in place for the past quarter.
Yet the major stock indices hit all-time highs earlier this week. And every one of the 38 assets in the broad-based asset basket tracked by Deutsche Bank was up for the month of June — something that has never happened in the 150 years prior to 2019.
It has become all-too clear that markets today are no longer driven by business fundamentals. Only central bank-provided liquidity matters. As long as the flood of cheap credit continues to flow (via rock-bottom/negative interest rates and purchase programs), keeping cash-destroying companies alive and enabling record share buybacks, all boats will rise.
…click on the above link to read the rest of the article…
Australia Lowers Rate to Historic Low of 1%
Australia Lowers Rate to Historic Low of 1%
The Reserve Bank of Australia has cut the official cash rate for the second month in a row to 1%. As we head into the turning point of the Economic Confidence Model come January 2020, the unemployment rate increased to 5.2% in April. GDP growth remains very low at 0.4%, wage growth is sluggish, inflation is well below target, and retail sales are struggling. None of this will change until after the ECM turns as people begin to see that central banks are incapable of managing the economy.
What were Roman Taxes v Modern Taxes?
What were Roman Taxes v Modern Taxes?
QUESTION: You do a lot of comparison to the Roman Empire. What was the size of the government relative to GDP? Can you estimate that?
GY
ANSWER: The Roman economy was more like the USA during the mid-19th century in that it was pre-industrial. About 80% of its inhabitants worked in agriculture, which was about where we were in 1840. There was no social agenda of trying to redistribute wealth from one class to the other. Still, there were social programs. But the socialistic agenda that was adopted by modern governments has sought not merely to redistribute wealth among the classes, but it has justified bigger government on a grand scale never before witnessed in history. The tax rate in the ancient Roman Empire was about 5% with some paying as little as 2%. The actual cost of government during the Roman Empire was minimal compared to the modern standard. The Roman Emperor Trajan (98-117 AD) formalized the alimenta, which was a welfare program that helped orphans and poor children throughout Italy. It provided general funds as well as food and subsidized education. The program was supported initially out of Dacian War booty, and then later by a combination of estate taxes and philanthropy. So there were programs to take care of people who needed help.
Virtually all the taxes and rents raised by the imperial government were spent on the military, which came out to be about 80% of the imperial budget in 150 AD. This military spending constituted about 2.5% of the empire’s GDP. Obviously, we do not really see separatists movement until the mid-3rd century when Valerian I (253-260 AD) was captured by the Persians. With the cost of the military coming in about 2.5%, this explains the lack of tax rebellions.
…click on the above link to read the rest of the article…
The Economy Has Fundamentally Changed in the 21st Century–and Not for the Better
The Economy Has Fundamentally Changed in the 21st Century–and Not for the Better
The net result is we have an economy that’s supposedly expanding smartly while our well-being and financial security are collapsing.
Gross Domestic Product (GDP) and other metrics of economic activity don’t measure either broad-based prosperity or well-being. Elites skimming financialization profits by expanding corporate debt and issuing more loans to commoners while spending more on their lifestyles boosts GDP quite nicely while the security and well-being of the bottom 90% plummets.
Under the hood of “recovery” and a higher GDP, life has gotten harder and more insecure for the bottom 90%. The key is not to look just at wages (trending up, we’re assured) or inflation (near-zero, we’re assured) but at aspects of daily life (lived experience) that cannot be captured by conventional economic / financial attempts at quantifying the economy.
How do we quantify the cost of the financial anxiety provoked by huge insurance deductibles or staggering healthcare bills? What matters isn’t just whether the patient or their family has to declare bankruptcy because they can’t afford the enormous co-pays: what matters is the debilitating stress caused by having to decide between risking an operation and bankrupting the family or foregoing the operation and hoping for a miracle.Or how about the eventual cost of foregoing healthcare except in emergencies due to having to pay cash for any care due to the high deductibles?
Small stresses add up, leading to chronic stress and a host of debilitating consequences. Consider the daily commute to work, which has become longer and more stressful due to increasing congestion and the limits of public transport infrastructure that hasn’t been improved or expanded in decades.Why New York City Stopped Building Subways (via Mark G.) Unlike most other great cities, New York’s rapid transit system remains frozen in time: Commuters on their iPhones are standing in stations scarcely changed from nearly 80 years ago.
…click on the above link to read the rest of the article…
This Is the End of the Cycle
This Is the End of the Cycle
Both new households and new businesses are in secular decline. Goosing the stock market and GDP doesn’t change this reality.
Everyone wants every cycle of expansion to last forever, but alas every cycle ends. The growth cycle that began in 2009 is finally coming to an end. The signs are everywhere, notwithstanding the torrid 3.2% GDP growth for the first quarter of 2019 (which as others have noted, is less than meets the eye.)
Gross Domestic Product (GDP) is the standard measure of expansion, but it is an imperfect metric. GDP can still notch gains while the majority of the economy is stagnating and assets are losing value.
Better guides to expansion than GDP are sales volumes, prices, profits, wage increases and sustained rises in new enterprises and households. All of these measures of expansion are stagnant, indicating that monetary and fiscal stimulus are no longer moving the needle.
Corporate profits are higher as a result of accounting gimmicks, not soaring sales or expanding gross profit margins. Stocks are being pushed higher by the old trick of lowering earnings estimates so that corporations can “beat by penny.”
In many once-hot real estate markets, sales are slowing while prices continued edging higher but at much slower rates than in the past. This is classic late-cycle activity: sales are declining as the pool of buyers has been drained while price increases have become marginal.
Global sales of pricey mobile phones and vehicles have slowed, indicating the exhaustion of the cycle is global. Again, this is classic late-cycle activity: trends that powered the narrative of “strong growth everywhere” are fading, despite attempts to hype some blip as a sign that strong growth is about to start up again.
…click on the above link to read the rest of the article…
That Time the Dollar Tide Went Out…
That Time the Dollar Tide Went Out…

Welcome to the Dollar Rally to end all rallies. This week’s action in the U.S. dollar puts paid all of the moves by the Fed and the ECB over the past three months to forestall this from coming.
First it was January’s FOMC meeting where the Fed completely reversed course after a very unpopular December rate hike threw equity markets into a tailspin by Christmas.
Of course our Narcissist-in-Chief thought it was all about him and implored the Fed to stop raising rates. It was interfering with his ability to shake down the world at his sanctions and tariffs party.
But it wasn’t about him at all. It was about the Fed’s need to normalize rates into a coming global slowdown after a central-bank-induced, decade-long recovery of dubious merit.
They’d done their job of recapitalizing the banks, somewhat, and now it was time to start trying to address the massive pension system and municipal bond crisis that was on the horizon.
Or at least that’s what they thought.
Moreover, at some point the Fed had to show the markets something positive. That unwinding its balance sheet alongside significant shift in capital flows thanks to Trump’s tax cuts going into effect in 2019 was a signal to U.S. corporations to invest in something other than balance sheet manipulations themselves — buybacks, special dividends, etc.
Trump can talk a good game about the ‘greatest economy evahr!’ but reality is even today’s 3.2% GDP print is marred by one-off items like an anomalous contraction of the trade deficit and huge inventory builds as Zerohedge pointed out.
Let’s not forget how easy it is to get a big GDP print when you’re running the biggest deficits in history.
…click on the above link to read the rest of the article…
If “Getting Ahead” Depends on Asset Bubbles, It’s Not “Getting Ahead,” It’s Gambling
If “Getting Ahead” Depends on Asset Bubbles, It’s Not “Getting Ahead,” It’s Gambling
Given that the economy is now totally and completely dependent on inflating asset bubbles, it makes no sense to invest for the long-term.
Beneath the endlessly hyped expansion in gross domestic product (GDP) of the past two decades, the economy has changed dramatically. The American Dream boils down to social and economic mobility, a.k.a. getting ahead through hard work, merit and wise investments in oneself and one’s family.
The opportunities for this mobility in the post World War 2 era broadened as civil rights and equal rights expanded. The 1970s saw a disruption of working-class mobility as high-paying factory jobs disappeared, leaving services jobs that paid less or required more training, i.e. a college degree.
The U.S. economy took off in the 1980s for a number of reasons, including computer technologies, federal stimulus (deficit spending) and financialization (a topic I’ve covered many times). With millions more college graduates entering the workforce and the Internet creating entire new industries, the opportunities to “get ahead” increased across the social and economic spectrum.
But something changed in the aftermath of the dot-com bubble bursting.The fruits of financialization–highly leveraged debt gambled for short-term gains in markets–were extended to everyone with a job (or a willingness to lie) via liar loans, no-document loans and subprime mortgages.Just like bigshot financiers on Wall Street, J.Q. Citizen could leverage a couple thousand dollars in cash (or even better, borrow the closing costs via a 105% of value mortgage and put nothing down) and buy a McMansion worth $250,000 or even $500,000.
The only difference between bigshot financiers and J.Q. Citizen was the scale of the leverage and gamble: J.Q. Citizen could leverage a few grand into hundreds of thousands, while the financier could leverage a bit of collateral into mega-millions.
…click on the above link to read the rest of the article…
Loonie Tumbles As Bank Of Canada Capitulates
Loonie Tumbles As Bank Of Canada Capitulates
Add The Bank of Canada to the list of flip-flopping central banks as it has now fully abandoned its bias toward raising interest rates as the economy grapples with a slowdown, bringing its policy into line with the Fed.
“Governing Council judges that an accommodative policy interest rate continues to be warranted,” officials led by Governor Stephen Poloz said in the statement.
“We will continue to evaluate the appropriate degree of monetary policy accommodation as new data arrive.”
The Bank of Canada is keeping its key interest rate unchanged as it releases a downgraded 2019 growth forecast that includes a prediction the economy nearly came to a halt at the start of the year.
The Bank of Canada slashed its GDP growth forecast to 1.2% y/y in 2019, from 1.7% previous, and projecting growth of just 0.3 per cent in the first quarter of 2019.
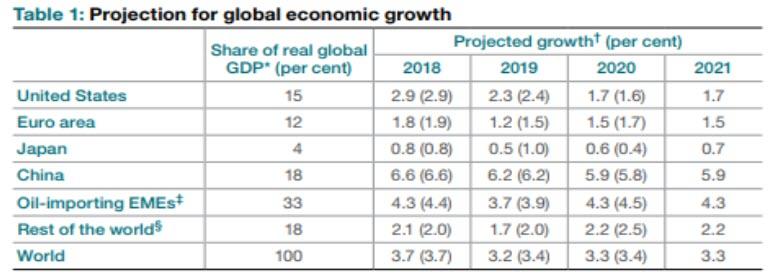
The decision leaves the trend-setting rate at 1.75 per cent for a fourth-straight announcement – a pause that followed governor Stephen Poloz’s stretch of five hikes between mid-2017 and last fall.
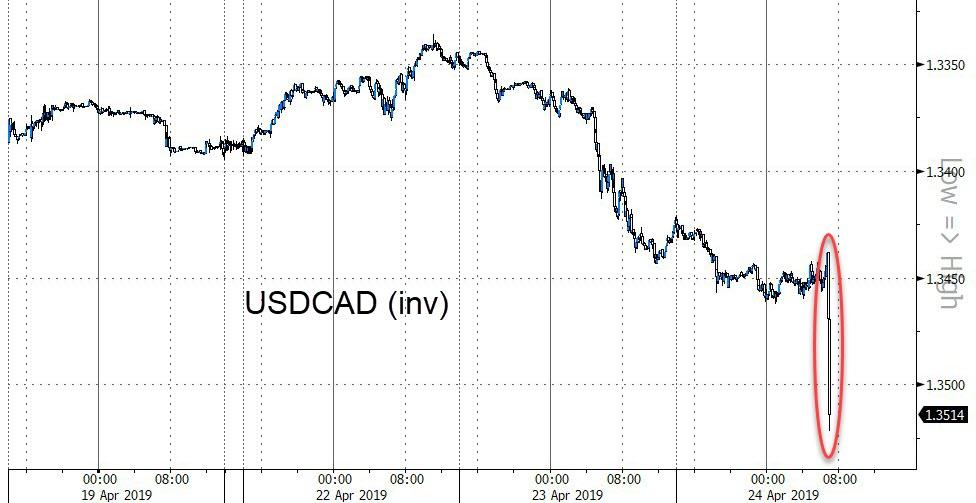
The reaction makes sense – a sudden weakening in the Loonie…
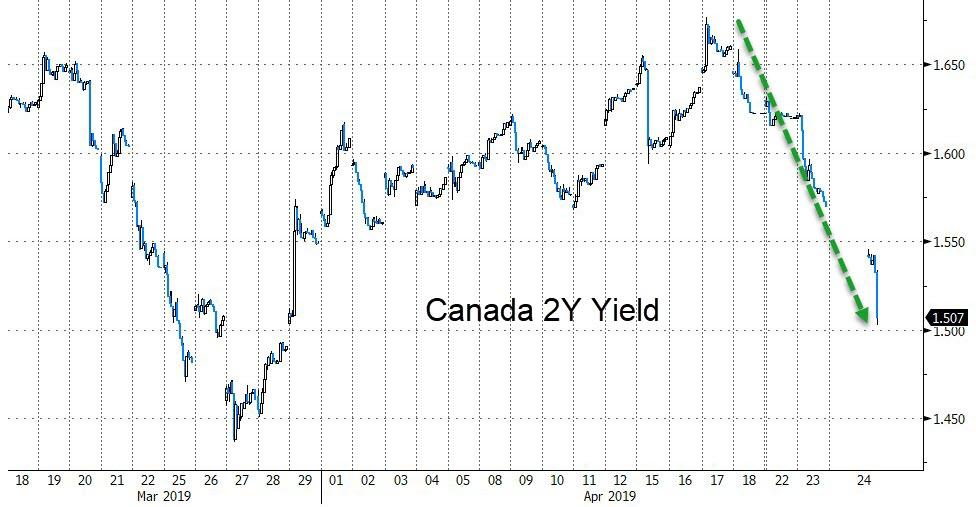
And Canadian bond yields are tumbling…
As the Madness Turns
As the Madness Turns
A Growing Gap
The first quarter of 2019 is over and done. But before we say good riddance. Some reflection is in order. To this we offer two discrete metrics. Gross domestic product and government debt.
US nominal GDP vs total federal debt (in millions of USD) – government debt has exceeded total economic output for the first time in Q4 2012 and since then its relative growth trajectory has increased – and it seems the gap is set to widen further. [PT]
GDP for the quarter, as estimated by the March 29 update to the New York Fed’s GDP Nowcast, grew at an annualized rate of 1.3 percent. For perspective, annualized GDP growth of 1.3 percent is akin to getting a 1.3 percent annual raise. Ask any working stiff, and they’ll tell you… a 1.3 percent raise is effectively nothing.
By comparison, the U.S. budget deficit for fiscal year 2019 is estimated to hit roughly $1.1 trillion. This amounts to an approximate 5 percent increase of the current $22.2 trillion national debt. In other words, government debt is increasing about 3.85 times faster than nominal GDP, which is about $21 trillion.
These two metrics offer a rough perspective on the state of the economy. Deficit spending is grossly outpacing economic growth. Heavy treatments of fiscal stimulus are being applied. Yet the economy’s practically running in place. In short, the state of the economy is not well.
A case of restricted maneuverability… [PT]
And as the economy slows and then slips into reverse later this year, and as Washington then applies more fiscal stimulus, these two metrics will move even further towards madness. What’s more, the Fed is gearing up to promote this greater state of madness in any and every way possible…
…click on the above link to read the rest of the article…


