Home » Posts tagged 'credit' (Page 4)

Tag Archives: credit

Olduvai
Click on image to purchase

Olduvai III: Catacylsm
Click on image to purchase

Post categories

Post Archives by Category

“Everyone Is Thinking It’s The Shanghai Accord All Over Again”

“Everyone Is Thinking It’s The Shanghai Accord All Over Again”

Back on January 9, when the S&P500 was just inches away from its Christmas Day bear market lows, we asked a simple question: is the Shanghai Accord 2.0 coming? Now, with the S&P back at all time highs, China unleashing a historic torrent of new credit after launching monetary and fiscal easing that shocked even the most cynical China skeptics and sent Chinese stocks soaring, and every central bank in the world reversing in the Fed’s footsteps and scrambling to cut rates as the global race to the currency bottom entered what may be its final lap, we have the answer.

Or do we?

For those who are rightfully confused, because while there are countless similarities between the “2016 scenario” and current markets, there are also some very specific differences, here is a great recap of the similarities and differences, excerpted from the latest weekend note by One River asset management’s CIO, Eric Peters:

Deja Vu

“Everyone’s thinking it’s 2016 all over again,” said the CIO. A global growth scare, equity weakness, dollar strength and commodity declines prompted central bankers to hash out the Shanghai accord in early 2016 that dramatically reversed these trends. “They’ve seen China ease this year, the Fed pivot, equities rebound,” he said. By late-April in 2016, the S&P 500 had jumped 17% from the Jan 2016 lows (this year it rallied +20%), and by late-April 2016, Chinese stocks rose +16% (this year +40%). “They’ve looked at this and said green light, risk on.”

“Pulling out the 2016 playbook, people piled into reflation trades,” continued the same CIO. “Short dollar trades, crap beats quality, dash for trash, EM equities and FX, commodities.” By late-April 2016, oil had surged +70% from the Jan 2016 lows (this year +50%), copper rallied +20% then (this year +18%). The dollar index had fallen -6% in 2016 (but this year DXY is up +1%), gold surged +23% (but this year flat). 

 …click on the above link to read the rest of the article…

Weekly Commentary: The Perils of Stop and Go

Weekly Commentary: The Perils of Stop and Go

Please join Doug Noland and David McAlvany this coming Thursday, April 18th, at 4:00PM EST/ 2:00pm MST for the Tactical Short Q1 recap conference call, “What are Central Banks Afraid of?” Click here to register.

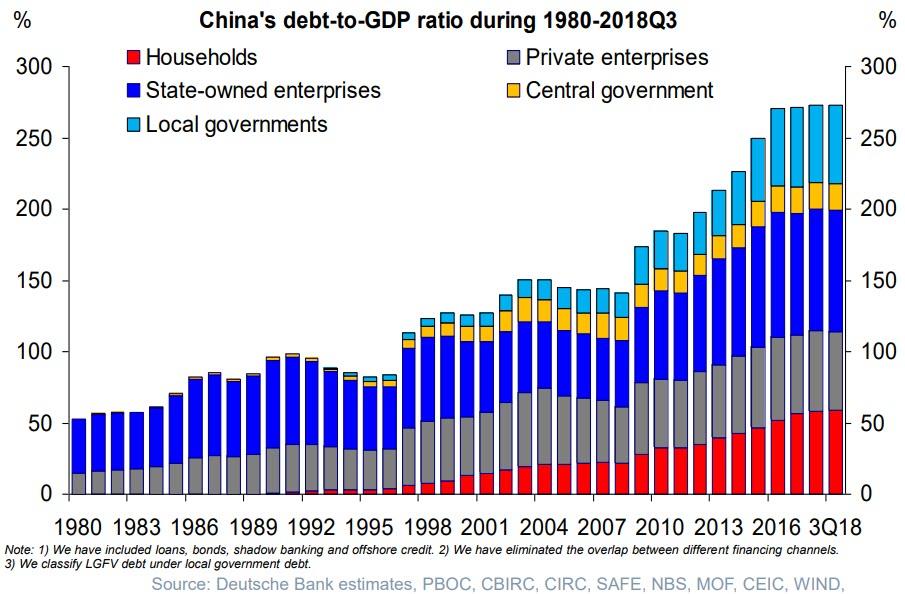
China’s Aggregate Financing (approximately system Credit growth less government borrowings) jumped 2.860 billion yuan, or $427 billion – during the 31 days of March ($13.8bn/day or $5.0 TN annualized). This was 55% above estimates and a full 80% ahead of March 2018. A big March placed Q1 growth of Aggregate Financing at $1.224 TN – surely the strongest three-month Credit expansion in history. First quarter growth in Aggregate Financing was 40% above that from Q1 2018.  

Over the past year, Aggregate Financing expanded $3.224 TN, the strongest y-o-y growth since December 2017. According to Bloomberg, the 10.7% growth rate (to $31.11 TN) for Aggregate Financing was the strongest since August 2018. The PBOC announced that Total Financial Institution (banks, brokers and insurance companies) assets ended 2018 at $43.8 TN.

March New (Financial Institution) Loans increased $254 billion, 35% above estimates. Growth for the month was 52% larger than the amount of loans extended in March 2018. For the first quarter, New Loans expanded a record $867 billion, about 20% ahead of Q1 2018, with six-month growth running 23% above the comparable year ago level. New Loans expanded 13.7% over the past year, the strongest y-o-y growth since June 2016. New Loans grew 28.2% over two years and 90% over five years.  

China’s consumer lending boom runs unabated. Consumer Loans expanded $133 billion during March, a 55% increase compared to March 2018 lending. This put six-month growth in Consumer Loans at $521 billion. Consumer Loans expanded 17.6% over the past year, 41% in two years, 76% in three years and 139% in five years.  

China’s M2 Money Supply expanded at an 8.6% pace during March, compared to estimates of 8.2% and up from February’s 8.0%. It was the strongest pace of M2 growth since February 2018’s 8.8%. 

 …click on the above link to read the rest of the article…

The Coming Credit Meltdown Will Be As Bad As The Great Depression And The Financial Crisis: Deutsche

The Coming Credit Meltdown Will Be As Bad As The Great Depression And The Financial Crisis: Deutsche

With investor attention increasingly focusing on what most believe will be the catalyst for the next financial crisis, namely a tsunami in corporate defaults as a result of the disastrous combination of record leverage, higher rates and an economic slowdown, overnight we presented the view of FTI global co-leader of corporate finance and restructuring, Carlyn Taylor, who predicted that “a spike in defaults is on the way, sooner or later.”

The expansion is pretty long in the tooth and there’s definitely a lot of buildup. The activity level of restructuring is rising, maybe not at the rate of bankruptcies, but the pipeline of companies we think are going to end up in restructuring, based on metrics that we analyze, that volume has gone up. And we’re so busy, which we don’t think is just market share, because we think our competitors are also very busy.

Yet while investor worries have centered on record corporate leverage…

… a growing number of strategists are warning that corporate bond market illiquidity is an even greater risk factor.

Not long after Goldman most recently warned that the biggest threat facing the broader market in general, as well as corporate bonds in particular, is a sudden collapse in liquidity, overnight UBS credit strategist Steve Caprio and his team laid out four major reasons why global corporate bond market liquidity has deteriorated over time.

These are:

  1. Rising investment fund ownership of corporate debt,
  2. Low interest rates,
  3. A lack of dealer intermediation, particularly in periods of rising credit risk, and
  4. Potential new EU regulation on trade settlement failures.

 …click on the above link to read the rest of the article…

FedEx Is Talking As If A Global Recession Has Already Begun – And The Numbers Back That Up

FedEx Is Talking As If A Global Recession Has Already Begun – And The Numbers Back That Up

“Slowing international macroeconomic conditions” is just a fancy way to say that the global economy is in big trouble.  For months, I have been warning that economic conditions are deteriorating, and we just keep getting more confirmation that we are facing the worst global downturn since the last financial crisis.  For the second time in three months, FedEx has slashed its revenue forecast for this year.  In an attempt to explain why revenue is declining, FedEx’s chief financial officer placed the blame squarely on the faltering global economy.  The following comes from CNBC

The multinational package delivery service reported declining international revenue as a result of unfavorable exchange rates and the negative effects of trade battles.

“Slowing international macroeconomic conditions and weaker global trade growth trends continue, as seen in the year-over-year decline in our FedEx Express international revenue,” Alan B. Graf, Jr., FedEx Corp. executive vice president and chief financial officer, said in statement.

The use of the word “trends” implies something that has been going on for an extended period of time, and obviously FedEx doesn’t expect things to get better any time soon if they have cut profit projections twice in just the last three months.

And FedEx certainly has a lot of company when it comes to having a gloomy outlook for the global economy.  In one recent article, Bloomberg boldly declared that the global economy is in the worst shape it has been “since the financial crisis a decade ago”

 …click on the above link to read the rest of the article…

Weekly Commentary: Q4 2018 Z.1 “Flow of Funds”

Weekly Commentary: Q4 2018 Z.1 “Flow of Funds”

I’ve been anxiously awaiting the Fed’s Q4 2018 Z.1 “Flow of Funds” report. It provided the first comprehensive look at how this period’s market instability affected various sectors within the financial system. From ballooning Broker/Dealer balance sheets to surging “repo” lending to record Bank loan growth – it’s chock-full of intriguing data. All in all, and despite a Q4 slowdown, 2018 posted the strongest Credit growth since before the crisis – led, of course, by our spendthrift federal government. 

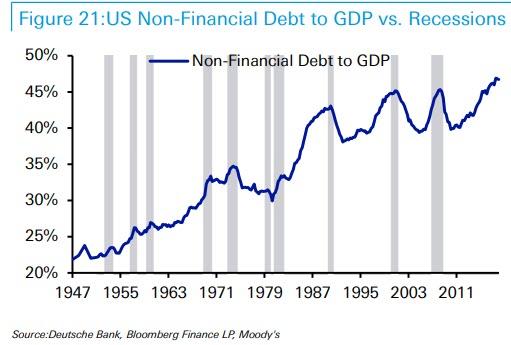
Non-Financial Debt (NFD) rose $2.524 TN during 2018 (5.1%), exceeding 2007’s $2.478 TN and second only to 2004’s $2.915 TN growth. NFD closed 2018 at a record 253% of GDP, compared to 230% to end of 2007 and 189% to conclude the nineties. By major category, Federal borrowings expanded $1.258 TN during the year, up from 2017’s $599 billion, and the strongest growth since 2010’s $1.646 TN. Year-over-year growth in Total Household borrowings slowed ($488bn vs. $570bn), led by a drop in Home Mortgages ($285bn vs. $312bn). Total Corporate borrowings slowed to $532 billion from 2017’s $769 billion. Foreign U.S. borrowings declined to $207 billion from 2017’s $389 billion.  

On a percentage basis, NFD increased 4.51% in 2018, up from 2017’s 4.10%. Federal debt grew 7.58%, almost double 2017’s 3.74%, to the strongest percentage growth since 2012 (10.12%). Household debt growth slowed to 3.22% (from 3.90%), with Mortgage borrowings up 2.83% (from 3.19%) and Consumer Credit growth easing slightly to 4.88% (from 5.04%). Total Corporate Debt growth slowed meaningfully from 2017’s 5.71% to 3.69%.

For Q4, on a seasonally-adjusted and annualized basis (SAAR), Non-Financial Debt (NFD) expanded $1.390 TN, the slowest expansion since Q4 2016 (SAAR $941bn). This is largely explained by the sharp drop-off in Federal borrowings (SAAR $444bn vs. Q3’s SAAR $1.180 TN). 

 …click on the above link to read the rest of the article…

Credit Exhaustion Is Global

Credit Exhaustion Is Global

Europe is awash in credit exhaustion, and so is China.

The signs are everywhere: credit exhaustion is global, and that means the global growth story is over: revenues and profits are all sliding as lending dries up and defaults pile up.

What is credit exhaustion? Qualified buyers don’t want to borrow more, leaving only the unqualified or speculators seeking to save a marginal bet gone bad with one more loan (which will soon be in default).

Lenders are faced with a lose-lose choice: either stop lending to unqualified borrowers and speculators, and lose the loan-origination fees, or issue the loans and take the immense losses when the punters and gamblers default.

Europe is awash in credit exhaustion, and so is China. China’s situation is unique, as credit expansion has been propping up the entire economy, from household wealth to corporate speculation to the export sector.As this article explains, The China Story That Is Far Bigger Than Apple, China’s trade balance–trade surpluses for decades–is close to slipping into trade deficits.

At the same time, China’s once-mighty pool of savings has diminished as consumption has risen. As a result, China now needs foreign investment more than it did in the previous era.Chinese businesses have borrowed around $2 trillion in US dollar-denominated debt, requiring the acquisition of dollars to service the debt.So far this sounds like a typical case of a fast-growth economy maturing into a trade-deficit, debt-dependent consumption economy.

What the article misses is the staggering rise in the cost of living in China over the past two decades. Some services are still affordable to the masses–subway fares are extremely cheap–and private healthcare is a mere fraction of healthcare costs in the U.S.But other costs–housing, food, clothing, etc.–…

 …click on the above link to read the rest of the article…

Here Comes The Shanghai Accord 2.0: China Unleashes Gargantuan Credit Injection To Start 2019

Here Comes The Shanghai Accord 2.0: China Unleashes Gargantuan Credit Injection To Start 2019

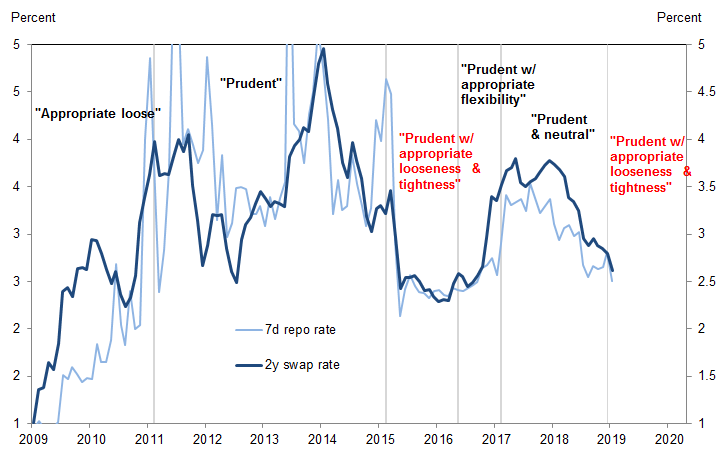
One month ago, we pointed out a curious shift in the official language out of China’s central bank: in late December, when traders were generally away on vacation, the PBOC indicated a critical shift in the official monetary policy description at the December Central Economic Work Conference, from “prudent and neutral” to “prudent with appropriate looseness and tightness”.  

What caught our attention is that the new description was surprisingly similar to what was adopted in 2015, just as monetary policy eased significantly and ahead of the famous “Shanghai Accord” of January 2016 when, as the world was careening to a bear market, a coordinated response from G-7 leaders and China sparked a massive rally in stocks as China unleashed another massive credit injection burst which impacted the global economy for the next year. As Goldman said at the time, “such official policy language, while subtle, can carry important information about the monetary policy stance.”

Which is why in January we said that “while traders were focusing on the latest words out of Fed Chair Powell, is the real “risk-on” catalyst the hint out of China that a new “Shanghai Accord” may be imminent” and added that “the answer is most likely yes, especially if the upcoming US-China trade talks fail to yield a favorable outcome, as the alternative would be even more pain for China’s economy.”

One month later we got the answer when China overnight reported its latest credit aggregate data, and it was a doozy.

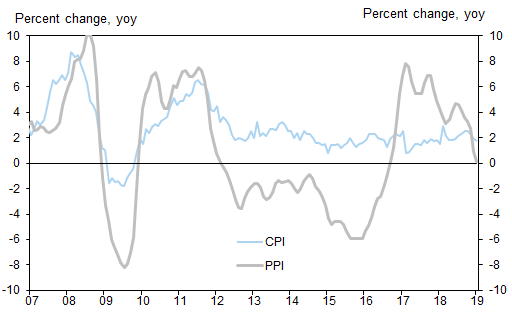
While the market’s attention may have been focused on that “other” news reported by China overnight, namely yet another disappointing month of CPI and PPI, as China’s CPI inflation eased further to 1.7% Y/Y in January from 1.9% in December, while PPI inflation moderated further to just barely above deflation territory, printing at 0.1% yoy in January, the lowest since October 2016…

 …click on the above link to read the rest of the article…

Gold is money, everything else is credit

Gold is money, everything else is credit

People have been obsessed with gold since the beginning of civilization. Both the Egyptians and ancient Greeks valued the precious metal as a status symbol. The more gold you had, the higher you ranked in the natural order of things. In more recent times, gold rushes in Alaska and South Africa have caused major frenzies while changing lives.

People have a natural affinity for shiny things, which makes them desire gold and silver for its beauty. Especially gold, which is a simple, fairly boring metal that can be melted and formed into any desirable form. In many struggling countries, such as India, even the poorest citizens crave gold jewelry.

Prior to paper currency, the actual precious metal was used in trade. A certain amount of gold was assigned a certain value and used in exchange for some other commodity. Since gold and silver were easy to carry, the system worked well, involving the trade of equal commodities.

When governments began to mint currencies, gold and silver became natural choices. Their very rarity, especially gold, gave them an inherent value. People could trust the value of gold and silver. Slowly, however, beginning in the 1930s, world governments were no longer linking their currency to gold. The US dollar stopped being backed by gold in the 1970s. Instead of being backed by true value, word currencies became pieces of paper.

The role of gold changed from a trusted trading currency to a safe investment haven. Investors rely on the fact that while the value of paper currency will fluctuate, gold and silver will hold their value. Precious metals require no guarantees. As currencies lost their gold-backing, global central banks began purchasing and hoarding gold as a reserve currency whose value has been recognized throughout history.

 …click on the above link to read the rest of the article…

The Arrival of the Credit Crisis

Those of us who closely follow the credit cycle should not be surprised by the current slide in equity markets. It was going to happen anyway. The timing had recently become apparent as well, and in early August I was able to write the following:

“The timing for the onset of the credit crisis looks like being any time from during the last quarter of 2018, only a few months away, to no later than mid-2019.” [i]

The crisis is arriving on cue and can be expected to evolve into something far nastier in the coming months. Corporate bond markets have seized up, giving us a signal it has indeed arrived. It is now time to consider how the credit crisis is likely to develop. It involves some guesswork, so we cannot do this with precision, but we can extrapolate from known basics to support some important conclusions.

If it was only down to America without further feed-back loops, we can now suggest the following developments are likely for the US economy. Warnings about an economic slowdown are persuading the Fed to soften monetary policy, a process recently set in motion and foreshadowed by US Treasury yields backing off. However, price inflation, which is being temporarily suppressed by falling oil prices, will probably begin to increase from Q2 in 2019. This is due to a combination of the legacy of earlier monetary expansion, and the consequences of President Trump’s tariffs on consumer prices.

After a brief pause, induced mainly by the threat of an unstoppable collapse in equity prices, the Fed will be forced to continue to raise interest rates to counter price inflation pressures, which will take the rise in the heavily suppressed CPI towards and then through 4%, probably by mid-year.

…click on the above link to read the rest of the article…

Here’s What an American Economic Collapse Could Actually Look Like (And How It May Be a Lot Different Than Folks Expect)

Here’s What an American Economic Collapse Could Actually Look Like (And How It May Be a Lot Different Than Folks Expect)

When we think of “economic collapse” our imaginations usually lead us immediately to the desperation we’ve witnessed in places like Venezuela or Greece. We think of starvation, a complete lack of medical care, and waves of suicide by people who simply can’t survive. We imagine an apocalyptic societal breakdown that is immediately visible.

Here in America, I suspect the collapse is going to look a lot different than it has in these other countries…at least, at first. And in my description, it’s entirely likely you’ll see that many of these signs have been happening all around us for years.

It will be gradual.

The thing with collapses that we see in the media is that we are seeing the end results of events that have been slowly declining for years. Venezuela was one of the wealthiest countries in the world back until the mid-1980s, due to their rich oil reserves. Then oil prices collapsed and their fall began. It was actually several decades though before it was truly evident that the country was in trouble.

Preparedness bloggers here have been sounding the warning bell since 2008 (at least) when our economy went into a recession. While the US managed to dig its way out of that to at least an illusion of renewed prosperity, it’s questionable how much of that return was real and how much of it was propaganda.

It’s unlikely that we’ll see just one event that says clearly to everyone, “Hey, our economy has collapsed. The Great Depression 2.0 has arrived, today, January 14, 2019, due to X event.”

…click on the above link to read the rest of the article…

Drain, drain, drain…

Drain, drain, drain…

Money from thin air going back whence it came from – circling the drain of a ‘no reinvestment’ black hole strategically placed in its way by the dollar-sucking vampire bat Ptenochirus Iagori Powelli.

Our friend Michael Pollaro recently provided us with an update of outstanding Fed credit as of 26 December 2018. Overall, the numbers appear not yet all that dramatic, but the devil is in the details, or rather in the time frames one considers.

The pace of the year-on-year decrease in net Fed credit has eased a bit from the previous month, as the December 2017 figures made for an easier comparison – but that is bound to change again with the January data. If one looks at the q/q rate of change, it has accelerated rather significantly since turning negative for good in April of last year.

Below are the most recent money supply and bank lending data as a reminder that   “QT” indeed weighs on money supply growth rates. It was unavoidable that the slowdown in money supply growth would have an impact on asset prices and eventually on economic activity.

Note that in the short to medium term, the effects exerted by money supply growth rates are far more important than any of the president’s policy initiatives, whether they are positive (lower taxes, fewer regulations) or negative (erection of protectionist trade barriers). The effects of changes in money supply growth are also subject to a lag, but in this case the lag appears to be over.

Any effects seemingly triggered by “news flow” are usually only of the very short term knee-jerk variety, and they are often anyway the opposite of what one would normally expect – particularly in phases when news flow actually lags market action (see the recent case of disappointingly weak PMI and ISM data). The primary trend cannot be altered by these short term gyrations.

…click on the above link to read the rest of the article…
 

A Debt Based System Can’t Succeed Without Population Growth

A Debt Based System Can’t Succeed Without Population Growth

A simple idea today…that the end of population growth (where it matters) is upon us.  Absent population growth among the nations that do nearly all the consuming, a debt based economic and financial system can’t ultimately succeed.  That is, without growth, assets generally don’t appreciate and debt is generally only a drag on future spending and activity.  The timing of the failure can be delayed and the gains privatized while the losses are socialized, but ultimately markets (and economies, as a means of honest exchange), will get cleared.  So, without further ado, the end of population growth:

1- Simply put, topline global population growth (births) ceased growing almost 30 years ago!  Looking solely at the top-line (chart below), note that from 1950 to 1989, annual global births increased 73% (+57 million/annually).  Conversely, from 1989 to 2018, annual global births have risen just 1% (+1 million/annually).  Data based on UN data and UN median estimates.

However, the distribution of those births among the differing groupings of nations (by income) has dramatically changed from 1950 to present…and will shift further by 2050.  The chart below shows the proportion of births among the high income, upper middle income nations, and China have nearly fallen in half since 1950…while the proportion of births among the lower middle and low income nations have soared.  More simply put, births among those that consume heavily (about 90% of total energy) have long since collapsed while births among those who consume relatively little (less than 10%) have soared.
But now, lets look at the sources and timing of those changing births and the implications for consumption.
High income nations births (blue line) and year over year change (red columns).  Incomes range from $90k to $12k, per capita, and these nations (US/Can, EU, Japan/S. Korea, Aus/NZ, etc.) consume 47% of total global energy.

 …click on the above link to read the rest of the article…
These 8 Red Flags Warn Us We’re Speeding Toward an Economic Collapse RIGHT NOW

These 8 Red Flags Warn Us We’re Speeding Toward an Economic Collapse RIGHT NOW

This isn’t exactly an article loaded with Christmas cheer, but there’s a very good reason that my family has strictly limited our holiday splurges this year. It’s because all the signs right now seem to indicate the US is hurtling toward an economic collapse.

It’s inevitable, of course. Our economy has been artificially propped up for decades, since abandoning the gold standard. We’re $21 trillion dollars in debt, an unfathomable number. The fact that other countries still lend us money boggles the mind. If the United States was a person with such a high ratio of debt that we aren’t paying off, we wouldn’t even be able to buy a car with one of those 25% interest loans, that’s how bad our credit would be.

Not only that, but there are some parties who seem to want to see the economy go belly up for their own greedy and nefarious purposes.

Here are the red flags that have me concerned about an imminent economic collapse.

The stock market is crashing.

Right now, the market is on track for a month that is equivalent to the crash of 1929, when the Great Depression began.  Both the Dow Jones Industrial Average and the S&P 500 are down by 8% during a month that is usually really good. Michael Snyder reported:

The ferocity of this stock market crash is stunning many of the experts, and many investors are beginning to panic.  Back in early October, the Dow hit an all-time high of 26,951.81, but on Monday it closed at just 23,592.98.  That means that the Dow has now plunged more than 3,300 points from the peak of the market, and many believe that this stock crash is just getting started. (source)

…click on the above link to read the rest of the article…

Why The Collapsing Chinese Credit Impulse Is All That Matters

Back in June 2017, we wrote that if one had to follow just one macro indicator that impacts virtually every aspect of the global economy, that would be the Chinese credit impulse. Not surprisingly, the article was titled “Why The (Collapsing) Credit Impulse Is All That Matters.”

Today, almost a year and a half later, the world is once again on the verge of a recession, with China – whose recent economic data has been on the verge of disaster – closely watched as the spark that could light the next global economic and financial conflagration. And not surprisingly, it is again all about the Chinese credit impulse, which – it should come as no surprise – has dropped to just shy of a fresh post-crisis low (note how it was China’s record credit impulse burst in 2009 that dragged the world out of a global recession).

So with attention focusing on China, Nomura’s Ting Lu’s this morning reiterates his view on the sequencing of China’s economic data, and expects the front-loading of exports to continue over the 90-day truce period, which will help support production in December however this benefit will be somewhat offset by weakening external demand, and thereafter into 1H19 (esp Q2), data will show significant slowdown, as the pull-forward around the tariff front-loading will fade in conjunction with the negative impacts of the cooling housing sector and the overall credit down-cycle.

As a result, Ting believes it will be in 2Q19 when Beijing is forced to escalate policy easing/stimulus measures as the data negativity hits “breaking point,” with RRR cuts, infrastructure spending, VaT cuts, RMB depreciation and deregulation in large city property sectors, which will eventually drive a bottoming-out in the data thereafter.

…click on the above link to read the rest of the article…
 

Democratizing Money

Democratizing Money

The Green New Deal has been in the air lately. In a recent piece on this website, Rob Urie writes that the Green New Deal is “the last, best hope for environmental and social resolution outside of rapid dissolution toward dystopian hell.”

Quite a claim. Let’s take a closer look.

The Green New Deal, first articulated by the Green Party but now supported by many progressive Democrats, calls for “real financial reform” to address the twin problems of climate change and economic insecurity.

Included are some of the standard proposals we regularly hear, such as restoring the Glass-Steagell Act (separating commercial and investment banking), breaking up the big banks, ending bank bailouts, reducing debt burdens, regulating derivatives, and taxing bank bonuses.

These are serious proposals, and would likely provide some relief, but they are partial measures subject to rollback and evasion–just the kind of incremental strategy that has failed for decades.

But the “real financial reform” the Green New Deal calls for goes a lot further. It promises genuine radical change with two new proposals: One is to “democratize monetary policy to bring about public control of the money supply and credit creation,” and the other is to “support the formation of federal, state, and municipal public owned banks that function as non-profit utilities.”

First, some background. Most people don’t realize that the government does not issue money; the private banking system does, by issuing loans at interest. The last time the government issued money in any quantity was during the Civil War, when so-called greenbacks were printed by the Treasury department to pay for the war. Greenbacks were not debt, but direct currency printed to give government contractors money for the goods and services provided, which they then spent into the general economy, stimulating commerce.

…click on the above link to read the rest of the article…
Olduvai IV: Courage
Click on image to read excerpts

Olduvai II: Exodus
Click on image to purchase

Click on image to purchase @ FriesenPress