Home » Posts tagged 'oil supply' (Page 14)

Tag Archives: oil supply

Olduvai
Click on image to purchase

Olduvai III: Catacylsm
Click on image to purchase

Post categories

Post Archives by Category

OPEC according to the EIA

OPEC according to the EIA

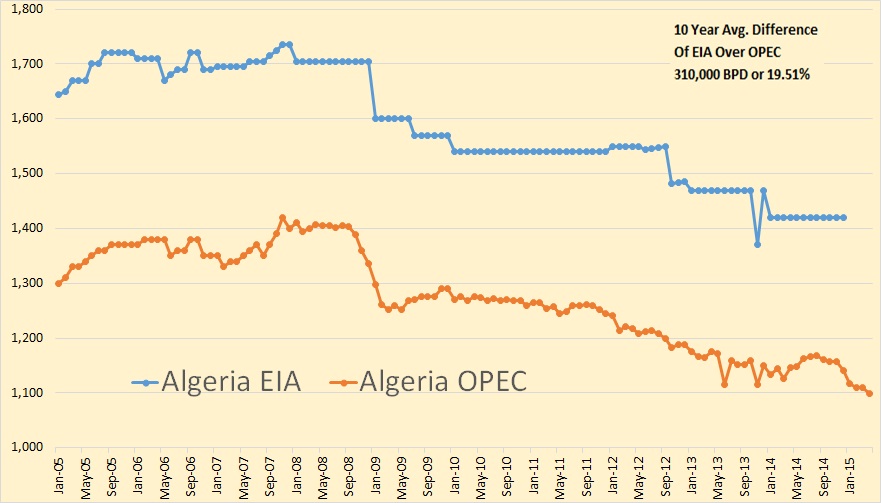
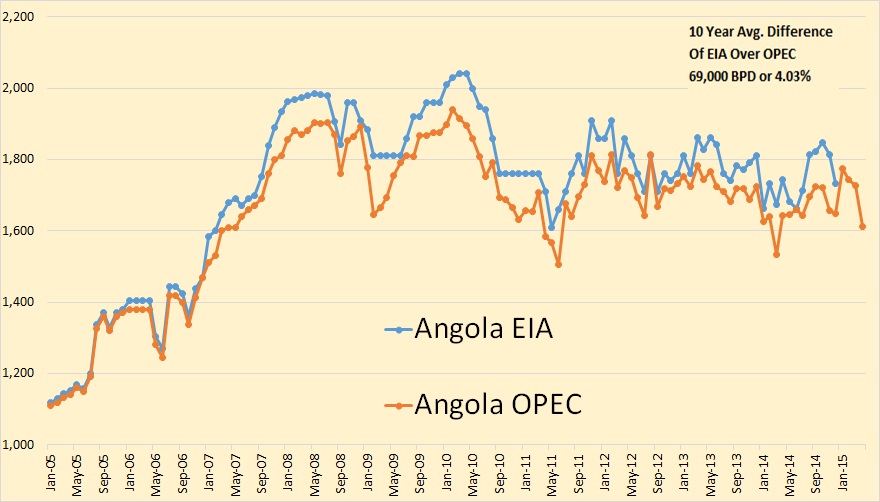
The EIA also publishes OPEC production data in their International Energy Statistics. However the EIA does not publish crude only data. Their data includes condensate.

All data is in thousand barrels per day. The last EIA data point is December 2014 and the last OPEC data point is April 2015.

O v E Algeria

Almost 20% of Algeria’s production is condensate if the EIA is correct. Algeria does produce a lot of condensate but I have serious doubts about the accuracy of the EIA data. As you can see from the chart the EIA has Algeria’s production absolutely flat for 24 months, from January 2010 through December 2011. But both the EIA and OPEC agree on one point, Algeria is in decline.

O v E Angola

Angola is one place the EIA and OPEC pretty much agree. Angola has declined by about 300,000 bpd since peaking in 2010.

…click on the above link to read the rest of the article…


What Does Exxon Know That We Don’t?

What Does Exxon Know That We Don’t?

Forecasts from the IEA and Goldman Sachs this week are trying to say that crude barrels are still overpriced – but the market isn’t listening.  I’ve been convinced that crude prices above $60 are counterproductive as Goldman said in their recent note – but other factors are continuing to help push prices higher.

Let’s take a closer look and see what’s going on – and what might go on in the near future.

Some short-term fundamentals continue to push traders into long positions in oil.  I’ve been among the first to point out the large outflows of capital from just about every other asset class, save for energy stocks and commodities.  This isn’t particularly smart analysis, but clearly money managers and institutional investors are looking for ‘value’ in a very hot market – and oil stocks and commodities look just too low to them.  For these ‘value searchers’, it’s damn the fundamentals – full speed ahead, and oil catches a bid with every, even small bullish indication.

As appears to be the case with Chinese demand, which has incrementally picked up in recent months.  But it’s not like Chinese imports aren’t being met for the most part – they are finding more oil now than ever before in their history.  And imported oil is not being used.  Several reports have Chinese oil stockpiles growing for the last 7 weeks – an obvious way for China to hoard oil that they think is going to get more expensive later.

US stockpiles have come slightly down in the last few EIA reports – a surprise for many who believed that storage would increase throughout the summer.  Many are extrapolating that this drop in stockpiles is a harbinger of slower production from slashed numbers of rig counts, but this may be very premature.

…click on the above link to read the rest of the article…

OPEC Struggling To Keep Up The Pace In Oil Price War

OPEC Struggling To Keep Up The Pace In Oil Price War

Some market watchers, such as Cornerstone Analytics (CA), have consistently stated that the underestimation of demand, coupled with over-estimation of supply, will mask the growing call on OPEC oil in the second half of this year. CA recently noted that global demand outstripped supply by some 4 million barrels in April . This comes in addition to the mounting evidence that the oil market, via rig count declines, slowing production growth, higher demand and huge API crude inventory declines, is starting to readjust.

Be that as it may, Goldman Sachs (GS) seems to believe oil must fall to $45 by October (like it previously thought $30 oil was a certainty) to clear the market and rebalance, despite signs that a readjustment is already underway. When was the last time fundaments got ignored and prices went in opposite direction? As an aside, take a look at the S&P 500 vs. GDP growth, as one makes new highs while the other falls from 3.0 percent growth to under 1 percent so far this year!

Related: Goldman Sachs Predicting $45 Oil By October

In other words, asset prices continue to be set by central bankers, and not free markets, so the GS call does make sense if you believe fundamentals don’t matter at all. Still, they should be discussed either way. Rather than being based on the fundamentals, GS, like others, have consistently been off the mark when it comes to oil prices, but refuse to acknowledge it (the agenda at GS has been exposed via Zerohedge). Multiple calls just this week for $45, on top of other economic research, clearly reveal this.


…click on the above link to read the rest of the article…

Oil Prices Will Fall: A Lesson In Gravity

Oil Prices Will Fall: A Lesson In Gravity

The oil price collapse is not over yet. It is more likely that the Brent price could fall back into the mid-$50 range than that it will continue to rise toward $70 per barrel.

That is because oil prices have risen based on sentiment alone. The fundamentals of supply and demand indicate a dismal reality: oil prices will fall and may fall hard in the near term.

Our present situation is like that of the cartoon character Wile E. Coyote. He routinely ran off of a cliff and as long as he didn’t look down, everything was fine. But as soon as he looked down and saw that there was no ground beneath him, he fell. Hope and momentum cannot overcome gravity.

WileE.Coyote

Figure 1. Wile E. Coyote cartoons. Sources: The Braiser, Dubsisms and Forbes.

Neither can ignoring the data.

When I look down from $60 WTI and almost $68 Brent, I see no support except sentiment. Like Wile E. Coyote, we need a gravity lesson about oil prices. What goes up for no reason, will come down sooner than later and it may fall hard.

Related: Big Oil May Be Caught Off-Guard By Wave Of Retirement

Let’s examine the facts.


The principal reason for the oil-price collapse is a production surplus–more supply than demand for oil. The latest data from EIA (Figure 2) indicates that the surplus is the greatest since the current oil-price collapse began. In other words, the cause of the price collapse is getting worse, not better!

WorldLiquidsProductionSurplusDeficit

Figure 2. World liquids production surplus or deficit (production minus consumption), January 2011-April 2015. Source: EIA and Labyrinth Consulting Services, Inc.


…click on the above link to read the rest of the article…

This May Just Be The Start Of The Oil Price War Says IEA

This May Just Be The Start Of The Oil Price War Says IEA

Saudi Oil Minister Ali al-Naimi may be one of the most powerful individuals in the global oil industry. After all, as the top oil official in arguably the world’s most influential oil-producing country, he has enormous influence.

But for all his power, is he the most ingenious? That question arises from the release of two reports on the current state of the oil industry that look at whether or not OPEC’s strategy of forcing US shale to cut back is succeeding.

The first, issued on May 12 by OPEC, says, in essence, that Saudi Arabia’s effort to keep its own oil production at near-record highs is succeeding in wresting market share back from US producers of shale oil, also called “light, tight oil” (LTO). The second, issued a day later by the International Energy Agency (IEA), agrees, but only up to a point.

Related: How Much Longer Can The Oil Age Last?

“In the supposed standoff between OPEC and U.S. light tight oil (LTO), LTO appears to have blinked,” the IEA reported. “Following months of cost cutting and a 60 percent plunge in the U.S. rig count, the relentless rise in U.S. supply seems to be finally abating.”

But the report from the Paris-based IEA, which advises 29 industrialized countries on energy policy, also pointed to a rebound in oil prices that could benefit US shale producers.

As both the OPEC and IEA reports point out, the decline in US shale oil output has somewhat reduced the oil glut and led oil prices to rally up to about $65 per barrel. And the IEA adds that this brings LTO back above the threshold where its production becomes profitable again.


…click on the above link to read the rest of the article…

The US-Saudi war with OPEC to prolong oil’s dying empire

The US-Saudi war with OPEC to prolong oil’s dying empire 

Whoever controls the price of oil can play god with the global economy – that’s why the US and Saudi Arabia are leading the way to smash OPEC and re-create a new global oil cartel

“No one can set the price of oil,” said Saudi oil minister Ali al-Naimi earlier this week. “It’s up to Allah.”

Which is an interesting comment given Saudi Arabia’s insistence on boosting high levels of production since last year. The strategy has maintained a global supply glut, playing a key role in the dramatic lowering of oil prices.

Although the Saudis have recently increased official selling prices in response to stronger demand, al-Naimi made clear that they have no plans to curb production.

Make no mistake – the global oil glut is not just a result of market-driven supply demand dynamics, but an intended consequence of an evolving US-Saudi strategy to use oil as a weapon.

That is not to suggest that the US and Saudi Arabia are in complete agreement over the strategy, or even that it is being hatched and executed in total coordination. Rather, an uneasy convergence of mutual interests has given rise to a strategic accommodation between the two allies.

The targets of the strategy include their chief geopolitical rivals, climate change activists and renewable energy advocates.

Playing god with oil

The idea of using oil to play god is hardly new, but for the Obama administration it dawned with the US shale gas boom.

In the summer of 2013, Obama’s then national security adviser Tom Donilon, explained in Foreign Affairs, that the surge in US domestic energy production “allows Washington to engage in international affairs from a position of strength”.

– See more at: http://www.middleeasteye.net/columns/us-saudi-war-opec-prolong-oil-s-dying-empire-222413845#sthash.JYZfA68W.dpuf

Global oil glut grows to 2 million barrels a day as OPEC pumps more

Global oil glut grows to 2 million barrels a day as OPEC pumps more

International Energy Agency predicts oversupply of refined fuel, but points to rising demand

Fresh data on worldwide crude production shows the global glut of oil is growing with Saudi Arabia’s production near record highs, according to the International Energy Agency.

And there are signs the oversupply is moving into the market for refined products such as gasoline, meaning the recent rally in oil prices could lose steam, the IEA said in a report released today.

OPEC crude supply rose by 160,000 barrels a day to 31.21 million barrels a day in April, the highest since September 2012.  Iraq and Iran boosted their output and top exporter Saudi Arabia was increasing its rig count.

There has been a slowdown in U.S. production, but global oil supply is still exceeding demand by two million barrels a day.

Many in the North American oilpatch have accused the Saudis of keeping output high to drive down U.S. production.

On the up side, there has been recovery in demand for crude as the U.S. and European economies gain steam. Demand for crude this year is projected to grow to as high as 1.1 million barrels a day, with the big surge expected later in the year.

U.S. data released today shows commercial crude inventories fell by 2.19 million barrels in the week ended May 8, the second week that inventories have fallen after rising for months.


WTI slips to $60

The new data on the worldwide oil glut hit oil prices in afternoon trading. West Texas Intermediate crude was down 62 cents to $60.13 US a barrel at the close, while Brent oil, the international crude contract, was off 34 cents at $66.52.

Meanwhile, Western Canada Select, the main Canadian contract continued to close the gap with WTI, moving close to its high for the year of $52.50.

Refiners have been buying more crude to take advantage of the low prices and are refining oil for summer driving earlier than usual. The signs of an uptick in oil prices helped accelerate their purchase of crude.

There are plenty of players who predict a fresh downturn in WTI prices as U.S. producers see the higher prices and turn the taps on again.


Saudi Arabia, Russia in No Mood to Cave to US Fracking Boom

Saudi Arabia, Russia in No Mood to Cave to US Fracking Boom

The recently vaunted decline in US crude oil production, supported by granular estimates, has been used in rationalizing the newly sizzling rally in oil prices. Analysts are digging through local details to come up with clues where this might be going. Money is re-pouring into the sector. And folks are already espousing the next stage, that the glut is over and that a shortage will set in soon, or something.

Alas, the decline in US oil production is, let’s say, relative. The EIA estimated that in the week ended May 1, producers pumped 9.369 million barrels per day. So that’s down from the crazy peak set during week ended March 20 of 9.422 MMbpd. Halleluiah, production is back where it was on March 6! And it’s up 12.2% from a year ago!

Note the circled areas in the chart: these weekly estimates are inherently volatile. In 2014, there were several periods of much sharper declines, even before the oil bust began in early July. Compared to those declines, the recent levelling off – and that’s all it is at this point – seems mild.

US-oil-production-weekly-2014-2015=May01

With US crude oil production on a weekly basis just a smidgen off its crazy peak in March, the other two of the world’s top three producers aren’t cutting back either.

Russia pumped 10.71 MMbpd in April, same as in March. Both months beat last year’s post-Soviet record average of 10.58 MMbpd.

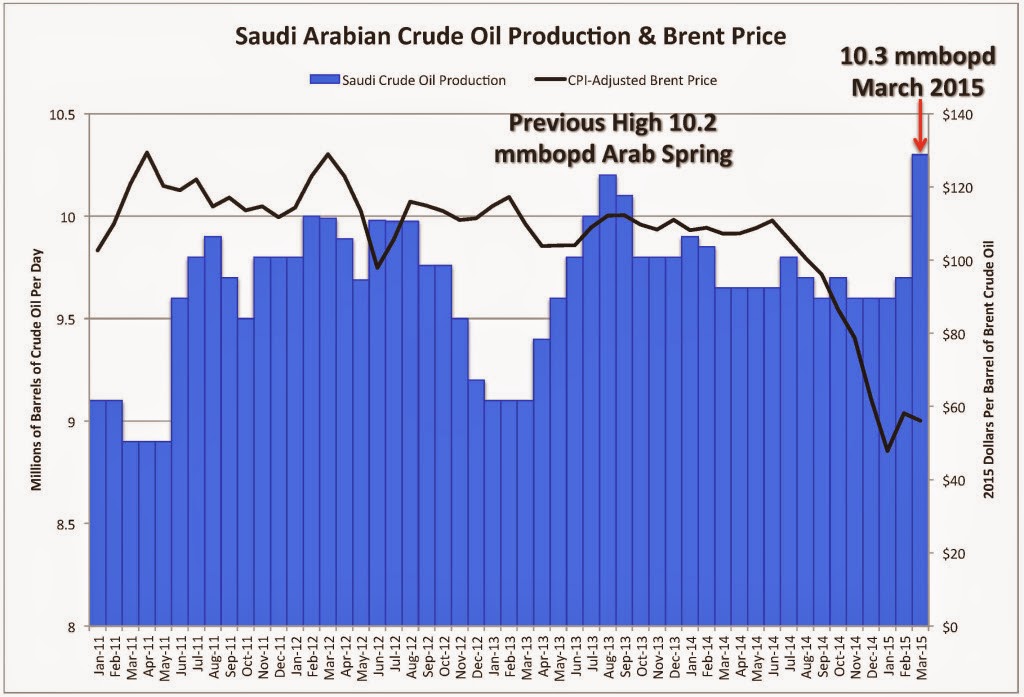
And Saudi Arabia produced a record 10.31 MMbpd in April, after having already set a record in March of 10.29 MMbpd, “a Gulf industry source” told Reuters today. Production in both months beat the prior record going back to the early 1980s of 10.2 MMbpd set in August 2013.


…click on the above link to read the rest of the article…

Saudi Arabia Continues To Turn Screws On U.S. Shale

Saudi Arabia Continues To Turn Screws On U.S. Shale

Saudi Arabia continues to ratchet up production, taking market share away from U.S. shale producers.

According to OPEC’s latest monthly oil report, Saudi Arabia boosted its oil output to 10.31 million barrels per day in April, a slight increase over the previous month’s total of 10.29 million barrels. That was enough for the de facto OPEC leader to claim its highest oil production level in more than three decades.

Saudi Arabia has increased production by 700,000 barrels per day since the fourth quarter of 2014 in an effort maintain market share. The resulting crash in oil prices is forcing some production out of the market, and Saudi Arabia intends for the brunt of that to be borne by others.

Related: California’s Climate Goals: Realistic Or Just Wishful Thinking?

There is a lag between movements in the oil price and corresponding changes in production. OPEC says there was a 23-week time lag between the fall in rig counts and the resulting dip in oil production in the United States. But the effects of the oil price crash are now being felt. New data from the EIA says that U.S. oil production is declining. Having already predicted a 57,000 barrel-per-day decline for May, the agency now says that another 86,000 barrels per day in output will vanish in June.

In other words, as Saudi Arabia ramps up, U.S. shale is being forced to cut back. This story has been told many times over the past few months, but the data is finally confirming the success of Saudi Arabia’s strategy, albeit a minor one thus far.


…click on the above link to read the rest of the article…


Oil Rigs Down Almost Universally

Oil Rigs Down Almost Universally

All rig count data is provided by Baker Hughes. All monthly charts are oil rigs only. Gas rigs are not included in the count. The last data point for all monthly charts is April 2015.

When I talk about “peaks” in this post I am only speaking of the peak since 2011 and am not suggesting that there were not higher peaks in previous years.

(Click all charts for larger version)

InternationalRigCount

The International Rig Count has fallen by 150 rigs, from 1,080 in July 2014 to 930 in April 2015. This count does not include the USA, Canada or any of the FSU countries.

EuropeanRigCount

The European Oil Rig Count dropped from 96 in October and November to 65 in April.

AfricanRigCount

The African Rig count peaked at 123 in February and dropped to 88 in April.

…click on the above link to read the rest of the article…


Changes to Total Global Credit Affects The Oil Price

Changes to Total Global Credit Affects The Oil Price

In some posts on Fractional Flow I have presented some of my explorations of any relations between the oil price, changes to global total credit/debt and interest rates. My objective has been to gain and share some of my insights of how I see the economic undertows that also influences the price formation for crude oil.

I have earlier asserted;

  • Any forecasts of oil (and gas) demand/supplies and oil price trajectories are NOT very helpful if they do not incorporate forecasts for changes to total global credit/debt, interest rates and developments to consumers’/societies’ affordability.

In this post I present results from an analysis of developments to the annual changes in total debt in the private, non financial sector of some Advanced Economies (AE’s), and 5 Emerging Economies (EME’s) from Q1 2000 and as of Q3 2014 with data from the Bank for International Settlements (BIS in Basel, Switzerland).

The AE’s are: Euro area, Japan and the US.

The 5 EME’s are: Brazil, China, India, Indonesia and Thailand which in the post are collectively referred to as “The 5 EME’s”.

Year over year (YOY) changes in total private debt for the analyzed economies were juxtaposed with YOY changes in total petroleum consumption in these based upon data from BP Statistical Review 2014.

  • As the AE’s slowed growth in, and/or deleveraged their total private debt after the Global Financial Crisis (GFC) in 2008/2009, the EME’s continued their strong growth in total private debt and China accelerated it significantly in 2009.
  • The AE’s petroleum consumption declined noticeably as from 2007, resulting from the combination of high oil prices and tepid debt growth and/or deleveraging.
  • The EME’s remained defiant to high oil prices and continued their strong growth in petroleum consumption, which likely was made possible by strong growth in total private debt.
  • Demand remains what the consumers can pay for!

…click on the above link to read the rest of the article…

The U.S. Production Decline Has Begun

The U.S. Production Decline Has Begun

It is not because of decreased rig count. It is because cash flow at current oil prices is too low to complete most wells being drilled.

The implications are profound. Production will decline by several hundred thousand of barrels per day before the effect of reduced rig count is fully seen. Unless oil prices rebound above $75 or $85 per barrel, the rig count won’t matter because there will not be enough money to complete more wells than are being completed today.

Tight oil production in the Eagle Ford, Bakken and Permian basin plays declined approximately 111,000 barrels of oil per day in January. These declines are part of a systematic decrease in the number of new producing wells added since oil prices fell below $90 per barrel in October 2014 (Figure 1).

Chart_ALL New Prod Wells
Figure 1. Eagle Ford, Bakken and Permian basin new producing wells by month and WTI oil price. Source: Drilling Info and Labyrinth Consulting Services, Inc.
(Click image to enlarge)

Deferred completions (drilled uncompleted wells) are not discretionary for most companies. Producers entered into long-term rig contracts assuming at least $90 oil prices. Lower prices result in substantially reduced cash flows. Capital is only available to fulfill contractual drilling commitments, basic costs of doing business, and to complete the best wells that come closest to breaking even at present oil prices.

Much of the new capital from junk bonds and share offerings is being used to pay overhead and interest expense, and to pay down debt to avoid triggering loan covenant thresholds.Hedges help soften the blow of low oil prices for some companies but not enough to carry on business as usual when it comes to well completions.


…click on the above link to read the rest of the article…

Saudi Arabia: the great oil game

Saudi Arabia just increased oil production to a record level, never reached in previous history. They are doing that in a moment of record low oil prices. What do they have in mind? (Image from Arthur Berman)

When the collapse of the oil prices started, in the summer of 2014, everyone noticed that Saudi Arabia was not playing their traditional role of “swing producers”, that is varying their production in such a way to maintain reasonably constant prices. Facing a slump in demand, they should have reduced production; but they didn’t.

Initially, I thought the Saudis were simply taken by surprise and they were slow to react. But now, with the recent increase in Saudi production, it is clear that they have something in mind. Maybe they haven’t engineered the market collapse, but in some way they are riding it.

Though this be madness, yet there is method in it. But what method could there be in raising production just when prices are lowest? Every single textbook in economics will tell you that the market should adapt to changes in demand and offer in exactly the opposite way: facing a reduced demand, production should go down, too. 

Of course, as we all know, what you read in textbooks of economics has little to do with the real world. And, in the real world, there is a well known market strategy that consists in bankrupting your competitors by selling below cost. The idea is to create a monopoly and recoup later what the winner of the struggle has lost at the beginning. It is, of course, illegal, but the very fact that there are laws against it, means that it is done.

…click on the above link to read the rest of the article…


No Steep Decline In U.S Oil Production Expected Anytime Soon

No Steep Decline In U.S Oil Production Expected Anytime Soon

Increased oil output in the US has kept World oil output from declining over the past few years and a major question is how long this can continue. Poor estimates by both the US Energy Information Administration (EIA) and the Railroad Commission of Texas (RRC) for Texas state wide crude plus condensate (C+C) output make it difficult to predict when a sustained decline in US output will begin.

About 80 to 85% of Texas (TX) C+C output is from the Permian basin and the Eagle Ford play, so estimating output from these two formations is crucial. I have used data from the production data query (PDQ) at the RRC to find the percentage of TX C+C output from the Permian (about 44% in Feb 2015) and Eagle Ford plays (40% in Feb 2015).

Dean’s estimates of Texas C+C output are excellent in my opinion and are close to EIA estimates through August 2014. I used EIA data for TX C+C output through August 2014 and Dean’s best estimate from Sept 2014 to Feb 2015. By multiplying the % of C+C output from the RRC data with the combined EIA and Dean’s estimate, I was able to estimate Eagle Ford and Permian output. The chart below shows this output in kb/d.

PermianEagleFordKBD

The following chart shows the combined Permian and Eagle Ford output from 2012 to 2015 in kb/d, this chart is not zero scaled.

Permian+EF

Below I have created a few scenarios for the Bakken and Eagle Ford. This analysis is based on the pioneering work by Rune Likvern at the Oil Drum (Red Queen series) and his blog at Fractional Flow, any errors in analysis are mine. I doubt that Mr. Likvern would speculate beyond 2 years forward in time (or he has not done so in the past). The data gathered from the North Dakota Industrial Commission (NDIC) by Enno Peters was also instrumental in the Bakken/Three Forks model.


…click on the above link to read the rest of the article…

A Plot To Hold Down Oil Prices Or Just A Happy Coincidence?

A Plot To Hold Down Oil Prices Or Just A Happy Coincidence?

The recent unprecedented surge in oil imports has again prompted a review of things here. In a prior story, we wrote that the lack of capacity to process light sweet crude at refineries produced via shale plays could be playing a role in the stock build. As mentioned previously, refineries over the next 24 months are expected to add 700,000 B/D in capacity to handle this type of crude. In the meantime, we have noticed an unusual amount of crude being imported, possibly as a result of this imbalance in refinery capacity. Or could it be that a more sinister plot is afoot?

To quantify the scale of the issue, we turn to Cornerstone Analytics’ work in uncovering the magnitude of the impact of imports on the rise in oil inventory stocks. We haven’t seen this level of import imbalance period since 2013, as the chart below demonstrates via Cornerstone. In the past 6 months, the level of imports relative to the requirement or need by refineries has jumped not once but twice. The 1M B/D “gap” goes a long way in explaining the oil inventory stock build which has been 5MB-10MB per week.

If adjusted, the builds over the past 6 months without such imports would not exist at all or at the very least be greatly reduced. So is this occurring as part of the inability of refineries to handle the mix of output domestically or is this part of some plot to build inventories to crash the prices of oil? Quite frankly we can’t say for sure but anomalies such as this must be exposed so that they can be debated given that there has been ample debate on Saudi motivations for holding down oil prices and the ongoing media cheerleading on lower oil prices.


…click on the above link to read the rest of the article…

Olduvai IV: Courage
Click on image to read excerpts

Olduvai II: Exodus
Click on image to purchase

Click on image to purchase @ FriesenPress