Home » Posts tagged 'eia' (Page 12)

Tag Archives: eia

Olduvai
Click on image to purchase

Olduvai III: Catacylsm
Click on image to purchase

Post categories

Post Archives by Category

Oil Prices Most Volatile Since 2009

Oil Prices Most Volatile Since 2009

The nearly 20 percent rally in oil prices over the past week raised hopes in the oil industry that the financial bloodshed might be over. But hopes were quickly dashed on February 4 when prices erased much of their gains – March deliveries of WTI dropped by a whopping 8 percent in a single day.

Oil prices had risen over a three-day stretch on the back of major capital expenditure cuts among the oil majors. BP, ExxonMobil, Chevron, ConocoPhillips, and Royal Dutch Shell have all promised multi-billion dollar reductions in their spending for the year, recognizing the bear market for crude. The realignment in spending encouraged oil markets as investors hoped that the production overhang was close to balancing out. On top of that, rig counts dropped at the quickest rate on record the end of January.

As such, many thought that the supply-side was quickly correcting to the new low-price environment. But the storm may not be over.

Related: The Cure For Low Oil Prices Is Low Oil Prices

The Energy Information Administration (EIA) released its weekly status updateon crude oil inventories across the country. The EIA reported that oil stockpiles (excluding the Strategic Petroleum Reserve) increased by 6.3 million barrels, way above analysts’ estimates of about 3.7 million barrels. That has total oil inventories at 413 million barrels, the highest level in over 80 years.


…click on the above link to read the rest of the article…

Essential Oil Production Statistics – February 2015

Essential Oil Production Statistics – February 2015

This is the second in a monthly series of posts chronicling the action in the global oil market in 12 key charts. The January 2015 post is hereEIA oil price and Baker Hughes rig count charts are updated to end January 2015, the remaining oil production charts are updated to December 2014 using the IEA OMR data. The main oil production changes from November to December are:

  • World total liquids up 150,000 bpd
  • OPEC up 80,000 bpd
  • N America up 80,000 bpd
  • Russia and FSU up 180,000 bpd
  • Europe down 70,000 bpd (compared with December 2013)
  • Asia down 60,000 bpd

1. The continued growth in production into December shows that global production growth had significant momentum that has not yet been curtailed by the price rout.
2. The fall in the oil price continued throughout January, WTI hitting a low of $44.80 on January 26th and Brent hitting a low of $45.13 on January 13th.
3. The main dynamic statistic has been the plunge in US oil rig count down to 1223 rigs on January 30th from a recent high of 1609 rigs on October 10th 2014.
4. The rig count news led to a strong rally in oil price on 30th January.
5. I anticipate that the price rout is not yet over and it will require significant falls in production to take root before a real price recovery gets underway.

…click on the above link to read the rest of the article…


Increasing Demand For Refined Products Will Increase Oil Prices

Increasing Demand For Refined Products Will Increase Oil Prices

In last week’s article I posted a chart from the International Energy Agency’srecent Oil Market Report that shows global demand for refined products catching up to supply by the 3rd quarter of this year. My opinion is that all of the analysts who are now blaming the sharp drop in oil prices on a “glut” of supply could change their tune quickly as consumers adjust to lower fuel costs. Just as higher costs reduce demand for any commodity, lower costs will increase demand. This is especially true for a commodity that has a direct impact on standard of living, like oil does.

When the price of gasoline plunged below $1.00/gallon in 1986, demand for motor fuels and other refined products increased by almost 5% within twelve months. Today, world demand for hydrocarbon based liquid fuels (including biofuels) is over 92.5 million barrels per day. You can go to the IEA website and see for yourself that normal seasonal demand is expected to push demand over 94.0 million barrels per day within six months. I think both the IEA and our ownEnergy Information Administration (EIA) are grossly underestimating the price related demand increase that is already starting to show up in the data.

Last week’s EIA report confirms that demand is already surging in the United States. Granted, part of the year-over-year increase in gasoline consumption may be a result of the harsh winter weather we had last year, but I think this story is going to play out. If gasoline prices remain low until this summer, we should see a sharp increase in the number of Americans that decide to take long driving vacations this year. We do love our SUVs.

…click on the above link to read the rest of the article…


Worldwide Drilling Productivity Report

Worldwide Drilling Productivity Report

The EIA publishes what they call a Drilling Productivity Report in which they claim that each rig is getting more productive, that is each rig produces just a little more oil each month than it did the previous month. But over the long haul, I find that the exact opposite is true. In every place in the world, each rig produces a little less oil every year.

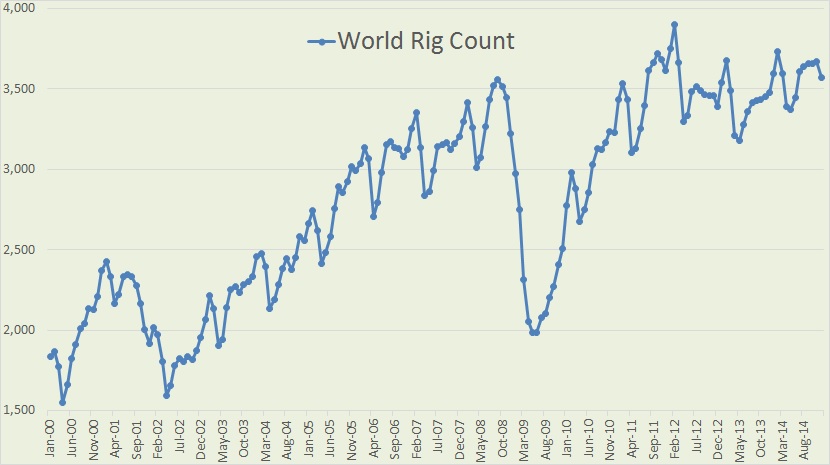
Baker Hughes publishes monthly their International Rig Count where we can find the world rig count back to 1975. However I only looked at the last 15 years and found some surprising results.

The last “Rig Count” data point on all charts below is December 2014. Also, very important, the rig count includes rigs drilling for gas as well as oil since Baker Hughes does not break down international rigs down to either gas or oil. They just give us the total rig count.

World Rig Count

The last price collapse we had, in late 2008, the rig count dropped by over 1,570 between September 2008 and May 2009.

…click on the above link to read the rest of the article…


U.S. Department of Energy: Our forecasts aren’t really forecasts (or are they?)

U.S. Department of Energy: Our forecasts aren’t really forecasts (or are they?)

Put this in the category of things that can’t be true, but that are nevertheless affirmed with a straight face: The U.S. Energy Information Administration (EIA), the statistical arm of the U.S. Department of Energy, does not issue forecasts, at least not long run forecasts.

So says Howard Gruenspecht, deputy administrator of the EIA, in a letter to Nature, the respected science journal. Gruenspecht was responding torecent coverage of an alleged EIA forecast which paints a rosy picture of U.S. domestic oil and natural gas production through 2040, a view challenged by the article in question.

Here is the bureaucratese from the letter: “Contrary to the presentation in the Nature article, EIA does not characterize any of its long run projection scenarios as a forecast.” Long run projection scenarios….huh. What could those actually be if not forecasts? And, why is the deputy administrator making such a big deal of this? We’ll come back to the second question later.

There has been little notice concerning the flap over coverage of the EIA’s recent nonforecast and the divergence of that set of “projections” from another much more pessimistic forecast issued by the Bureau of Economic Geology at the University of Texas at Austin. To cut to the chase, Naturestands by its story; and, I see no reason why it shouldn’t.

Perhaps the most important piece of information to come out of this kerfuffle is the insistence by the EIA that it doesn’t issue forecasts. Imagine my surprise! I have been perusing the EIA’s statistics on an almost weekly basis for years, and I have occasionally offered critiques of what I was sure were forecasts–lengthy complicated documents with color graphics and tables and elaborate justifications for energy production numbers far into the future. What’s more, everyone else called these documents forecasts, too.

…click on the above link to read the rest of the article…


EIA’s Short-Term Energy Outlook 2015 and 2016

EIA’s Short-Term Energy Outlook 2015 and 2016

The EIA has just released their Short-Term Energy Outlook for January. They have now included their predictions for 2016. Here is what they expect for US C+C. I have made the first projected production for December 2014 though the EIA says they have production data for December. All date is in million barrels per day through December 2016.

TotalUSC+C

The EIA is saying that US C+C will peak at 9.47 mb/d in May 2015, drop 330,000 barrels per day by September 2015 then recover, apparently because the price of oil will recover. Or perhaps they have another reason. They do not have US production surpassing May 2015 until July of 2016.

The EIA only gives C+C outlook numbers for domestic production. However they do project total liquids for all Non-OPEC nations. But first here is what they are predicting for US total liquids:

…click on the above link to read the rest of the article…


Bakken, Let’s Do The Math

Bakken, Let’s Do The Math

There has been considerable dispute over how many new wells required to keep production flat in the Bakken and Eagle Ford. One college professor posted, over on Seeking Alpha, figures that it would take 114 rigs in the Bakken and 175 in Eagle Ford to keep production flat. He bases his analysis on David Hughes’ estimate that the legacy decline rate fir Bakken wells is 45% and 35% for Eagle Ford wells. And he says a rig can drill 18 wells a year, or about one well every 20.3 days.

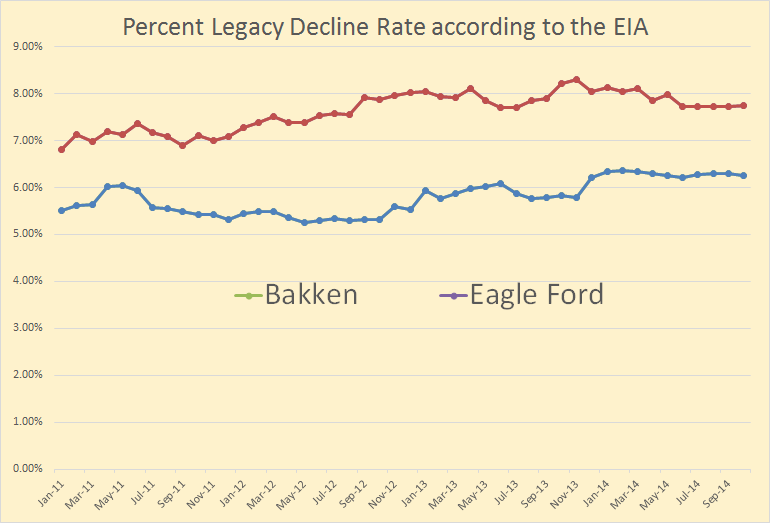
The EIA has comes up with different numbers. The data for the chart below was taken from the EIA’sDrilling Productivity Report.

Legacy Decline

The EIA has current legacy decline at about 6.3% per month for Bakken wells and about 7.7% per month for Eagle Ford wells. That works out to be about 54% per year for the Bakken and 62% per year for Eagle Ford. I believe the EIA’s estimate of legacy decline, in this case, is fairly accurate. For instance last month Mountrail County had over 30 new wells completed yet still declined by 6.4%. And in December 2013 North Dakota declined by 5.22% yet had 119 new well completions.


…click on the above link to read the rest of the article…
US Sees Huge Energy Opportunity In Europe

US Sees Huge Energy Opportunity In Europe

If 2015 is anything like 2014 we can expect a wild ride. Oil price volatility – including its downward trend – will linger well into the first and second quarters as global production persists and key conflicts in Eastern Europe and the Middle East show no end. For its part, the United States is better positioned than most – the US is poised to carry the global economy in 2015 with projected GDP growth of 3.1 percent. However, converting this potential into meaningful energy trade and/or soft power is another matter altogether and 2015 offers limited opportunities.

US production has shown no signs of a significant slowdown and the Energy Information Administration predicts growth in 2015 – approximately 700,000 barrels per day. Despite the collapse, prices remain high enough to support the most vital development drilling activity in the Bakken, Eagle Ford, and Permian Basins. The rig count is declining, but data from the 2008-09 recession suggests a drop in production will not be so dramatic.

Drilling In North Dakota 08-09

Perhaps in anticipation of greater volumes, the Obama administration and the Department of Commerce clarified existing regulations and opened the door for increased US exports last week – up to one million barrels per day (mbpd) of ultra-light crude oil. The exports will expose producers to more lucrative markets abroad and may further narrow the price spread between Brent and WTI. But who’s buying?

…click on the above link to read the rest of the article…


Petroleum Truth Report: David Hughes Weighs In on The Fracking Fallacy Debate

Petroleum Truth Report: David Hughes Weighs In on The Fracking Fallacy Debate.

In the current debate about the Nature article “The Fracking Fallacy,” the discussion has focused on estimates of cumulative production of shale gas plays by the Energy Information Administration (EIA) and The Bureau of Economic Geology at the University of Texas (UT/BEG). 

David Hughes provides another estimate in his recent post “Fracking Fracas: The Trouble with Optimistic Shale Gas Projections by the U.S. Department of Energy,” a summary of his comprehensive study of all U.S. shale plays Drilling Down published by The Post Carbon Institute.

The Fracking Fallacy debate is important because it casts doubt on the reliability of government estimates of our natural gas supply.  If U.S. gas production is in decline by the early 2020s as described in the Nature article, or sooner as I suspect, then important policy decisions about the export of natural gas and the retirement of coal-fired electric power plants have been based on questionable information. 

Cumulative production estimates are interesting but do not address the economics of shale plays.  Proven reserves provide a more meaningful estimate because they supposedly represent volumes of oil and gas that can be produced commercially at a particular price.  

…click on the above link to read the rest of the article…
Fracking Fracas: The Trouble with Optimistic Shale Gas Projections by the U.S. Department of Energy Post Carbon Institute

Fracking Fracas: The Trouble with Optimistic Shale Gas Projections by the U.S. Department of Energy Post Carbon Institute.

On December 3, 2014, Nature published “Natural Gas: The Fracking Fallacy”, which suggested that the forecasts of the Energy Information Administration (EIA) for four major U.S. shale gas plays were wildly optimistic, based on a comparison to forecasts for the same plays by the University of Texas Bureau of Economic Geology (UT/BEG). This was followed by a formal denunciation of the article both by the EIA and UT/BEG, despite the fact that the substance of the article was correct. Arthur Berman provided an excellent overview of the merits—or in this case the lack thereof—of the attack by both of these agencies on what is essentially the reality behind the shale revolution.

The Nature piece steered clear of any discussion of my recent Drilling Deeper report (published by Post Carbon Institute), which looked at twelve major shale gas and tight oil plays accounting for most of U.S. shale production, and which also came to the conclusion that the EIA’s projections were extremely optimistic. Naturefocused instead on the four plays described in two published and two unpublished studies by UT/BEG. TheNature article sparked a lot of media attention, which prompted the EIA and UT/BEG to issue rebuttals.

The argument of the EIA and UT/BEG that their projections of shale gas production from the plays mentioned in the Nature article are fundamentally similar is untrue, given the publicly available data. The implications of the EIA being wrong on its projections of cheap and abundant gas for decades are considerable, given that investment decisions are now being made based on these projections— including construction of infrastructure for LNG exports, gas-fired generation and even crude oil exports. Hence it is worthwhile to examine the EIA’s optimistic projections in more detail in light of the projections available from UT/BEG and the Drilling Deeperreport (DD).

…click on the above link to read the rest of the article…

Cheap Oil: Too Much Of A Good Thing? | Jaya Bajpai | LinkedIn

Cheap Oil: Too Much Of A Good Thing? | Jaya Bajpai | LinkedIn.

The 40% drop in oil prices over the past 6 months has garnered a lot of attention recently, most of it focused on the economic stimulus lower oil prices should provide the global economy, the impact on currency and fixed-income markets and the increase in economic pain suffered by exporters such as Iran and Russia. In this article, I draw on historical data to assess the potential increase in geopolitical tail risk that lower oil prices may represent. I believe this is an overlooked consequence of lower oil prices that, while low probability, would have an outsize impact on the global economy – a classic “fattening of the tail”. I look at monthly and aggregate data to smooth out daily fluctuations and avoid having us mistake the forest for the trees.

The data shows that in the 1980s, the most-cited oil price war, the average price of oil dropped from approximately $28/barrel in 1985 to a low of $11.58/barrel in July 1986 (US Energy Information Administration data for monthly average front month futures contract price). This would be analogous to a drop from $60/barrel to $25/barrel in 2014 prices, using the US Bureau of Labor Statistics CPI calculator. Prices subsequently rebounded almost 60% from that July 1986 low, ranging between $16/barrel and $20/barrel for the rest of the 1980s. (There were a few months in that 4 year timespan where the average dropped below $15/barrel, but I want to focus on the big picture in this article.) Inflation-adjusted to 2014 price levels, oil prices ranged between $29/barrel and $37/barrel.

…click on the above link to read the rest of the article…

The 2014 Oil Price Crash Explained | Energy Matters

The 2014 Oil Price Crash Explained | Energy Matters.

  • In February 2009 Phil Hart published on The Oil Drum a simple supply demand model that explained then the action in the oil price. In this post I update Phil’s model to July 2014 using monthly oil supply (crude+condensate) and price data from the Energy Information Agency (EIA).
  • This model explains how a drop in demand for oil of only 1 million barrels per day can account for the fall in price from $110 to below $80 per barrel.
  • The future price will be determined by demand, production capacity and OPEC production constraint. A further fall in demand of the order 1 Mbpd may see the price fall below $60. Conversely, at current demand, an OPEC production cut of the order 1 Mbpd may send the oil price back up towards $100. It seems that volatility has returned to the oil market.

…click on the above link to read the rest of the article…

How Low Can the Price of Oil Plunge? | Wolf Street

How Low Can the Price of Oil Plunge? | Wolf Street.

It is possible that a miracle intervenes and that the price of oil bounces off and zooms skyward. We’ve seen stocks perform these sorts of miracles on a routine basis, but when it comes to oil, miracles have become rare. As I’m writing this, US light sweet crude trades at $76.90 a barrel, down 26% from June, a price last seen in the summer of 2010.

But this price isn’t what drillers get paid at the wellhead. Grades of oil vary. In the Bakken, the shale-oil paradise in North Dakota, wellhead prices are significantly lower not only because the Bakken blend isn’t as valuable to refiners as the benchmark West Texas Intermediate, but also because take-away capacity by pipeline is limited. Crude-by-rail has become the dominant – but more costly – way to get the oil from the Northern Rockies to refineries on the Gulf Coast or the East Coast.

These additional transportation costs come out of the wellhead price. So for a particular well, a driller might get less than $60/bbl – and not the $76.90/bbl that WTI traded for at the New York Mercantile Exchange.

Fracking is expensive, capital intensive, and characterized by steep decline rates. Much of the production occurs over the first two years – and much of the cash flow. If prices are low during those two years, the well might never be profitable.

…click on the above link to read the rest of the article…

The Peak Oil Crisis: A Reality Check Post Carbon Institute

The Peak Oil Crisis: A Reality Check Post Carbon Institute.

For the last four or five years, we have been bombarded with a stream of stories about the “shale revolution.” Horizontal drilling and fracking, mostly in the U.S., were said to have released oceans of new oil and a virtually endless supply of natural gas. These developments have brought, or will soon bring, great benefits to the American people. Our oil imports are down as are gasoline prices. Factories utilizing the flood of natural gas will soon create many new jobs as manufacturing returns to the US. We will soon have so much oil and natural gas that we can export much energy to our friends and teach our enemies a lesson.

Now it is perfectly true that there has been a major increase in US oil and natural gas production in recent years. Oil production is up by some 4 million b/d and natural gas production is up by 5 trillion cubic feet/year since the boom began. What the stories about all this abundance fail to address, outside of vague generalizations, is just how long this upward surge is going to last and what happens then.

To fill in the gap between oil companies, their consultants, their financiers, and friendly media hype, we have only the Department of Energy’s Energy Information Administration (EIA) to guide us on the many critical decisions ahead. Now the EIA does not have a very good track record when it comes to projecting the future. Until last winter two-thirds of America’s shale oil reserves were supposed to be buried under California which would become fabulously wealthy when we brought it to the surface. Then all of a sudden, and likely under pressure from outside observers, California’s shale oil was not there. The whole notion of oceans of oil under California was nothing but oil company hype, aided by a consultant, and a stamp of approval from the EIA.

…click on the above link to read the rest of the article…

Drilling Deeper Post Carbon Institute

Drilling Deeper Post Carbon Institute.

Abstract

Drilling Deeper reviews the twelve shale plays that account for 82% of the tight oil production and 88% of the shale gas production in the U.S. Department of Energy’s Energy Information Administration (EIA) reference case forecasts through 2040. It utilizes all available production data for the plays analyzed, and assesses historical production, well- and field-decline rates, available drilling locations, and well-quality trends for each play, as well as counties within plays. Projections of future production rates are then made based on forecast drilling rates (and, by implication, capital expenditures). Tight oil (shale oil) and shale gas production is found to be unsustainable in the medium- and longer-term at the rates forecast by the EIA, which are extremely optimistic.

This report finds that tight oil production from major plays will peak before 2020. Barring major new discoveries on the scale of the Bakken or Eagle Ford, production will be far below the EIA’s forecast by 2040. Tight oil production from the two top plays, the Bakken and Eagle Ford, will underperform the EIA’s reference case oil recovery by 28% from 2013 to 2040, and more of this production will be front-loaded than the EIA estimates. By 2040, production rates from the Bakken and Eagle Ford will be less than a tenth of that projected by the EIA. Tight oil production forecast by the EIA from plays other than the Bakken and Eagle Ford is in most cases highly optimistic and unlikely to be realized at the medium- and long-term rates projected.

…click on the above link to read the rest of the article…

Olduvai IV: Courage
Click on image to read excerpts

Olduvai II: Exodus
Click on image to purchase

Click on image to purchase @ FriesenPress