Home » Posts tagged 'eia' (Page 11)

Tag Archives: eia

Olduvai
Click on image to purchase

Olduvai III: Catacylsm
Click on image to purchase

Post categories

Post Archives by Category

World Oil Output Last 3 Years

World Oil Output Last 3 Years

The EIA publishes every possible energy stat for the USA and hardly anything for the rest of the world. Well, anything current for the rest of the world anyway. TheirInternational Energy Statistics is already five full months behind and working on six. December 2014 is the last international oil production data we have.

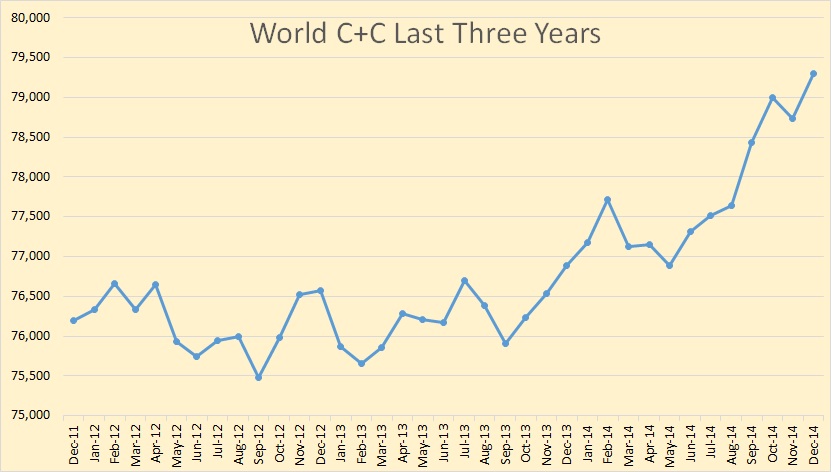
Anyway during this lull in other data I decided to look at the last three years of international data, from December 2011 to December 2014. All data is in thousand barrels per day.Post 1

World C+C production was flat for most of 2012 and 2013 but in late 2013 production took off and has increased by about 3 million barrels per day above the average for 2012 and 2013. December C+C production was 79,300,000 BPD.

Post 4

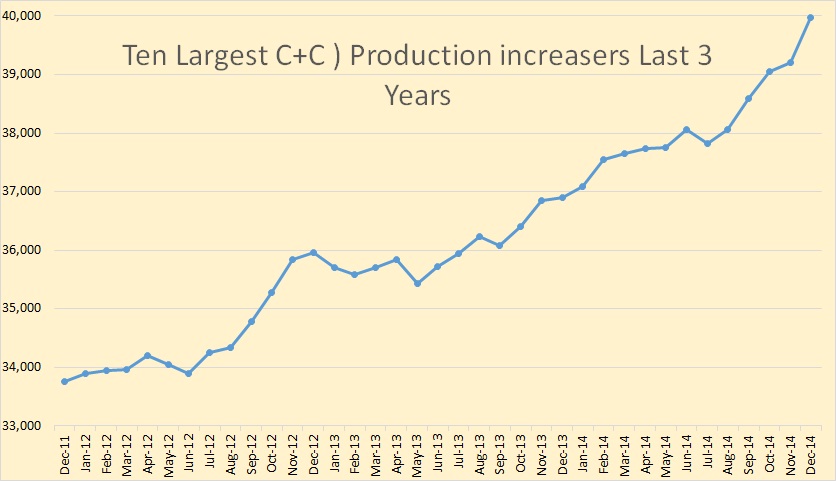
While total C+C production has increased by 3,000,000 BPD over the last three years the top ten gainers have increased just over twice as much, 6,200,000 BPD.

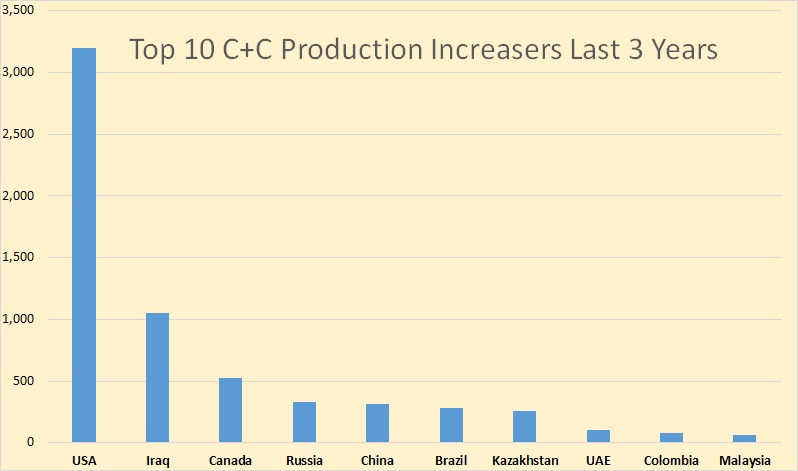
And just who were the big C+C production increasers for the last three years. Keep in mind this is the total change, or increase, over the last three years, not total production.

Post 2

The largest gainer, by a wide margin, was the USA. Iraq and Canada were runners up and the rest were also rans.

Almost everyone else had declines.


…click on the above link to read the rest of the article…

What Does Exxon Know That We Don’t?

What Does Exxon Know That We Don’t?

Forecasts from the IEA and Goldman Sachs this week are trying to say that crude barrels are still overpriced – but the market isn’t listening.  I’ve been convinced that crude prices above $60 are counterproductive as Goldman said in their recent note – but other factors are continuing to help push prices higher.

Let’s take a closer look and see what’s going on – and what might go on in the near future.

Some short-term fundamentals continue to push traders into long positions in oil.  I’ve been among the first to point out the large outflows of capital from just about every other asset class, save for energy stocks and commodities.  This isn’t particularly smart analysis, but clearly money managers and institutional investors are looking for ‘value’ in a very hot market – and oil stocks and commodities look just too low to them.  For these ‘value searchers’, it’s damn the fundamentals – full speed ahead, and oil catches a bid with every, even small bullish indication.

As appears to be the case with Chinese demand, which has incrementally picked up in recent months.  But it’s not like Chinese imports aren’t being met for the most part – they are finding more oil now than ever before in their history.  And imported oil is not being used.  Several reports have Chinese oil stockpiles growing for the last 7 weeks – an obvious way for China to hoard oil that they think is going to get more expensive later.

US stockpiles have come slightly down in the last few EIA reports – a surprise for many who believed that storage would increase throughout the summer.  Many are extrapolating that this drop in stockpiles is a harbinger of slower production from slashed numbers of rig counts, but this may be very premature.

…click on the above link to read the rest of the article…

Saudi Arabia Continues To Turn Screws On U.S. Shale

Saudi Arabia Continues To Turn Screws On U.S. Shale

Saudi Arabia continues to ratchet up production, taking market share away from U.S. shale producers.

According to OPEC’s latest monthly oil report, Saudi Arabia boosted its oil output to 10.31 million barrels per day in April, a slight increase over the previous month’s total of 10.29 million barrels. That was enough for the de facto OPEC leader to claim its highest oil production level in more than three decades.

Saudi Arabia has increased production by 700,000 barrels per day since the fourth quarter of 2014 in an effort maintain market share. The resulting crash in oil prices is forcing some production out of the market, and Saudi Arabia intends for the brunt of that to be borne by others.

Related: California’s Climate Goals: Realistic Or Just Wishful Thinking?

There is a lag between movements in the oil price and corresponding changes in production. OPEC says there was a 23-week time lag between the fall in rig counts and the resulting dip in oil production in the United States. But the effects of the oil price crash are now being felt. New data from the EIA says that U.S. oil production is declining. Having already predicted a 57,000 barrel-per-day decline for May, the agency now says that another 86,000 barrels per day in output will vanish in June.

In other words, as Saudi Arabia ramps up, U.S. shale is being forced to cut back. This story has been told many times over the past few months, but the data is finally confirming the success of Saudi Arabia’s strategy, albeit a minor one thus far.


…click on the above link to read the rest of the article…


Oil Price Recovery May Be Too Much Too Soon

Oil Price Recovery May Be Too Much Too Soon

Oil prices have hit their highest levels in 2015, with WTI surging above $60 per barrel. Crude oil inventories in the U.S. declined for the first time since December 2014, perhaps indicating that the glut could be easing.

The EIA reported that oil stockpiles fell by 3.9 million barrels for the week ending on May 1, a larger drop than expected. With rig counts falling by more than half since last year, this could be the beginning of a longer contraction. Both weekly production figures and the stock build appeared to have peaked, suggesting that supplies are adjusting lower and demand is rising.

USCrudeOilStocks

That has oil prices surging from their March lows, with WTI jumping over $15 per barrel, and Brent about $20 per barrel.

Related: Oil Sector May Not Cause Financial Apocalypse After All

WTIPrices

But have the markets overreacted? The rise in oil prices over the last few weeks has been so rapid that few predicted it. Speculators have raised their bullish betsto the highest level in years. The optimism may not be justified. In the past, bets to such a degree have often been followed by a fallback in prices, the head of commodity strategy at Saxo Bank told Reuters in an interview. Similarly, the top commodities official at Commerzbank told CNBC that the price rise was “premature,” and oil prices could dip back below $50 per barrel once the markets come to their senses.

In other words, the markets may have overshot, rising beyond levels warranted by the underlying fundamentals. Oil inventories are still at 80 year highs. The 487 million barrels of oil sitting in storage will take quite a while to drawdown. Crucially, oil production is still exceeding demand, leaving oil markets well-supplied.


…click on the above link to read the rest of the article…

No Steep Decline In U.S Oil Production Expected Anytime Soon

No Steep Decline In U.S Oil Production Expected Anytime Soon

Increased oil output in the US has kept World oil output from declining over the past few years and a major question is how long this can continue. Poor estimates by both the US Energy Information Administration (EIA) and the Railroad Commission of Texas (RRC) for Texas state wide crude plus condensate (C+C) output make it difficult to predict when a sustained decline in US output will begin.

About 80 to 85% of Texas (TX) C+C output is from the Permian basin and the Eagle Ford play, so estimating output from these two formations is crucial. I have used data from the production data query (PDQ) at the RRC to find the percentage of TX C+C output from the Permian (about 44% in Feb 2015) and Eagle Ford plays (40% in Feb 2015).

Dean’s estimates of Texas C+C output are excellent in my opinion and are close to EIA estimates through August 2014. I used EIA data for TX C+C output through August 2014 and Dean’s best estimate from Sept 2014 to Feb 2015. By multiplying the % of C+C output from the RRC data with the combined EIA and Dean’s estimate, I was able to estimate Eagle Ford and Permian output. The chart below shows this output in kb/d.

PermianEagleFordKBD

The following chart shows the combined Permian and Eagle Ford output from 2012 to 2015 in kb/d, this chart is not zero scaled.

Permian+EF

Below I have created a few scenarios for the Bakken and Eagle Ford. This analysis is based on the pioneering work by Rune Likvern at the Oil Drum (Red Queen series) and his blog at Fractional Flow, any errors in analysis are mine. I doubt that Mr. Likvern would speculate beyond 2 years forward in time (or he has not done so in the past). The data gathered from the North Dakota Industrial Commission (NDIC) by Enno Peters was also instrumental in the Bakken/Three Forks model.


…click on the above link to read the rest of the article…

Big Hit For U.S. Oil Production In January

Big Hit For U.S. Oil Production In January

U.S. crude oil production fell at least 135,000 barrels of oil per day in January 2015 compared to December 2014 according to the EIA (Figure 1).

USCrudeOilProduction

Figure 1. U.S. crude oil production. Source: EIA and Labyrinth Consulting Services, Inc.

(Click image to enlarge)

Related: Latest EIA Predictions Should Be Taken With More Than A Pinch Of Salt

Bakken Shale production fell the most of any play or jurisdiction losing 37,000 barrels per day in North Dakota and 4,000 barrels per day in Montana for a total of 41,000 barrels of oil per day (Figure 2). Production in California, the offshore Gulf of Mexico, Alaska and Wyoming also declined significantly.

>

ProductionChangesByJurisdiction

Figure 2. January 2015 production changes by jurisdiction. Source: EIA and Labyrinth Consulting Services, Inc.

(Click image to enlarge)

Figure 3 shows Bakken production based on DrillingInfo data. The 42,000 barrels of oil per day drop in January production is completely consistent with EIA data differing by only 1,000 barrels per day.


…click on the above link to read the rest of the article…

The EIA Is Bizarrely Optimistic About Future US Oil Production

The EIA Is Bizarrely Optimistic About Future US Oil Production

The EIA came out with its final update of Annual Energy Outlook 2015. It seems that the EIA is extremely optimistic concerning future US crude oil production.

USC+CProduction

Here is a comparison with AEO 2014. The EIA still expects US crude production to peak in 2019 but at 10,472,000 bpd or 824,000 barrels per day higher than the expected last year. But the biggest difference is in the EIA’s change in decline expectations. They now expect the US to be producing 9,329,000 bpd in 2040 or 1,812 higher than they had 2040 production last year. This is the EIA’s reference, or most likely case.

USLTOProduction

Production from tight formations leads the growth in U.S. crude oil production across all AEO2015 cases. The path of projected crude oil production varies significantly across the cases, with total U.S. crude oil production reaching high points of 10.6 million barrels per day (bbl/d) in the Reference case (in 2020), 13.0 million bbl/d in the High Oil Price case (in 2026), 16.6 million bbl/d in the High Oil and Gas Resource case (in 2039), and 10.0 million bbl/d in the Low Oil Price case (in 2020).

Related: Has The Bakken Peaked?

What the EIA is saying in the above paragraph is that price and tight oil production is everything when it comes to US future oil production. On that point I would agree except that even if the price returns to $100 and higher, it will not produce tight oil production to anywhere near the EIA’s high price projections.


…click on the above link to read the rest of the article…

OPEC Says US Oil Boom Will End This Year

OPEC Says US Oil Boom Will End This Year

OPEC says the demand for oil – its oil – will rise during 2015 because the cartel is winning its price war against US shale producers by driving them out of business.

“Higher global refinery runs, driven by increased [summer] seasonal demand, along with the improvement in refinery margins, are likely to increase demand for crude oil over the coming months,” the cartel said in its Monthly Market Report, issued, April 16.

OPEC forecasts demand at an average of 29.27 million barrels per day in the first quarter 2015, a rise of 80,000 bpd from its previous prediction made in its March report. At the same time, it said, the cartel’s own total output will increase by only 680,000 barrels per day, less than the previous expectation of 850,000 barrels per day, due to lower US and other non-OPEC production.

Related: Latest EIA Predictions Should Be Taken With More Than A Pinch Of Salt

The United States appears to have been OPEC’s chief target when, at its November meeting in Vienna, its members, under Saudi leadership, agreed to maintain production at 30 million barrels per day despite falling prices caused by an oversupply of oil.

Average global oil prices began plunging in late June 2014 from more than $110 per barrel to a low of around $50 in January. They’ve now settled to around $60, and Laurence Fink, the CEO of Black Rock, the world’s largest asset manager,said in an interview April 16 on CNBC that the price of a barrel of oil probably would go no lower than $60 this year, but also rise no higher than $80.


…click on the above link to read the rest of the article…

Latest EIA Predictions Should Be Taken With More Than A Pinch Of Salt

Latest EIA Predictions Should Be Taken With More Than A Pinch Of Salt

The U.S. government released its landmark Annual Energy Outlook on April 14, with some rather bold predictions about the future of oil and gas.

The EIA released the 2015 edition of its report at a Washington conferencehosted by the Center for Strategic and International Studies. Here are a few nuggets from the much-anticipated report:

• In its Reference Case, U.S. oil production continues to rise for the rest of the decade, keeping prices from spiking. As a result, the EIA thinks oil prices will stay below $80 per barrel through 2020.
• The U.S. becomes a net exporter of energy in 2019 as higher production combines with lower demand from improved vehicle efficiency
• Shale production peaks and begins to decline after 2020
• OPEC manages to offset falling U.S. production in the next decade with increases in output coming from several Middle Eastern countries
• The EIA is so confident about adequate supplies that it does not foresee oil prices surpassing $100 per barrel again until 2028
• Still, there is a lot of variation among the different scenarios. In its Low Oil Price case, Brent stays at $52 per barrel in 2015, but in its High Oil Price case, it surges to $122 this year
• Electricity from renewable energy increases by 72 percent between 2013 and 2040, with its share of the electricity market rising from 13 to 18 percent

Related: Off-Grid Solar Threatens Utilites In The Next Decade

godverdommeeeee

These projections provide some markers for the road ahead, but the EIA is notoriously off the mark when it comes to accurately forecasting what comes next for energy markets. It routinely extrapolates current trends forwards, assuming very little will change.


…click on the above link to read the rest of the article…

U.S. Oil Glut Story Grossly Exaggerated

U.S. Oil Glut Story Grossly Exaggerated

It’s called the “age of propaganda” where truth matters little and comes out later in so called revisions. Take the recent spate of economic data points from the Kansas City Fed which said that economic activity not only stalled but wasnegative at -4 vs expectations of +1. The recent durable goods statistics also show contraction as well.

Yet we see the services PMI at a 6 month high. How can these divergences be possible? Well for one, some statistics are hard while others are estimated/massaged and others are seasonally adjusted or estimated (only to be revised later). In oil, the same thing appears to be occurring as we speak. The near record pace of oil storage additions in some weeks nearing 8-10 million barrels per day comes at a time when all indicators are that oil production is slowing.

Related: Oil Price Speed Limit Presaging An Age Of Austerity?

Even using the EIA’s own data, production is up some 500,000 per day since October or 3.5M per week. So how can more than two times that be added to storage while gasoline demand accelerates to 5% year over year from low single digits? Refinery maintenance is part of it, yes, as well as seasonality as people drive less in absolute terms, so as production continues this would explain storage adds, but to this magnitude?


…click on the above link to read the rest of the article…

Global Shale Revolution On Hold

Global Shale Revolution On Hold

Along with the rest of the energy world, we have been closely tracking rig counts (now down 40 percent from last fall) and other data to try to determine where the oil markets are heading. This week, the Energy Information Administration reported that production is finally set to decline in several key U.S. shale regions; a long-awaited development. The Eagle Ford, Bakken, and Niobrara shales are expected to see a combined 24,023 barrel-per-day decline in production in April, the first significant dip in output since oil prices collapsed last year. The monthly data may be a bit obscured by the fact that the Permian basin is expected to see production increases of 21,254 barrels per day. Overall, total U.S. production may stay flat. There is still a great deal of uncertainty about the next few months, but with declines beginning in the Eagle Ford and Bakken especially – two critical regions that drove the U.S. shale revolution – there appears to be light at the end of the tunnel for the oil glut.

The Federal Reserve caused a bit of a ripple in the oil markets this week when it appeared to slightly slow plans to raise interest rates later this year. The Fedlowered its estimate for the federal funds rate this year and next, an indication that it will not let its foot off of the gas pedal in terms of loose money. With low inflation and still room for labor markets to heal, the Fed sees no reason to pull back too quickly. Loose monetary conditions push up oil prices, so WTI and Brent rallied a bit this week on the news (after falling significantly). WTI closed out the week around $45 and Brent at $55 per barrel.


…click on the above link to read the rest of the article…

This Week In Energy: Data Pointing To Another Fall In Oil Prices

This Week In Energy: Data Pointing To Another Fall In Oil Prices


Oil slips below $56 on expectations oversupply to linger

Oil slips below $56 on expectations oversupply to linger

(Reuters) – Oil slipped below $56 a barrel on Wednesday, pressured by expectations that oversupply in world markets would persist and an industry report saying U.S. crude stocks rose from a record high.

The American Petroleum Institute said on Tuesday crude stocks increased by 1.6 million barrels last week. Stocks are already at a record, according to the U.S. government’s Energy Information Administration (EIA), which issues its latest report on Wednesday. <EIA/S>

Crude had come under pressure on Tuesday from International Energy Agency (IEA) forecasts of continued supply growth in the United States to 2020 despite lower prices, and of a possible further rise in stocks to a record high this year.

“The supply growth in 2015 is likely to continue unabated, albeit at a somewhat lower rate,” Fereidun Fesharaki at Facts Global Energy said in a note to traders.

“This all means a weak market in 2015 and even lower oil prices. Demand rebound will not save the oil market.”


…click on the above link to read the rest of the article…

Alternate opinions: The world’s energy information duopoly comes to an end

Alternate opinions: The world’s energy information duopoly comes to an end

Recent developments are beginning to undermine the supremacy of the world’s long-running energy information duopoly and its perennially optimistic narrative. Policymakers, investors and the public should take heed.

Until now most energy price and supply forecasts and analyses were based predominately on information from the globe’s two leading energy information agencies: the U.S. Energy Information Administration (EIA), the statistical arm of the U.S. Department of Energy, and the International Energy Agency (IEA), a consortium of 29 countries originally formed in response to the 1973-74 Arab oil embargo to provide better information on world energy supplies to its members.

Both agencies provide forecasts that are publicly available and widely covered in the media. What’s not apparent is how dependent private forecasts issued by the energy industry and financial firms are on the work done by these agencies.

These agencies are able to bring to bear substantial financial resources and large dedicated staffs of statisticians, economists and other specialists focused solely on gathering and analyzing energy data across the world. Few organizations–except perhaps the major international oil companies–are able to muster such resources to monitor world energy. And, the major international oil companies make little of their analysis public. For policymakers and the public, the EIA and IEA have been the go-to sources for presumed-to-be objective energy information.

…click on the above link to read the rest of the article…


Arthur Berman: Why Today’s Shale Era Is The Retirement Party For Oil Production

Arthur Berman: Why Today’s Shale Era Is The Retirement Party For Oil Production

A leading geologist delivers the hard facts

As we’ve written about often here at PeakProsperity.com, much of what’s been ‘sold’ to us about the US shale oil revolution is massively over-hyped. The amount of commercially-recoverable shale oil is much less than touted, returns much less net energy than the petroleum our economy was built around, and is extremely unprofitable to extract for most drillers at today’s lower oil price.

To separate the hype from reality, our podcast guest is Arthur Berman, a geological consultant with 34 years of experience in petroleum exploration and production.

Berman sees the recent US oil production boost from shale drilling as and short-lived and somewhat desperate; a kind of last hurrah before the lights get turned out:

The EIA looks at the US tight oil plays and they see maybe five years before things start to fall off. I think it is less, but I am not going to split hairs. The point is that what we found is expensive and we have got a few years — not decades — of it.

So when we start hearing people pounding the table about how the United States should lift the ban on crude oil exports, well that is another topic if we are just talking about free trade and regulation, but what in the world is a country like ours doing still importing 5+ million barrels of crude oil a day and we have got maybe 2 years of supply from tight oil? What are we thinking about when we claim we’re going to export oil? That is just a dumb idea. It is like borrowing money from a bankrupt person.

…click on the above link to read the rest of the article and listen to the podcast…


Olduvai IV: Courage
Click on image to read excerpts

Olduvai II: Exodus
Click on image to purchase

Click on image to purchase @ FriesenPress