Home » Posts tagged 'gdp' (Page 10)

Tag Archives: gdp

Olduvai
Click on image to purchase

Olduvai III: Catacylsm
Click on image to purchase

Post categories

Post Archives by Category

Falling Interest Rates

Amassing Unproductive Debt

Last week, we discussed the marginal productivity of debt. This is how much each newly-borrowed dollar adds to GDP. And ever since the interest rate began its falling trend in 1981, marginal productivity of debt has tightly correlated with interest. The lower the interest rate, the less productive additional borrowing has in fact become.

Left: the first IKEA store located in Älmhult in Sweden, near the residence of the company’s founder (nowadays the store is a museum); right: a Task Rabbit car. Given the valuations at which TaskRabbit was able to raise funds recently, it is a good bet IKEA paid a small fortune to take it over (waiting for the QE-induced bubble to burst may have been cheaper). [PT]

Let’s look at a recent event: the Ikea acquisition of TaskRabbit. You might wonder, why does a home goods company need to own a freelance labor company? Superficially, it seems to makes sense. Ikea products notoriously come in flat packs, but consumers don’t want to fuss with all the little parts. They just want finished furniture. Ikea has been using TaskRabbit to hire people to assemble it in their homes.

Isn’t this like that caricature of the billionaire who buys, say, the Planters Peanut company because he likes to eat salted nuts? Ikea could be a customer of TaskRabbit, hiring its temporary workers as needed, without owning the company. In fact, it had been doing that for years.

The acquisition price was not disclosed, however, we can guess that it was high. TaskRabbit was a Silicon Valley darling with a bright future. Its value proposition is right for this economy. It had raised $50 million, presumably at rich valuation multiples.

…click on the above link to read the rest of the article…

The Approaching US Energy-Economic Crisis

The Approaching US Energy-Economic Crisis

I was recently asked to give a talk called, “The Approaching US Energy-Economic Crisis.” In other words, how might the United States encounter problems that lead to a crisis? As we will see, many of the problems that could lead to a crisis (such as increased wage disparity and difficulty in collecting enough taxes) are issues that we are already beginning to encounter.

In this talk, I first discuss the connection between energy and the economy. Without this connection, it doesn’t make sense to talk about a crisis arising with respect to energy and the economy. I then discuss seven issues that could lead to a US energy-economic crisis.

Economic Growth Is Closely Tied to Energy Consumption

If we look at world data, it is clear that there is a close tie between energy consumption and economic growth.

Slide 2

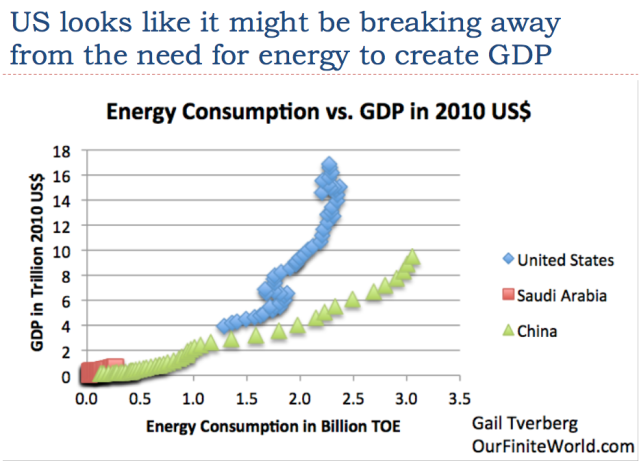
On an individual country basis, there can be the belief that we have reached a new situation where a particular country doesn’t really need growing energy supply for economic growth.

Slide 3

For example, on Slide 3, the recent nearly vertical line for the US suggests that the US economy can grow with almost no increase in annual energy consumption. This rather strange situation arises because the standard calculation misses energy embodied in imported goods. Thus, if the United States wants to outsource a great deal of its manufacturing to China, the energy consumption used in making these goods will appear in China’s data, not in the United States’ data. This makes the country that has outsourced manufacturing look very good, both with respect to energy consumption and CO2 emissions.

…click on the above link to read the rest of the article…

GDP Is Bogus: Here’s Why

GDP Is Bogus: Here’s Why

Here’s a chart of our fabulous always-higher GDP, adjusted for another bogus metric, official inflation.
The theme this week is The Rot Within.

The rot eating away at our society and economy is typically papered over with bogus statistics that “prove” everything’s getting better every day in every way. The prime “proof” of rising prosperity is the Gross Domestic Product (GDP), which never fails to loft higher, with the rare excepts being Spots of Bother (recessions) that never last more than a quarter or two.

Longtime correspondent Dave P. of Market Daily Briefing recently summarized the key flaw in GDP: GDP doesn’t reflect changes in the balance sheet, i.e. debt.

So if we borrow money to pay people to dig holes and then fill them with the excavated dirt, GDP rises to general applause. The debt we took on to fund the make-work isn’t accounted for at all.

Here’s Dave’s explanation:

Once I learned about accounting, I figured out why the GDP metric wasn’t sufficient. What is missing?

The balance sheet.

Hurricanes are a direct hit to your nation’s balance sheet. The national income statement goes up because of increased spending to replace lost assets, but the “equity” part of the national balance sheet ends up taking a hit in direct proportion to the damage that occurred. Even if you rebuild everything just the way it was, your assets remain the same, while your liabilities have increased.

We know this because we use the balance sheet equation: equity = assets – liabilities. Equity is another word for wealth.

Before hurricane:

wealth = (house + car) – (home debt + car debt)

After hurricane, you rebuild your house, and buy a new car, using borrowed money:

wealth = (house + car) – (2 x home debt + 2 x car debt)

Wealth (equity) has declined by the sum (home debt + car debt)

…click on the above link to read the rest of the article…

The Falling Productivity of Debt

Discounting the Present Value of Future Income

Last week, we discussed the ongoing fall of dividend, and especially earnings, yields. This Report is not a stock letter, and we make no stock market predictions. We talk about this phenomenon to make a different point. The discount rate has fallen to a very low level indeed.

We add this chart to provide a slightly different perspective to the discussion that follows below (and the question raised at the end of the article). This is a very simple ratio chart, which focuses on non-financial corporate debt in particular, as neither consumer debt nor government debt can be considered “productive” by their very nature – the latter types of debt are used for consumption, which they “pull forward” (as an aside, we don’t believe there is anything wrong with consumer debt per se, but it is not “productive”). As the recommendations of Keynesians on combating economic downturns indicate, they have a slight problem with the sequencing of production and consumption. They favor measures aimed at boosting demand, i.e., they want to encourage consumption, which is tantamount to putting the cart before the horse. The chart above shows the ratio of GDP to total non-financial corporate debt – and obviously, GDP is not really an ideal measure for this purpose, as Keith also mentions below (GDP has many flaws, and its greatest flaw is the underlying idea that “spending” is what drives economic growth; not to mention that it seems not to matter what the spending actually entails – even Keynesian ditch digging or pyramid building would “add to GDP”, but would it represent economic growth? That seems a rather audacious assumption – in fact, it should be obvious that such activities would diminish rather than enhance society-wide prosperity).

…click on the above link to read the rest of the article…
 

BIS Finds Global Debt May Be Underreported By $14 Trillion

BIS Finds Global Debt May Be Underreported By $14 Trillion

In its latest annual summary published at the end of June, the IIF found that total nominal global debt had risen to a new all time high of $217 trillion, or 327% of global GDP…

… largely as a result of an unprecedented increase in emerging market leverage.


While the continued growth in debt in zero interest rate world is hardly surprising, what was notable is that debt within the developed world appeared to have peaked, if not declined modestly in the latest 5 year period. However, it now appears that contrary to previous speculation of potential deleveraging among EM nations, not only was this conclusion incorrect, but that developed nations had been stealthily piling on just as much debt, only largely hidden from the public eye, in the form of swaps and forwards.

* * *

The BIS then provides substantial background data on who, where and how uses FX swaps (as both a lender and borrower), as well as where this “missing debt” can be found when looking away from the balance sheet. Here are the details:

…click on the above link to read the rest of the article…

The Cardinal Sin Of Investing: Permanent Impairment Of Capital

Victor Moussa/Shutterstock

The Cardinal Sin Of Investing: Permanent Impairment Of Capital

How to avoid making it
Last week we presented a parade of indicators published by Grant Williams and Lance Roberts that warned of an approaching market correction as well as a coming economic recession.

The key message was: When smart analysts independently find the same patterns in the data, it’s time to take notice.

Well, many of you did, by participating in this week’s Dangerous Markets webinar, which featured Grant and Lance.

In it, both went much deeper into the structural fragility of today’s financial markets and the many reasons why economic growth will remain constrained for years to come.

The excessive build-up of debt in the system — and the absolute dependence on its continued expansion to keep the economy from imploding — is, of course, seen as the prime risk to future growth.

As Lance demonstrates here with several of his excellent charts, so much leverage has been taken on that its servicing is increasingly stealing capital that would otherwise go to savings, consumption and productive investment. Going forward, the demands of the debt service will simply result in less and less capital available left over to grow the economy:

As financial assets are (supposed to be) valued on future growth prospects, lower forecasted growth demands lower valuations. Grant calculates that, should the US see another decade of 2% average annual GDP growth (and it has averaged less than that over the past decade), stock prices should be roughly half of what they are today to be considered fairly valued:

And Lance builds further on this, explaining how this moribund growth, coupled with America’s aging demographic trend, will simply savage the nation’s (already troublesomely underfunded) pension and entitlement systems:

…click on the above link to read the rest of the article…

Bank of America Stumbles On A $51 Trillion Problem

At the end of June, the Institute of International Finance delivered a troubling verdict: in a period of so-called “coordinated growth”, total global debt (including financial) hit a new all time high of $217 trillion in 2017, over 327% of global GDP, and up $50 trillion over the past decade. Commenting then, we said “so much for Ray Dalio’s beautiful deleveraging, oh and for those economists who are still confused why r-star remains near 0%, the chart  below has all the answers.”

Today, in a follow up analysis of this surge in global debt offset by stagnant economic growth, BofA’s Barnaby Martin writes that he finds “that as global debt has been mounting to more than $150 trillion (government, household and non-financials corporate debt), global GDP is just above $60 trillion.” His observation is shown in the self-explanatory chart below.

As a result, both the global economy and central banks are now held hostage by both the unprecedented stock of debt injected into capital markets over recent years to offset the financial crisis depression, and the record low interest rates associated with it.

As Martin writes, “the global fixed income market (as captured by the GFIM index) is now above the $51trillion mark“, which means that “more than $51 trillion at risk if rates vol spikes and yields move higher” and adds that “amid a record amount of assets acquired by the central banks we have seen the global fixed income market growing to the largest size it has ever been.” This is shown in the left panel on the chart below, while the right side chart shows the accompanying housing bubble: “amid record low funding costs the housing market is also experiencing rapid price gains in some regions as prices are now higher than pre-GFC levels. All main housing markets (US, Europe, Japan and UK) are above the 2007 highs, propped-up by record low yield levels.”

…click on the above link to read the rest of the article…

Bank of Canada Raises Interest Rates… Again

Bank of Canada Raises Interest Rates… Again

stephen-poloz1-300x225For the second time in less than two months, the Bank of Canada has raised interest rates.

On Wednesday, the central bank raised its overnight lending rate by a quarter per cent to 1 per cent.

The move surprised many who weren’t expecting a rate increase until later this Autumn.

Just like last time, the rationale behind higher rates was centred around the Bank of Canada’s belief that the economy is growing faster than expected.

Bank of Canada Governor Stephen Poloz said, “The level of GDP growth is now higher than the bank expected.”

Of course, this assumes that GDP measures anything.

The Canadian loonie surged after the announcement, climbing to 82 cents U.S.

The decision reinforces the message that easy money and low-interest rates are coming to an end. Of course, the bursting of Canada’s real estate bubble could reverse direction for the bank, using these recent rate gains as leverage to cut rates in order to “stimulate” the deflating economy.

But until then, analysts are expecting more rate hikes since many have confused consumer indebtedness and rising prices as economic strength.

The Bank of Canada won’t confirm these predictions since, according to the central bank’s statement, price controls on interest rates are, “predetermined and will be guided by incoming economic data and financial market developments.”

Of course, the Bank of Canada isn’t clueless when it comes to higher rates and indebted Canadian households. In the rate hike statement, the bank promised that “close attention will be paid to the sensitivity of the economy to higher interest rates,” given “elevated household indebtedness.”

The bank’s next scheduled rate-setting is Oct. 25.

All in all, today’s announcement puts interest rates back to where they were in January 2015, before Poloz made two surprising “emergency rate cuts” to deal with falling oil prices.

Does Government Spending Create More Economic Growth?

Does Government Spending Create More Economic Growth?

spending.PNG

After the 2007-2009 global financial crisis, fears of ballooning public debt and worries about the drag on economic growth pushed authorities in some countries to lower government spending, a tactic that economists now think may have slowed recovery. Note that in the United States the total debt to GDP ratio stood at 349 in Q1 this year.

In a paper presented at the Kansas City Federal Reserve’s annual economic symposium on August 26 2017, Alan Auerbach and Yuriy Gorodnichenko from the University of California suggested that “expansionary fiscal policies adopted when the economy is weak may not only stimulate output but also reduce debt-to-GDP ratios”. (Fiscal Stimulus and Fiscal Sustainability, August 1,2017, UC – Berkley and NBER).

shos1_5.PNG

Some commentators are of the view that these findings may be welcome news to central bankers who face limited options of their own to combat a future downturn, given existing low interest rates and low inflation rates in their economies. “With tight constraints on central banks, one may expect — or maybe hope for — a more active response of fiscal policy when the next recession arrives,” the University of California researchers wrote.

These findings are in agreement with Nobel Laureate in economics Paul Krugman, and other commentators that are of the view that an increase in government outlays whilst the economy is relatively subdued is good news for economic growth.

Can increase in government outlays strengthen economic growth?

Observe that government is not a wealth generating entity as such — the more it spends, the more resources it has to take from wealth generators. This in turn undermines the wealth generating process of the economy.

The proponents for strong government outlays when an economy displays weakness hold that the stronger outlays by the government will strengthen the spending flow and this in turn will strengthen the economy.

…click on the above link to read the rest of the article…

The Normalization Delusion

The Normalization Delusion

LONDON – There is a psychological bias to believe that exceptional events eventually give way to a return to “normal times.” Many economic commentators now focus on prospects for “exit” from nearly a decade of ultra-loose monetary policy, with central banks reducing their balance sheets to “normal” levels and gradually raising interest rates. But we are far from a return to pre-crisis normality.

After years of falling global growth forecasts, 2017 has witnessed a significant uptick, and there is a good case for slight interest-rate increases. But the advanced economies still face too-low inflation and only moderate growth, and recovery will continue to rely on fiscal stimulus, underpinned if necessary by debt monetization.

Since 2007, per capita GDP in the eurozone, Japan, and the United States are up just 0.3%, 4.4%, and 5%, respectively. Part of the slowdown from pre-crisis norms of 1.5-2% annual growth may reflect supply-side factors; productivity growth may face structural headwinds.

But part of the problem is deficient nominal demand. Despite central banks’ massive stimulus efforts, nominal GDP from 2007-16 grew 2.8% per year in the US, 1.5% in the eurozone, and just 0.2% in Japan, making it impossible to achieve moderate growth plus annual inflation in line with 2% targets. US inflation has now undershot the Federal Reserve’s target for five years, and has trended down over the last five months.

Faced with this abnormality, some economists search for one-off factors, such as “free” minutes for US cell phones, that are temporarily depressing US inflation measures. But mobile-phone pricing in the US cannot explain why Japan’s core inflation is stuck around zero. Common long-term factors must explain this global phenomenon.

…click on the above link to read the rest of the article…

Why We’re Doomed: Stagnant Wages

Why We’re Doomed: Stagnant Wages

The point is the present system cannot endure.
Despite all the happy talk about “recovery” and higher growth, wages have gone nowhere since 2000–and for the bottom 20% of workers, they’ve gone nowhere since the 1970s.
Gross domestic product (GDP) has risen smartly since 2000, but the share of GDP going to wages and salaries has plummeted: this is simply an extension of a 47-year downtrend.
Last month I posted one reason Why We’re Doomed: Our Economy’s Toxic Inequality (August 16, 2017). The second half of why we’re doomed is stagnant wages. Why do stagnating wages for the bottom 95% doom our status quo? As I noted yesterday in Why Wages Have Lost Ground in the 21st Centuryour system requires ever-higher household incomes to function–not just in the top 5%, but in the top 80%.
Our federal social programs–Social Security, Medicare and Medicaid–are pay-as-you-go: all the expenditures this year are paid by taxes collected this year. As I have detailed many times, the so-called “Trust Funds” are fictions; when Social Security runs a deficit, the difference between receipts and expenses are filled by selling Treasury bonds in the open market–the exact same mechanism ther government uses to fund any other deficit.
The demographics of the nation have changed in the past two generations. The Baby Boom is retiring en masse, expanding the number of beneficiaries of these programs, while the number of full-time workers to retirees is down from 10-to-1 in the good old days to 2-to-1: there are 60 million beneficiaries of Social Security and Medicare and about 120 million full-time workers in the U.S.
Meanwhile, medical expenses per person are soaring. Profiteering by healthcare cartels, new and ever-more costly treatments, the rise of chronic lifestyle illnesses–there are many drivers of this trend. There is absolutely no evidence to support the fantasy that this trend will magically reverse.

…click on the above link to read the rest of the article…

Opinion: No, hurricanes are not good for the economy

Yes, GDP may get a temporary boost from rebuilding, but there’s nothing positive about destruction

REUTERS/Adrees Latif
Think of the increased production of motor vehicles to replace all those flooded trucks!

Once the immediate danger of a natural disaster subsides, and the loss of life, property damage, cost of rebuilding, and degree of insurance coverage can be assessed, attention generally turns to the economic effect. How will Hurricane Harvey affect the nation’s gross domestic product?

You will no doubt hear assertions that the rebuilding effort will provide a boost to contractors, manufacturers and GDP in general. But before these claims turn into predictable nonsense about all the good that comes from natural disasters, I thought it might be useful to provide some context for these sorts of events.

Over the years, I’ve observed a tendency among economists and traders to view such events through a demand-side prism. They see lost income translating into reduced spending on goods and services, which might even warrant some largesse from the central bank.

Of course, that is precisely the wrong medicine. Supply shocks reduce output and raise prices. The Federal Reserve’s interest-rate medicine affects demand. Lower interest rates will increase the demand for gasoline, among other goods and services, but they have no effect on supply. An easing of monetary policy under such circumstances would increase demand for already curtailed supply, raising prices even more.

…click on the above link to read the rest of the article…

Why Doesn’t This Household Debt Worry Anyone?!

Why Doesn’t This Household Debt Worry Anyone?!

With all the attention going to political tensions between the USA and North Korea and the interest rate policies and monetary policies established by the various central banks around the world, we would almost forget to keep track of how the ‘real’ economy is doing. And then we aren’t talking about GDP results or theoretical consumer confidence levels, but about how the average households in the United States are doing with a special attention to the debt levels.

Because consuming goods is one thing. Being able to afford them is another thing and if your consumption pattern and consumption economy is based on quicksand, then one simple economic shock might cause the entire consumption-based economy to collapse.

The Federal Reserve Bank of New York has provided an updated net household debt situation, and the chart looks pretty alarming. After the Global Financial Crisis has hit the USA, the total debt decreased from 12.7 trillion dollar to 11.3 trillion dollar by 2013. Whilst this seems like a marginal move fueled by lower mortgage debt, it’s actually pretty impressive considering the 125 million households in the USA reduced their net debt by $11,200 per household.

Source: NY  Fed

However, since 2013, the fears for another financial crisis have decreased as the US banks seemed to be fine as most were passing the stress test of the Federal Reserve with flying colors. Meanwhile, the focus of the crisis and monetary world shifted towards Europe where Greece, Italy and Spain were trying to get their public finances in order.

…click on the above link to read the rest of the article…

Don’t Forget About The Red Swan

Don’t Forget About The Red Swan

[Urgent Note: The nation’s future and a massive debt ceiling hangs in the balance as Trump pushes beyond the Comey hearings. That’s why I’m on a mission to send my new book TRUMPED! A Nation on the Brink of Ruin… and How to Bring It Back to every American who responds, absolutely free. Click here for more details.]

Given the anti-Trump feeding frenzy, we continue to believe that a Swan is on its way bearing Orange. But if that’s not enough to dissuade the dip buyers, perhaps the impending arrival of the Red Swan will at least give them pause.

The chart below comprises a picture worth thousands of words. It puts the lie to the latest Wall Street belief that the global economy is accelerating and that surging corporate profits justify the market’s latest manic rip.

What is actually going on is a short-lived global credit/growth impulse emanating from China. Beijing panicked early last year and opened up the capital expenditure (CapEx) spigots at the state-owned enterprises (SOEs) out of fear that China’s great machine was heading for stall speed at exactly the wrong time.

The 19th national communist party Congress scheduled for late fall of 2017. This every five year event is the single most important happening in the Red Ponzi. This time the event is slated to be the coronation of Xi Jinping as the second coming of Mao.

Beijing was not about to risk an economy fizzling toward a flat line before the Congress. Yet that threat was clearly on the horizon as evident from the dark green line in the chart below which represents total fixed asset investment.

The latter is the spring-wheel of China’s booming economy, but it had dropped from 22% per annum growth rate when Mr. Xi took the helm in 2012 to 10% by early 2016.

…click on the above link to read the rest of the article…

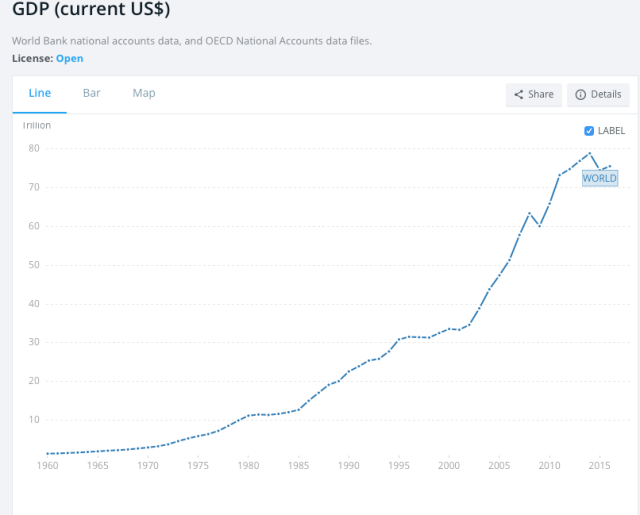
World GDP in current US dollars seems to have peaked; this is a problem

World GDP in current US dollars seems to have peaked; this is a problem

World GDP in current US dollars is in some sense the simplest world GDP calculation that a person might make. It is calculated by taking the GDP for each year for each country in the local currency (for example, yen) and converting these GDP amounts to US dollars using the then-current relativity between the local currency and the US dollar.

To get a world total, all a person needs to do is add together the GDP amounts for all of the individual countries. There is no inflation adjustment, so comparing GDP growth amounts calculated on this basis gives an indication regarding how the world economy is growing, inclusive of inflation. Calculation of GDP on this basis is also inclusive of changes in relativities to the US dollar.

What has been concerning for the last couple of years is that World GDP on this basis is no longer growing robustly. In fact, it may even have started shrinking, with 2014 being the peak year. Figure 1 shows world GDP on a current US dollar basis, in a chart produced by the World Bank.

Figure 1. World GDP in “Current US Dollars,” in chart from World Bank website.

Since the concept of GDP in current US dollars is not a topic that most of us are very familiar with, this post, in part, is an exploration of how GDP and inflation calculations on this basis fit in with other concepts we are more familiar with.

As I look at the data, it becomes clear that the reason for the downturn in Current US$ GDP is very much related to topics that I have been writing about. In particular, it is related to the fall in oil prices since mid-2014 and to the problems that oil producers have been having since that time, earning too little profit on the oil they sell.

…click on the above link to read the rest of the article…

Olduvai IV: Courage
Click on image to read excerpts

Olduvai II: Exodus
Click on image to purchase

Click on image to purchase @ FriesenPress