This Chart Shows the True Collapse of Fracking in the US
“People need to kinda settle in for a while.” That’s what Exxon Mobil CEO Rex Tillersonsaid about the low price of oil at the company’s investor conference. “I see a lot of supply out there.”
So Exxon is going to do its darnedest to add to this supply: 16 new production projects will start pumping oil and gas through 2017. Production will rise from 4 million barrels per day to 4.3 million. But it will spend less money to get there, largely because suppliers have had to cut their prices.
That’s the global oil story. In the US, a similar scenario is playing out. Drillers are laying some people off, not massive numbers yet. Like Exxon, they’re shoving big price cuts down the throats of their suppliers. They’re cutting back on drilling by idling the least efficient rigs in the least productive plays – and they’re not kidding about that.
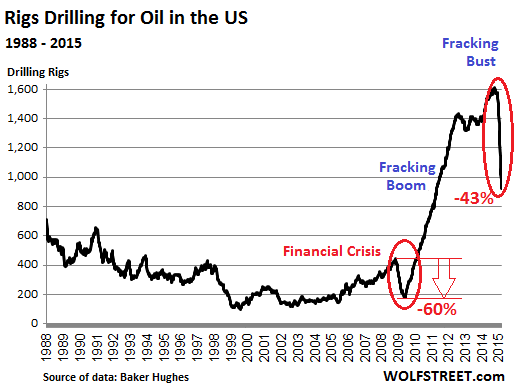
In the latest week, they idled a 64 rigs drilling for oil, according to Baker Hughes, which publishes the data every Friday. Only 922 rigs were still active, down 42.7% from October, when they’d peaked. Within 21 weeks, they’ve taken out 687 rigs, the most terrific, vertigo-inducing oil-rig nose dive in the data series, and possibly in history:
As Exxon and other drillers are overeager to explain: just because we’re cutting capex, and just because the rig count plunges, doesn’t mean our production is going down. And it may not for a long time. Drillers, loaded up with debt, must have the cash flow from production to survive.
…click on the above link to read the rest of the article…