Jasper Johns Map 1961

Chill, if there wasn’t any, we will know soon enough. Maybe not soon enough for you, but hey, get in line. There have been enough suspicious things going on to at least take a closer look at some of them. Moreover, it appears as if some of these things will even be -relatively- easy to prove, because of the particular settings they occurred in.
This is an introduction to something regular Automatic Earth contributor Dr. D pointed out yesterday, but let me start with, first, 30-year NSA veteran Bill Binney referring to simple arithmetic, …
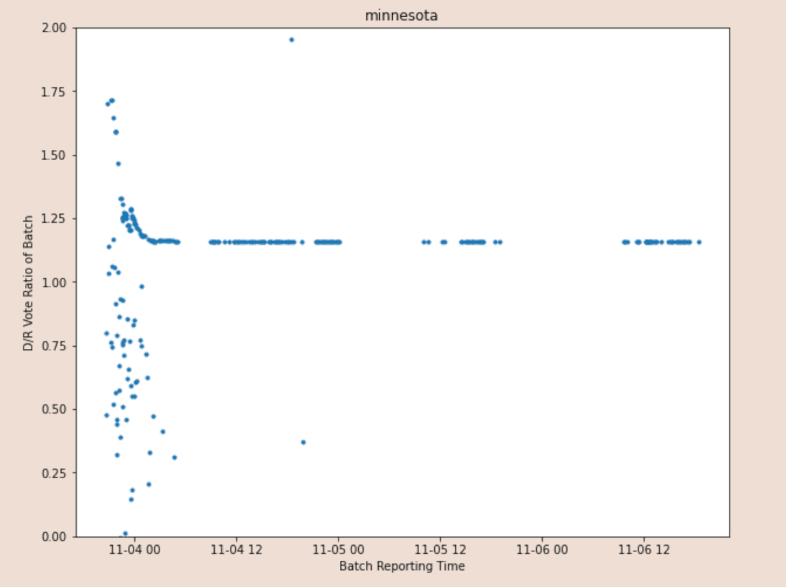
… and then to Twitter user CulturalHusbandry, who delves into more refined math in a Twitter thread:
The initial reporting represents in-person voting. These vote reports have such large variation bc in-person voting happens across different geographic areas that have different political alignments. We can see this same pattern of noisy in-person voting, followed by homogeneous mail-in reporting in almost all cases. What we see in almost all examples across the country is that the ratio of mail-in Dem to Rep ballots is very consistent across time, but with the notable drift from Dem to slightly more Rep. This slight drift from D to R mail-ins occurs again and again, and is likely due to outlying rural areas having more R votes. These outlying areas take longer to ship.
