U.S. Stock Market Hits a New Record High, but What’s Really Going On?

As Americans head off to Independence Day celebrations, they’ll be greeted with a plethora of headlines about record highs in the U.S. stock market. What I find most interesting about the latest bout of exuberance is the fact that priced in gold, stocks remain far below last fall’s peak.
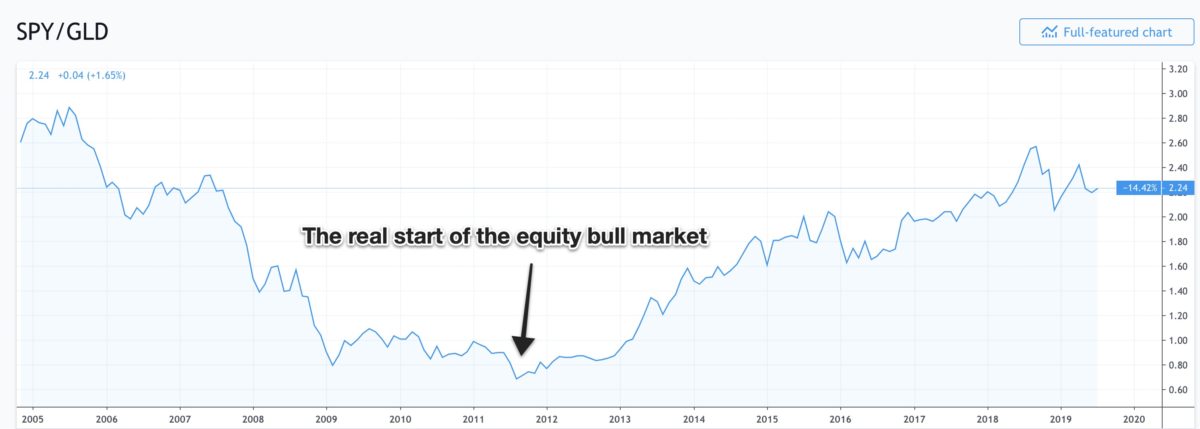
From my perspective, a real equity bull market is one where the stock market, in this case the S&P500, consistently hits new highs relative to what’s historically been the world’s politically-neutral monetary asset, gold; and the U.S. stock market did exactly that from August 2011 until September 2018. Though equities in nominal terms bottomed in March 2009, we didn’t really get the all clear in my view until equities started rallying versus gold in late summer 2011.

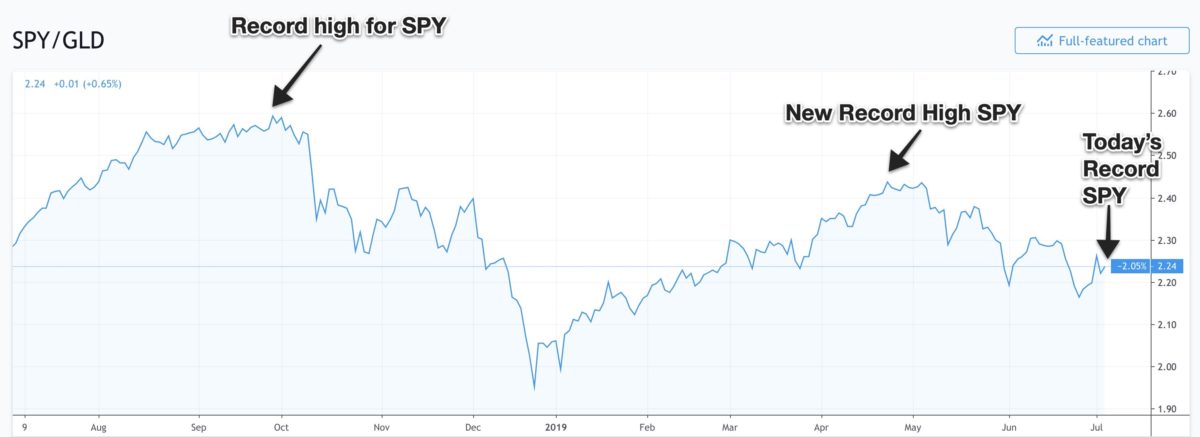
U.S. stocks continued to hit new highs via this ratio until the most recent high in September 2018. This represented a seven year equity bull market of historic proportions, but since last fall the ratio has consistently lagged nominal highs in stocks as you can see in the chart below.

What I find so interesting about the above chart is that both of 2019’s new record highs in the U.S. equity market came at considerably lower levels in the SPY/GLD ratio compared to last fall’s high. In fact, today’s SPY/GLD ratio is not just 14% below where the ratio was during last September’s stock market high, it’s also 3% below the prior equity market high in May.
So what does all of this mean? It’s too early to tell for sure, but what the chart tells me is there’s a high probability the economic cycle ended and started to turn down last September, and 2019’s nominal highs in equities (May and July) are sending false signals about what’s really going on. Combine this with the fact that gold recently broke out of a multi-year downtrend and the argument becomes stronger.
…click on the above link to read the rest of the article…