Home » Posts tagged 'eia' (Page 9)

Tag Archives: eia

Olduvai
Click on image to purchase

Olduvai III: Catacylsm
Click on image to purchase

Post categories

Post Archives by Category

Oil Companies Running Out Of Options

Oil Companies Running Out Of Options

The financial pressure on indebted oil and gas companies continues to mount, putting them in a bind as they try to mend their deteriorating balance sheets.

As their debt rises, drillers have had to divert more of their operating cash flow to servicing that debt. Or, put another way, as cash flow declines, a greater share of those resources are swallowed up by debt payments.

According to an analysis by the EIA, a group of 44 onshore oil and gas operators, responsible for 2.7 million barrels of oil production, are increasingly struggling to deal with falling oil prices. Between July 2014 and June 2015, an estimated 83 percent of the operating cash flow from these companies is dedicated for debt payments.

As the oil bust got underway late last year and in early 2015, oil companies had options. They could cut spending, take on new debt, issue new shares, or sell assets, to name a few.

Related: Does OPEC Have An Ace Up Its Sleeve?

In the first half of this year, the U.S. shale industry raised an estimated $44 billion in fresh debt and equity. Companies could roll over or refinance debt, taking on new loans in order to retire old ones. In a low-interest rate environment, lenders were very willing to do this. More importantly, in the first and second quarter of 2015, many lenders expected oil prices to rebound.

That optimism about oil prices has all but vanished at this point. As a result, it is becoming increasingly difficult for indebted companies to secure fresh loans – interest rates for high-risk companies are becoming prohibitively expensive. According to the EIA, the bond yields for energy companies with a credit rating in junk territory have shot above 11 percent, as the bond markets start to steer clear of high-yield energy debt. Debt and equity markets are all but shut off for distressed companies.


…click on the above link to read the rest of the article…

The Shale Delusion: Why The Party’s Over For U.S. Tight Oil

The party is over for tight oil.

Despite brash statements by U.S. producers and misleading analysis by Raymond James, low oil prices are killing tight oil companies.

Reports this week from IEA and EIA paint a bleak picture for oil prices as the world production surplus continues.

EIA said that U.S. production will fall by 1 million barrels per day over the next year and that, “expected crude oil production declines from May 2015 through mid-2016 are largely attributable to unattractive economic returns.”

IEA made the point more strongly.

“..the latest price rout could stop US growth in its tracks.

In other words, outside of the very best areas of the Eagle Ford, Bakken and Permian, the tight oil party is over because companies will lose money at forecasted oil prices for the next year.

Global Supply and Demand Fundamentals Continue to Worsen

IEA data shows that the current second-quarter 2015 production surplus of 2.6 million barrels per day is the greatest since the oil-price collapse began in 2014 (Figure 1).

Figure 1. World liquids production surplus or deficit by quarter. Source: IEA and Labyrinth Consulting Services, Inc.

(click image to enlarge)

EIA monthly data for August also indicates a 2.6 million barrel per day production surplus, an increase of 270,000 barrels per day compared to July (Figure 2).

Figure 2. World liquids production, consumption and relative surplus or deficit by month.

Source: EIA and Labyrinth Consulting Services, Inc.

(click image to enlarge)

It further suggests that the August production surplus is because of both a production (supply) increase of 85,000 barrels per day and a consumption (demand) decrease of 182,000 barrels per day compared to July.


…click on the above link to read the rest of the article…

Decline In U.S. Oil Production Accelerates

Decline In U.S. Oil Production Accelerates

New EIA data once again points to a deeper contraction than previously expected.

The revelation was initially revealed in late August, when the EIA reported that the United States produced much less oil than expected in the first half of 2015. On the whole, the country produced 40,000 to 100,000 fewer barrels than previously reported between January and May. The August report also showed that U.S. oil production peaked in April at 9.6 million barrels per day (mb/d), before falling to just 9.3 mb/d in June.

The declines suggested that the contraction in the U.S. shale industry was deeper than the world had initially thought. And one can only assume that the decline either kept up at a similar rate, or even accelerated in the intervening months since June.

The latest data from EIA confirms this trend. In its Short-Term Energy Outlookreleased on September 9, the EIA estimates that the U.S. oil industry lost another 140,000 barrels per day between July and August. That is a faster rate than the 100,000 barrels lost in June. Moreover, the agency predicts that output will continue to decline for another year until August 2016, before picking up again.

The U.S. is expected to produce 9.2 mb/d on average in 2015, which will drop to just 8.8 mb/c in 2016. Both of those figures are 0.1 mb/d lower than last month’s projection.

Related: 2020 Could Mark The Tipping Point For U.S. Solar

(Click to enlarge)

Related: The Oil Bust Is Great For Business Here

This contraction is one of the biggest determining factors to oil prices finding their footing. At its expected low point one year from now in August 2016, U.S. oil production will bottom out around 8.6 mb/d, about 1 mb/d below the peakreached this past April. That could go a long way to cutting into excess global oil supplies.


…click on the above link to read the rest of the article…

Oil Production Boom Is Not What It Seems As Future Investments Are Uncertain

Oil Production Boom Is Not What It Seems As Future Investments Are Uncertain

Amid a holiday-dappled week, we barrel in to Wednesday without the presence of the weekly oil inventory report; we will have to wait until tomorrow at 11am (EDT) for that. We do, however, get the API report after market close, although the EIA’s Short Term Energy Outlook is out in the meantime to provide us with something to get our teeth into.

Economic data again remains scant, with the only morsel of note already released from the UK in the form of a big miss for industrial production (-0.4% MoM vs. +0.1% expected). Despite a rampant rise in global equity markets overnight, the crude complex is staggering lower in the face of gale-force headwinds from a stronger US dollar.

Once again, we are playing pass the parcel of positive sentiment from continent to continent, with US equities rallying strongly yesterday on hopes of further stimulus out of China. China rallied in kind in response to this, while Japanese equities trumped them all. The Nikkei 225 index jumped 7.7% overnight – the biggest jump since October 2008 – as it played catch-up with other global benchmarks:

Nikkei 225 Equity Index

In terms of oil-related info, perhaps the scariest data point for the day comes out of the UK (not the industrial production number, we already mentioned that), for according to a UK industry lobby group, North Sea oil and gas investments could drop as much as 80% by 2017 amid the lower oil price environment.

In less scary news, the below graphic from the EIA today shows Saudi Arabian oil exports for the first half of the year. It says Saudi Arabia sent 4.4 million barrels per day to seven major trading partners in Asia, which accounted for more than half of Saudi’s total crude oil exports. In percentage terms versus last year, it says Saudi is maintaining its market share:

…click on the above link to read the rest of the article…

The EIA Changes Data Collection Methods

The EIA Changes Data Collection Methods

With the release of today’s  Petroleum Supply Monthly, EIA is incorporating the first survey-based reporting of monthly U.S. crude oil production statistics. Today’s Petroleum Supply Monthly includes estimates for June 2015 crude oil production using new survey data for 13 states and the federal Gulf of Mexico, and revises figures previously reported for January through May 2015.

From the EIA’s Monthly Crude Oil and Natural Gas Production webpage.

Beginning with the June 2015 data, EIA is providing estimates for crude oil production (including lease condensate) based on data from the EIA-914 survey. Survey-based monthly production estimates starting with January 2015 are provided for Arkansas, California, Colorado, Kansas, Louisiana, Montana, New Mexico, North Dakota, Ohio, Pennsylvania, Texas, Utah, Wyoming, and the Federal Gulf of Mexico. For two states covered by the EIA-914—Oklahoma and West Virginia—and all remaining oil-producing states and areas not individually covered by the EIA-914, production estimates are based on the previous methodology (using lagged state data). When EIA completes its validation of Oklahoma and West Virginia data, estimates for these states will also be based on EIA-914 data. For all states and areas, production data prior to 2015 are estimates published in the Petroleum Supply Monthly. Later in 2015, EIA will report monthly crude oil production by API gravity category for the individually-surveyed EIA-914 states.

This is great news for those of us who have been complaining for years about the EIA’s poor and misleading data collection methods.Petroleum Supply Monthly

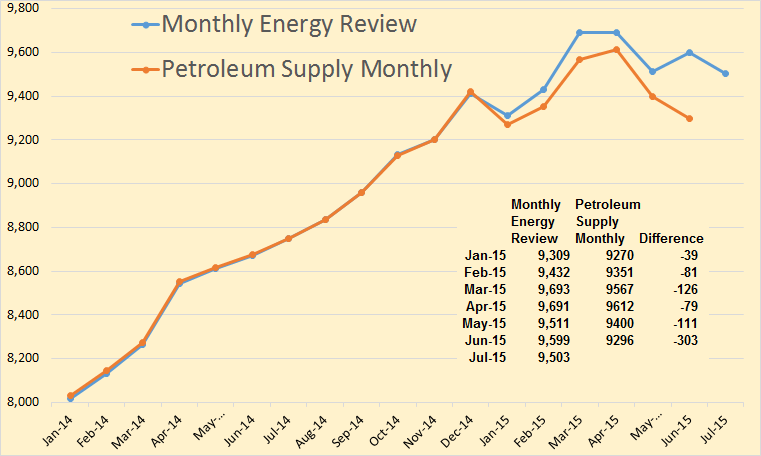
June C+C production, according to the Monthly Energy Review, was almost 9.6 million barrels per day. But the Petroleum Supply Monthly cuts that by 303,000 bpd. And they have production dropping by 316,000 barrels per day in the last two months, May and June.


…click on the above link to read the rest of the article…

This Is Why The Saudis Are Unlikely To Accept Any Production Cutback

This Is Why The Saudis Are Unlikely To Accept Any Production Cutback

‘Clack! cla-cla clack-clack clack-clack CLACK!!’ (today’s fanfare for Nonfarm Friday was played on football helmets to celebrate the start of college football season). It is the first Friday in September, which means we see official US employment data, aka nonfarm payrolls. Today’s report has showed 173,000 jobs were created in August, which was less than the expected 220,000, but has been offset by a drop in the unemployment rate to 5.1%. Given the market response, it believes this report is good enough to usher in an interest rate hike later in the month….and crude is heading lower.

Elsewhere in the world today, Russia’s Energy Minister has said that Russia and Venezuela have agreed to continue talks between OPEC and non-OPEC oil producers to try to come up with initiatives to stabilize oil prices. He did add, however, that the two countries are not necessarily pushing for a coordinated cut to support prices – because ‘no producing country is willing to reduce its output‘.

Saudi Arabia’s King Salman is set to meet President Obama at the White House today, and the below image highlights how far the US has come in terms of oil independence in the last decade or so. Back in 2003, the US relied on Saudi for 1.7 million barrels a day of imports, while pulling in 7.3mn bpd from other countries:

Related: Venezuela Delaying The Inevitable With $5 Billion From China

Fast forward 12 years and domestic production has risen by nearly 70% (h/t shale revolution), while both Saudi imports and imports on the whole continue to be marginalized:

From our #ClipperData, we can see imports from Saudi have held below 1mn bpd in recent months (EIA data above is lagged). Volumes have averaged 923,000 bpd in the first eight months of the year, highlighting that EIA data in the coming months will show Saudi volumes are still dropping:


…click on the above link to read the rest of the article…

EIA On Board With Lifting U.S. Crude Export Ban

EIA On Board With Lifting U.S. Crude Export Ban

A new report from the Energy Information Administration adds more weight to the notion that crude oil exports from the U.S. would not damage the economy.

The EIA studied the prospect of oil exports in response to questions from Congress, and it builds on several prior reports completed by the agency over the past year and a half. The report is full of caveats and other drawbacks, but the headline takeaway could fuel political momentum to remove the export ban.

According to the results, the EIA believes that if U.S. oil production remains below 10.6 million barrels per day through the next decade, there would be few differences between leaving the export ban in place versus removing it. If production is set to rise beyond that level, however, removing export restrictions would have several effects: higher domestic oil production, higher crude exports, slightly lower gasoline prices, but also lower refined product exports.

Digging into the findings, the EIA says that if the export ban stays in place it would have the effect of maintaining the current discount at which WTI trades relative to the Brent crude marker. Moreover, if U.S. oil production increases, the spread between WTI and Brent would only widen, perhaps as high as $10 per barrel under one scenario. And that spread would increase in corresponding fashion the more U.S. oil production increases.

Related: Financial Sector To Cut Credit Supply Lines For Oil And Gas Industry

Of course, removing the export ban would shrink that spread, allowing for higher oil prices at the wellhead for American oil and gas drillers. That would incentivize more drilling, leading to higher oil output than would otherwise occur under the export ban.


…click on the above link to read the rest of the article…


US Oil Production Nears Previous Peak

US Oil Production Nears Previous Peak

Consumption

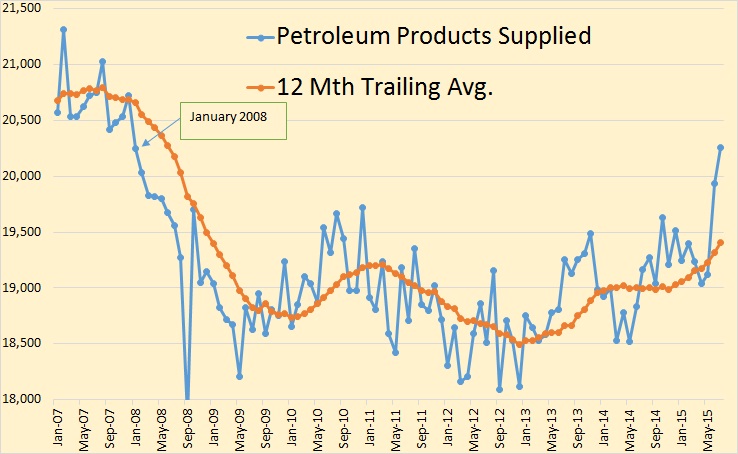
US consumption of total liquids, or as the EIA calls it, petroleum products supplied, reached 20,000,000 barrels per day for the first time since February of 2008.

Something I never noticed before, consumption started to drop in January 2008, seven months before the price, along with world production, started to drop in August 2008. This had to be a price driven decline. Could the current June and July increase in consumption be price driven also?

US Recent

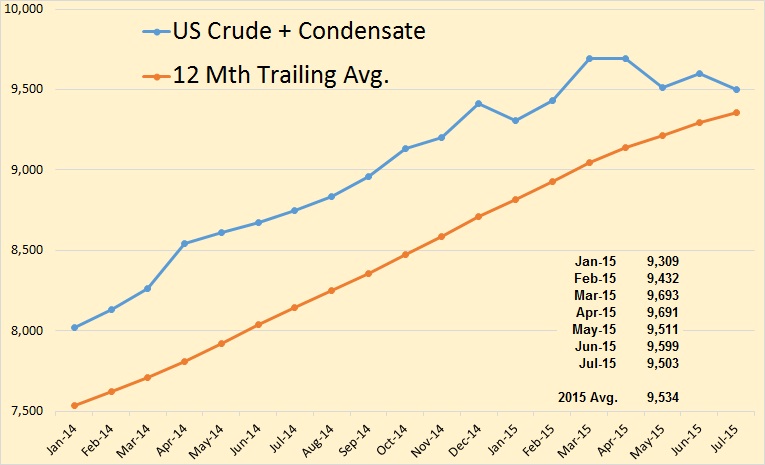
US Production was down 96,000 barrels per day in July to 9,503,000 bpd. That is 190,000 bpd below the March level of 9,693,000 bpd.

US Crude Oil Production

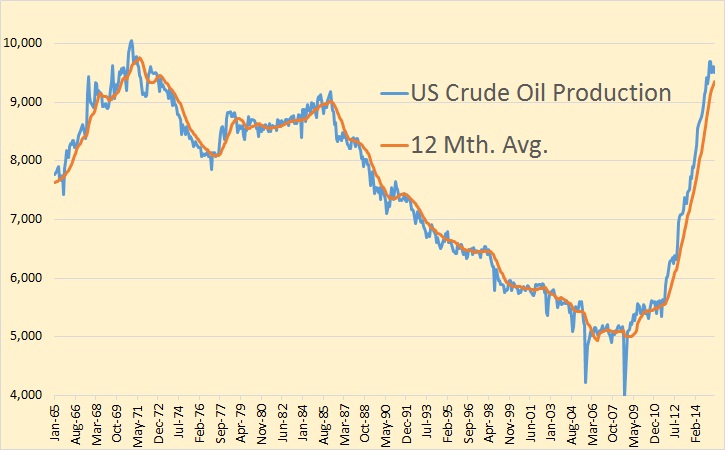
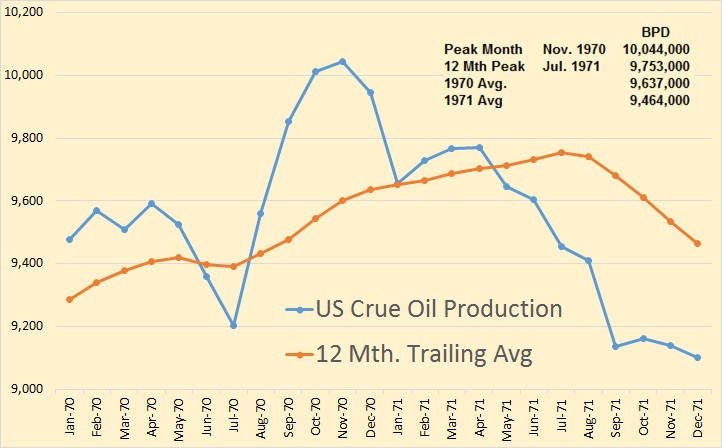
Here is what the last 50 years of US production looks like. The peak was in 1970 or 1971, depending on what you call the peak.

US 70 - 71

In March 2015 we were still 351,000 barrels per day below the peak month of 10,044,000 bpd in November of 1970. But right now we are headed in the wrong way to break that record. In July we were 541,000 bpd from that record. Right now the 2015 average, January through July, is 9,534,000 bpd. That is 103,000 barrels per day below the 1970 average. But the 2015 average is likely to get smaller as the year plays out.

I have another chapter from Peter Goodchild’s Tumbling Tide: Population, Petroleum, and Systemic CollapseI really like this book. The author comes closest to matching my sentiments than anyone I have read to date.

Tumbling Tide Chapter 10

The Pollyanna Principle

The problem of explaining peak oil does not hinge on the issue of peak oil as such, but rather on that of “alternative energy.” Most people now have some idea of the concept of peak oil, but it tends to be brushed aside in conversation because of the common incantation: “It doesn’t matter if oil runs out, because by then everything will be converted to [whatever] power.” Humanity’s faith in what might be called the Pollyanna Principle—the belief that everything will work out right in the end—is eternal.


…click on the above link to read the rest of the article…


Did The Fed Intentionally Spark A Commodity Sell-off?

Did The Fed Intentionally Spark A Commodity Sell-off?

The intention here is the bring facts to light so the public can decide.

I’m not quite sure what to believe on how and why oil prices remain more than 50 percent below free cash flow break even for most independent E&P companies. I know for sure it’s not just one reason and is more likely a confluence of events.

Part of the reason oil prices broke new six-year lows is tied to hedge funds shorting equities and pressuring equity pricing through shorting oil. Another reason is the desire of private equity firms to buy assets on cheap and some banks seeking M&A fees. Obviously OPEC policy has a part to play. There is also no doubt that EIA statistics mistakenly leave the impression that production has remained resilient throughout the summer. But the spark that set the ball in motion was the dollar strength as every major money center bank in the U.S. recommended going long EU equities and long the dollar because of further monetary easing in Europe.

Related: How To Profit From Crashing Oil Markets

The inverse correlation between the U.S. dollar and oil prices in June was virtually 100 percent, but that has changed more recently, as I have noted previously. At that time, investors here in the U.S. plowed into biotechnology and technology and went short oil as if they knew what assets central banks were going to buy and not buy based on all the free money from Europe and Japan.

Since the financial crisis began the cozy relationship between money center banks and the Federal Reserve, since the bail outs, is well known. For example, Goldman Sachs’ deep ties to the U.S. government are notorious and, not surprisingly, they led the charge in calls for a downturn in oil. So has the media, as I have extensively documented all year here.


…click on the above link to read the rest of the article…

Jean Laherrere’s Bakken Update

Jean Laherrere’s Bakken Update

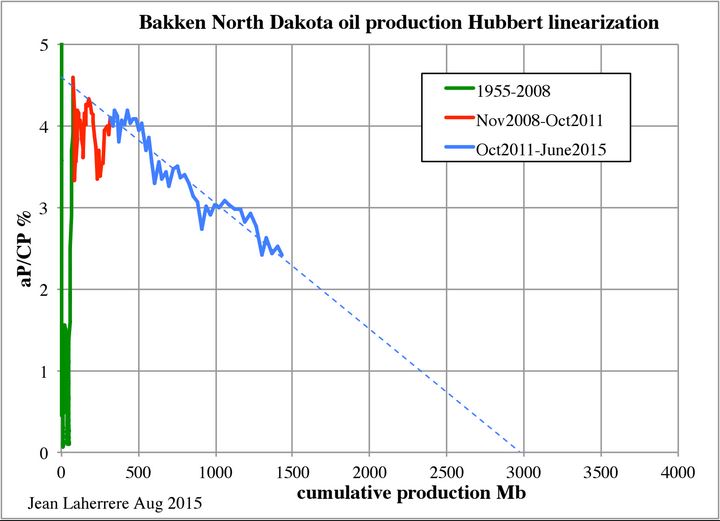
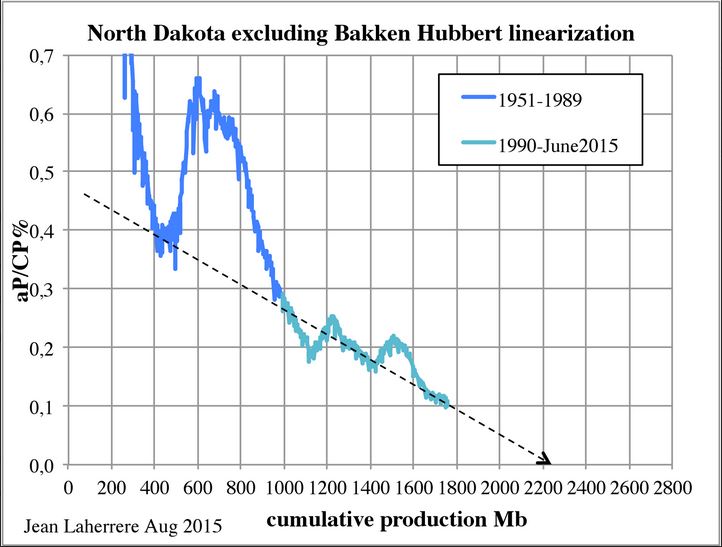
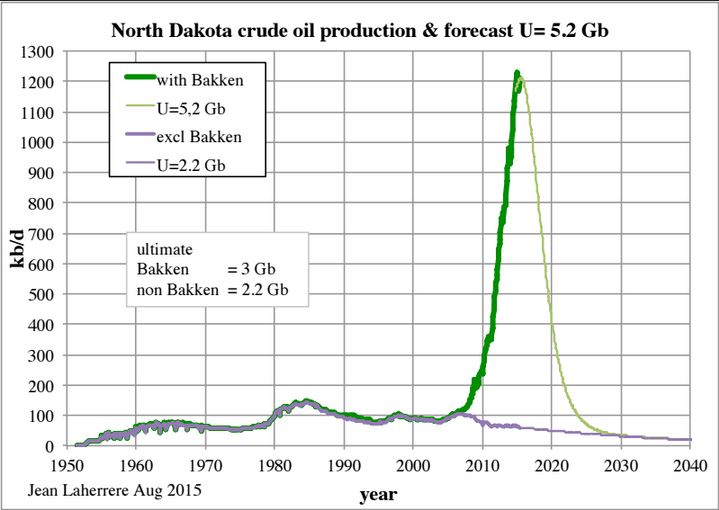
Jean Laherrere sent me the below charts the other day. I had planned on posting them with more Bakken data. But my schedule has been busy so I am posting them alone.

Jean’s interpretation for ND is as follows
Bakken ultimate = 3 Gb
Non Bakken ultimate = 2.2 Gb
ND ultimate 5.2 Gb
Detail
Quite symmetrical like the EIA drilling productivity data, but in contrary to EIA/AEO2015 with a peak in 2020
It will be interesting to see the evolution in the next few months

Jean 1

The Hubbert Linearization puts the Bakken about half way to the end.

Jean 2

The rest of North Dakota, less the Bakken, is just about finished.

Jean 3

With this chart Jean puts North Dakota production right at the peak.

…click on the above link to read the rest of the article…


Oil storage tanks filled to levels not seen in 80 years

Oil storage tanks filled to levels not seen in 80 years

U.S. oil inventories at levels not seen in at least 80 years

North American oil prices could take a hit this fall as there are renewed concerns about a lack of storage capacity.

A recent report by the U.S. Energy Information Agency suggests crude oil inventories “remain near levels not seen for this time of year in at least the last 80 years.”

The concern is what will happen this fall and whether oil supplies will hit “tank top.” North American refineries are running at near capacity this summer, buying up oil and converting it to gasoline and other products. Several refineries will shut down in a few months for maintenance and there could be more unplanned outages because refineries are operating at such a high level.

Each fall, it’s typical for inventories to begin to build, but “the problem is we are at a much higher starting point,” said Jackie Forrest, a vice-president with ARC Financial, who monitors trends in the Canadian oil and gas industry. A lack of storage could impact North American oil prices and in particular West Texas Intermediate (WTI), the benchmark for the continent.

“It could cause a bit of a disconnect where WTI becomes a bit cheaper than global crudes, but I don’t think it is going to cause a serious problem where there is no room to store crude,” said Forrest.

CDN crude oil production

Canadian oil production is expected to rise over the next few decades.

The oilpatch had similar concerns in the spring. At that time, some companies began turning to ‘fracklog’ as one method of storing oil. Producers continue to drill wells, but stop just short of pumping out the oil. It’s a way of storing the oil in the ground. The goal is to hold on to the oil until prices rebound.

…click on the above link to read the rest of the article…


US Shale Declining and OPEC Still Climbing

US Shale Declining and OPEC Still Climbing

First the Drilling Productivity Report. Of course most of the Drilling Productivity Report is projection, not history. And that projection goes through September 2015.

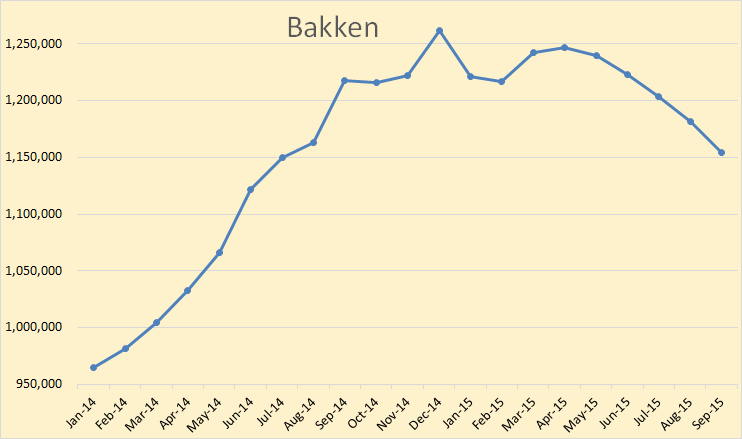
Bakken

The EIA has the Bakken peaking in December and declining 107 thousand barrels per day since that point. A secondary peak was reached in April and declining steadily since then.

Eagle Ford

The EIA has Eagle Ford peaking in March and declining 226 thousand barrels per day since that point.

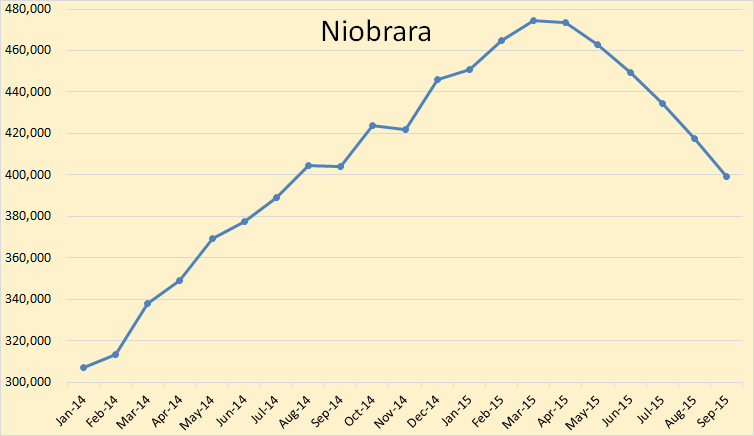
Niobrara

The EIA has Niobrara peaking in March, almost flat for one month then declining sharply after that for a total decline of 75 thousand barrels per day after that.

The Permian was the only major shale area with no decline so far. The EIA has the Permian up 29 thousand barrels per day since the rest of the field, combined, peaked in April.

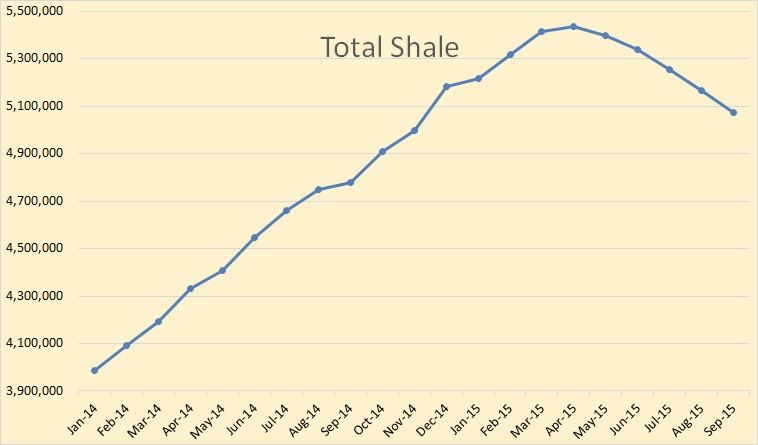
Total Shale

The EIA has total shale peaking in April at 5,434000 bpd and declining by 360 thousand barrels per day by September to 5,074000 bpd. 360,000 barrels per day is quite a decline by September.


…click on the above link to read the rest of the article…

Lifting Ban On U.S. Crude Oil Export Would Enable Massive Fracking Expansion

In a recent Washington Post editorial supporting oil industry efforts to lift the existing ban on exporting crude oil produced in America, the editors stated:

The most serious objection to lifting the ban comes from environmentalists who worry that it would lower fossil fuel prices and lead to more oil consumption.”

And then they make the case that this is actually a positive as there may be some negotiations that result in support for “energy research funding, efficiency programs or, in an ideal world, a charge on carbon dioxide emissions to the package could balance its possible effects on the environment.”

In an ideal world, the climate wouldn’t be changing either. But we don’t live in an ideal world, do we? And the oil industry usually gets what it wants and environmental concerns go by the wayside regardless of who is in the White House. See arctic drilling permits for recent proof.

Existing Export Ban Limits Ability of Fracking Industry to Expand

The reality is that lifting the oil export ban will result in large increases in fracking for oil in the U.S.

At the annual Energy Information Administration conference in Washington, D.C. in June, Harold Hamm, CEO of fracking giant Continental Resources, presented a slide that predicted oil production could reach 20 million barrels per day by 2025 if the crude export ban is repealed.


That is a massive increase over the existing amount of oil produced by fracking (aka “tight oil”) in the U.S. Tight oil current accounts for approximately half of the 9 million barrels a day of oil produced in the U.S. To get to Hamm’s predicted production levels that means a doubling or tripling of the scale of the current tight oil fracking industry.


…click on the above link to read the rest of the article…

Shale Gas Reality Check

Shale Gas Reality Check

shale-gas-reality-check-blog-top

In October 2014, Post Carbon Institute published the results of what likely remains the most thorough independent analysis of U.S. shale gas and tight oil production ever conducted. The process of drilling for shale gas and tight oil is known colloquially as “fracking” and has drawn a great deal of controversy—considered by some as an energy revolution and others as an environmental and human health catastrophe.

Much of the cost-benefit debate over fracking has come down to the perception of just how much domestic oil and gas it can produce and at what cost. To answer this question, policymakers, the media, and the general public have typically turned to the U.S. Department of Energy’s Energy Information Administration (EIA), which every year publishes its Annual Energy Outlook (AEO).

In Drilling Deeper, PCI Fellow David Hughes took a hard look at the EIA’s AEO2014 and found that its projections for future production and prices suffered from a worrisome level of optimism. This lead us and others to raise important questions about the wisdom of some energy policies and infrastructure projects (for example, the approval of Liquified Natural Gas export terminals and the lifting of the crude oil export ban) that have been pursued largely on the basis of the EIA’s rosy forecasts.

Recently, the EIA released its Annual Energy Outlook 2015 and so we asked David Hughes to see how the EIA’s projections and assumptions have changed over the last year, and to assess the AEO2015 against both Drilling Deeperand up-to-date production data from key shale gas and tight oil plays. What follows are Hughes’s findings regarding shale gas. The AEO2015’s tight oil projections will be reviewed in early September 2015.

…click on the above link to read the rest of the article…


This Is Why A Serious Decline In U.S Shale Plays Is Not Far Away

This Is Why A Serious Decline In U.S Shale Plays Is Not Far Away

The plunge in oil prices last year led many to say that a decline in U.S. oil production wouldn’t be far behind. This was because almost all the growth in U.S. production in recent years had come from high-cost tight oil deposits which could not be profitable at these new lower oil prices. These wells were also known to have production declines that averaged 40 percent per year. Overall U.S. production, however, confounded the conventional logic and continued to rise–until early June when it stalled and then dropped slightly.

Anyone who understood that U.S. drillers in shale plays had large inventories of drilled, but not yet completed wells, knew that production would probably rise for some time into 2015–even as the number of rigs operating plummeted.

Shale drillers who are in debt–and most of the independents are heavily in debt–simply must get some revenue out of wells already drilled to maintain interest payments. Some oil production even at these low prices is better than none. Only large international oil companies–who don’t have huge debt loads related to their tight oil wells–have the luxury of waiting for higher prices before completing those wells.

Related: The Four Noble Truths Of Energy Investing

The drop in overall U.S. oil production (defined as crude including lease condensate) is based on estimates made by the U.S. Energy Information Administration (EIA). Still months away are revised numbers based on more complete data. But, the EIA had already said that it expects U.S. production to decline in the second half of this year.

…click on the above link to read the rest of the article…


Olduvai IV: Courage
Click on image to read excerpts

Olduvai II: Exodus
Click on image to purchase

Click on image to purchase @ FriesenPress