Home » Posts tagged 'gdp' (Page 8)

Tag Archives: gdp

Olduvai
Click on image to purchase

Olduvai III: Catacylsm
Click on image to purchase

Post categories

Post Archives by Category

The Global Economy’s Wile E. Coyote Moment

The Global Economy’s Wile E. Coyote Moment

Economies and markets may already be plunging off a cliff.
Always behind.
Photographer: Justin Sullivan/Getty Images

Our prediction last year of a global growth downturn was based on our 20-Country Long Leading Index, which, in 2016, foresaw the synchronized global growth upturn that the consensus only started to recognize around the spring of 2017.

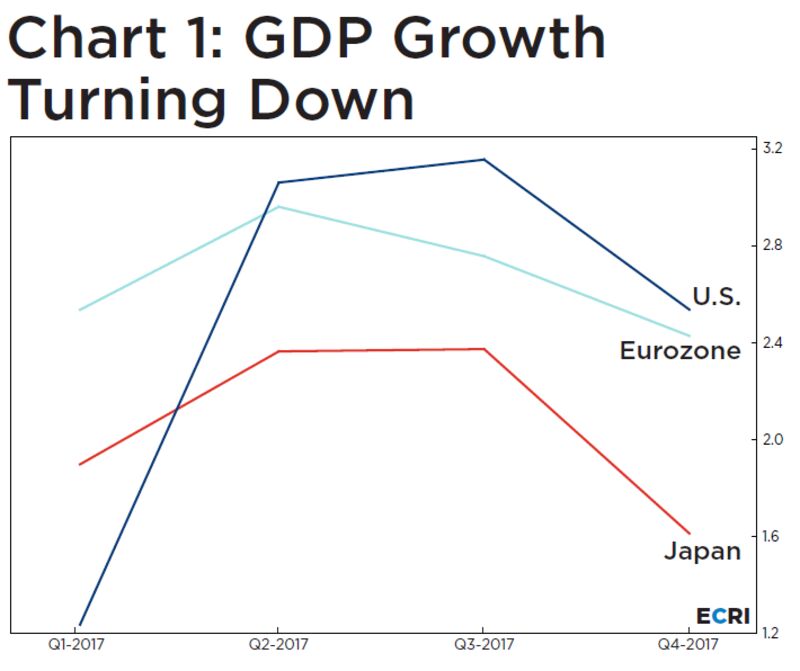
With the synchronized global growth upturn in the rearview mirror, the downturn is no longer a forecast, but is now a fact.

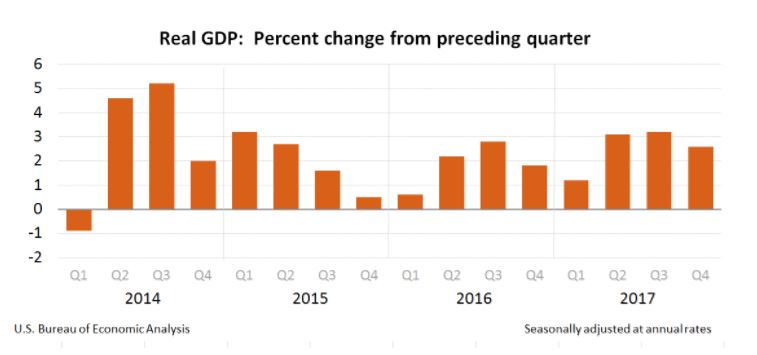
The chart below shows that quarter-over-quarter annualized gross domestic product growth rates in the three largest advanced economies — the U.S., the euro zone, and Japan — have turned down. In all three, GDP growth peaked in the second or third quarter of 2017, and fell in the fourth quarter. This is what the start of a synchronized global growth downswing looks like.

Still, the groupthink on the synchronized global growth upturn is so pervasive that nobody seemed to notice that South Korea’s GDP contracted in the fourth quarter of 2017, partly due to the biggest drop in its exports in 33 years. And that news came as the country was in the spotlight as host of the winter Olympics.

Because it’s so export-dependent, South Korea is often a canary in the coal mine of global growth. So, when the Asian nation experiences slower growth — let alone negative growth — it’s a yellow flag for the global economy.

The international slowdown is becoming increasingly obvious from the widely followed economic indicators. The most popular U.S. measures seem to present more of a mixed bag. Yet, as we pointed out late last year, the bond market, following the U.S. Short Leading Index, started sniffing out the U.S. slowdown months ago. Specifically, the quality spread — the difference between the yields on junk bonds and investment-grade corporate bonds — has been widening for several months.

…click on the above link to read the rest of the article…

An Inflation Indicator to Watch, Part 3

An Inflation Indicator to Watch, Part 3

“During the 1980s and 1990s, most industrial-country central banks were able to cage, if not entirely tame, the inflation dragon.”
—Ben Bernanke

Ben Bernanke began his oft-cited “helicopter speech” in 2002 with a few kind words about his peers, including the excerpt above. Speaking for central bankers, he took a large share of the credit for the low inflation of the 1980s and 1990s. Central bankers had gained a “heightened understanding” of inflation, he said, and he expected the future to bring even more inflation-taming success.

Of course, Bernanke’s cohorts took a few knocks in the boom–bust cycle that followed his speech, but their reputations as masters of inflation (and deflation) only grew. Today, the picture he painted seems even more firmly planted in the public mind than it was in 2002, notwithstanding recent data showing inflation creeping higher.

Public perceptions aren’t always accurate, though, and public figures aren’t the most reliable arbiters of credit and blame. In this 3-part article, I’m proposing a theory that challenges Bernanke’s narrative, and I’ll back the theory with data in Part 3. I’ll show that it leads to an inflation indicator with an excellent historical record.

But first, let’s recap a few points I’ve already discussed.

The Endless Tug-of-War

In Part 2, I said inflation depends on a tug-of-war between purchasing power (on the demand side) and capacity (on the supply side), and the war takes place within the circular flow, in which spending flows into income and income flows back to spending. Two circular-flow patterns and their causes demand particular attention:

  1. When banks inject money into the circular flow in the process of making loans, they can boost spending above the prior period’s income, thereby fattening the flow (or the opposite in the case of a deleveraging).

…click on the above link to read the rest of the article…

Broken Promises

Demanding More Debt

Consumer debt, corporate debt, and government debt are all going up.  But that’s not all.  Margin debt – debt that investors borrow against their portfolio to buy more stocks – has hit a record of $642.8 billion.  What in the world are people thinking?

A blow-off in margin debt mirroring the blow-off in stock prices. Since February of 2016 alone it has soared by ~$170 billion – this is an entirely new level insanity. The current total of 643 billion is more than double the level of margin debt at the tech mania peak and 15.4 times the amount of margin debt just before the crash of 1987. [PT]

Clearly, they’re not thinking.  Because thinking takes work.  Most people don’t like to work.  They like to pretend to work.

Similarly, people may say they care about debt.  But, based on their actions, they really don’t.  When it comes to the national debt, the overarching philosophy is that it doesn’t matter. Government debt certainly doesn’t matter to Congress.  Nor does it matter to the President.  In fact, their actions demonstrate they want more of it.

Big corporations with big government contracts want more government debt too. Their businesses demand it. They’ve staked their success on the expectation that the debt slop will continue flowing down the trough where they consume it like rapacious pigs.

The higher education bubble is also based on a faulty foundation of debt. The business model generally requires signing credulous 18 year-olds up for massive amounts of government backed student loans. From what we gather, federal student loan debt is closing in on $1.4 trillion.


Total student loans outstanding (red line – the data are only available from 2007 onward) and total federal government-owned student loans (black line). The former figure was closing in on $1.5 trillion as of Q4 2017. [PT]

…click on the above link to read the rest of the article…

The Status Quo Will Reign

This month’s stock market correction is still fresh in everyone’s mind. Many have even begun to wonder if the era of dark money was truly over.

How will the recent correction affect the Fed’s dark money policies?

The consensus explanation for the correction was that inflation was rising and that would precipitate faster rate increases. The Feb. 2 unemployment report gave the impression that higher worker wages could lead to a higher inflationary trend.

I don’t buy this at all. I believe these fears of inflation are overblown.

As my colleague Jim Rickards has explained, the Feb. 2 report revealed that total weekly wages were actually declining and that labor force participation was unchanged. And the year-over-year gain in wages only seemed impressive compared with the extremely weak wage growth of recent years.

After accounting for existing inflation, Jim argued, the real gain was only 0.9%. That’s weak relative to the 3% or even 4% real wage gains typically associated with economic expansions since the end of World War II.

In short, Jim concludes, “the story about the “hot” economy with inflation right around the corner does not hold water.”

I agree.

Meanwhile, the latest report on U.S Gross Domestic Product (GDP) for the fourth quarter of 2017 was nothing to write home about. At 2.6% annual growth, it was 0.3% lower than expectations. That’s not the sign of an overheating economy. But those in the financial media considered it positive because it showed 2.80% growth in real personal consumption.

But if you look beneath the surface, what you’d see is that consumers aren’t actually doing well across three core areas that “govern the ability of individuals to spend.”

…click on the above link to read the rest of the article…

An Inflation Indicator to Watch, Part 1

An Inflation Indicator to Watch, Part 1

“Inflation is always and everywhere a monetary phenomenon.”
—Milton Friedman

Have you ever questioned Milton Friedman’s famous claim about inflation?

Ever heard anyone else question it?

Unless you read obscure stuff written for the academic community, you’re probably not used to Friedman’s quote being challenged. And that’s despite a lousy forecasting record by economists who bought into his Monetarist methods.

Consider the following:

  • When Friedman’s strict Monetarism fizzled in the 1980s, it was doomed partly by his own forecasts. Instead of the disinflation the decade delivered, he expected inflation to reach 1970s levels, publicizingthat prediction in 1983 and then again in 1984, 1985 and 1986. Of course, years earlier he foresaw the 1970s jump in inflation, but the errant forecasts that came later left him wide open to a “clock twice a day” dismissal.
  • Monetarists suffered an even harsher blow in 2012, when the Conference Board finally threw in the towel on Friedman’s favorite indicator, removing M2 from its Leading Economic Index (LEI). Generally speaking, forecasters who put M2 in their models are like bachelors who put “live with mom” in their dating profiles—they haven’t been successful.
  • The many economists who expected quantitative easing (QE) to wreak havoc on inflation are, of course, on the defensive. Nine years after QE began, core inflation remains below the Fed’s 2% target, defying their Monetarist beliefs.

When it comes to explaining inflation, Monetarism hasn’t exactly nailed it. Then again, neither has Keynesianism, whose Phillips Curve confounds those who rely on it. You can toss inflation onto the bonfire of major events that mainstream theories fail to explain.

But I’ll argue there might be a better way.

…click on the above link to read the rest of the article…
U.S. Public Debt Surges By $175 Billion In One Day

U.S. Public Debt Surges By $175 Billion In One Day

After the U.S. Government passed the new budget and debt increase, with the President’s signature and blessing, happy days are here again.  Or are they?  As long as the U.S. Government can add debt, then the Global Financial and Economic Ponzi Scheme can continue a bit longer.  However, the days of adding one Dollar of debt to increase the GDP by two-three Dollars are gone forever.  Now, we are adding three-four Dollars of debt to create an additional Dollar in GDP.  This monetary hocus-pocus isn’t sustainable.

Well, it didn’t take long for the U.S. Government to increase the total debt once the debt ceiling limit was lifted.  As we can see in the table below from the treasurydirect.gov site, the U.S. public debt increased by a whopping $175 billion in just one day:

I gather it’s true that Americans like to do everything… BIG.  In the highlighted yellow part of the table, it shows that the total U.S. public debt outstanding increased from $20.49 trillion on Feb 8th to $20.69 trillion on Feb 9th.  Again, that was a cool $175 billion increase in one day.  Not bad.  If the U.S. Government took that $175 billion and purchased the average median home price of roughly $250,000, they could have purchased nearly three-quarter of a million homes.  Yes, in just one day.  The actual figure would be 700,000 homes.

Regardless, we are now off to the races when it comes to adding GOBS of DEBT to continue a Ponzi Scheme that would make Bernie Madoff jealous.

There is so much that I want to write about and put into videos, but there is only so much time in the day.

…click on the above link to read the rest of the article…

Global Debt Crisis II Cometh

Global Debt Crisis II Cometh

– Global debt ‘area of weakness’ and could ‘induce financial panic’ – King warns
– Global debt to GDP now 40 per cent higher than it was a decade ago – BIS warn
– Global non-financial corporate debt grew by 15% to 96% of GDP in the past six years

– US mortgage rates hit highest level since May 2014

– US student loans near $1.4 trillion, 40% expected to default in next 5 years
– UK consumer debt hit £200b, highest level in 30 years, 25% of households behind on repayments

The ducks are beginning to line up for yet another global debt crisis. US mortgage rates are hinting at another crash, student debt crises loom in both the US and UK, consumer and corporate debt is at record levels and global debt to GDP ratio is higher than it was during the financial crisis.

When you look at the figures you realise there is an air of inevitability of what is around the corner. If the last week has taught us anything, it is that markets are unprepared for the fallout that is destined to come after a decade of easy monetary policies.

Global debt is more than three times the size of the global economy, the highest it has ever been. This is primarily made up of three groups: non financial corporates, governments and households. Each similarly indebted as one another. Debt is something that has sadly run the world for a very long time, often without problems. But when that debt becomes excessive it is unmanageable. The terms change and repayments can no longer be met.

This sends financial markets into a spiral. The house of cards is collapsing and suddenly it is revealed that life isn’t so hunky-day after all. Rates are set to rise and as they do they will spark more financial shocks, as we have seen this week.

…click on the above link to read the rest of the article…


Conflict between Fiscal & Monetary Policy

We are moving into a crisis of monumental proportions. There has been a serious fundamental problem infecting economic policy on a global scale. This conflict has been between monetary and fiscal policy. While central banks engaged in Quantitative Easing, governments have done nothing but reap the benefits of low-interest rates. This is the problem we have with career politicians who people vote for because they are a woman, black, or smile nicely. There is never any emphasis upon qualification. Every other job in life you must be qualified to get it. Would you put someone in charge of a hospital with life and death decisions because they smile nicely?

Economic growth has been declining year-over-year and we are in the middle of a situation involving low-productivity expansion with high and rapidly rising budget deficits that benefit nobody but government employees.  Once upon a time, 8% growth was average, then 6%, and 4% before 2015.75. Now 3% is considered to be fantastic. Private debt at least must be backed by something whereas escalating public debt is completely unsecured. The ECB wanted to increase the criteria for bad loans, yet if those same criteria were applied to government, nobody would lend them a dime.

Monetary policy, after too long a phase of low-interest rates and quantitative easing, has created governments addicted to low-interest rates. They have expanded their spending and deficits for the central banks were simply keeping the government on life-support – not actually stimulating the private sector. Governments have pursued higher taxes and more efficient tax collection. They have attacked the global economy assuming anyone doing business offshore was just an excuse to hide taxes.

…click on the above link to read the rest of the article…
The Liquidity Punch Bowl

THE LIQUIDITY PUNCH BOWL

It is appropriate with the inauguration of this weekly column to look at the “Big Picture”. The biggest risk to world stock markets, and asset prices in general, in 2018 is that G7 central banks (led by the Federal Reserve) are finally attempting to normalise monetary policy nine years after the American central bank commenced quantitative easing in December 2008, in the midst of the so-called “global financial crisis”.

Since late 2008, G7 central banks, comprising the Fed, the Bank of Japan, the European Central Bank and the Bank of England, have committed to massive balance sheet expansion (through the purchase of mortgage and government debt). Their balance sheets continued to rise in aggregate during 2017 even though the Fed itself stopped expanding its own balance sheet in November 2014. Aggregate assets of G7 central banks increased by 17.2% last year to $15.2tn at the end of 2017, up from US$4.3tn at the beginning of 2008 (see following chart).

Sources: Bloomberg, Federal Reserve, Bank of England, ECB, Bank of Japan, CEIC Data, CLSA

That the Fed has commenced balance sheet reduction from last October is a risk for stock markets since it amounts to another form of monetary tightening, in addition to interest rate hikes. That it has not yet caused market fallout reflects two factors:

  1. The Fed is beginning extremely tentatively by decreasing its reinvestment of principal payments from maturing bonds.
  2. Other G7 central banks are still expanding in aggregate, albeit at a slower pace. This is why there will be much focus on what the European Central Bank will do in coming months. For now, it looks like G7 central bank balance sheets will start to contract in aggregate in 2019 rather than 2018. 

…click on the above link to read the rest of the article…

Message from Planet Japan: The good times never last forever

Message from Planet Japan: The good times never last forever

After having traveled to more than 120 countries in my life, the only person I know who’s been to more places than I have is Jim Rogers.

Jim is a legend– a phenomenal investor, author, and all-around great guy.

(His book Adventure Capitalist is a must-read, chronicling his multi-year driving voyage across the world.)

Some time ago while we were having drinks, Jim remarked that he occasionally tells people, “If you can only travel to one foreign country in your life, go to India.”

In Jim’s view, India presents the greatest diversity of experiences– mega-cities, Himalayan villages, coastal paradises, and a deeply rich culture.

My answer is different: Japan.

To me, Japan isn’t even a country. Japan is its own planet… completely different than anywhere else in ways that are incomprehensible to most westerners.

(Watch my friend Derek Sivers explain it to a TED audience here.)

On one hand, this is a culture that strives to attain beauty and mastery in even mundane tasks like raking the yard or pouring tea.

Everything they do is expected to be conducted to the highest possible standard and precision.

They start the indoctrination from birth; Japanese schools typically do not employ janitors and instead train children to clean up after themselves.

Later in life, the Japanese salaryman is expected to practically work himself to death (or suicide) for his company.

Obedience and collectivism are core cultural values, and the tenets of Bushido are still prevalent to this day.

One of the most remarkable examples of Japanese culture was the aftermath of the devastating 2011 earthquake (and subsequent tsunami) in the Fukushima prefecture.

…click on the above link to read the rest of the article…

Flying Blind, Part 2: The Destruction Of Honest Price Discovery And Its Consequences

Flying Blind, Part 2: The Destruction Of Honest Price Discovery And Its Consequences

In Part 1 we noted that the real evil of Bubble Finance is not merely that it leads to bubble crashes, of which there is surely a doozy just around the bend; or that speculators get the painful deserts they fully deserve, which is coming big time, too; or even that the retail homegamers are always drawn into the slaughter at the very end, as is playing out in spades once again. Daily.

Given enough time, in fact, markets do bounce back because capitalism has a inherent urge to grow, thereby generating higher output, incomes, profits, wealth and stock indices. That means, in turn, investors eventually do recover from bubble crashes—notwithstanding the tendency of homegamers and professional speculators alike to sell at panic lows and jump back in after most of the profits have been made—or even at panic highs like the present.

Instead, the real economic iniquity of central bank driven Bubble Finance is that it destroys all the pricing signals that are essential to financial discipline on both ends of the Acela Corridor. And as quaint at it may sound, discipline is the sine qua non of long-term stability and sustainable gains in productivity, living standards and real wealth.

The pols of the Imperial City should be petrified, therefore, by the prospect of borrowing $1.2 trillion during the upcoming fiscal year (FY 2019) at a rate of 6.o% of GDP during month #111 through month #123 of the business expansion; and doing so at the very time the central bank is pivoting to an unprecedented spell of QT (quantitative tightening), involving the disgorgement of up to $2 trillion of its elephantine balance sheet back into the bond market.

Even as a matter of economics 101, the forthcoming $1.8 trillion of combined bond supply from the sales of the US Treasury ($1.2 trillion) and the QT-disgorgement of the Fed ($600 billion) is self-evidently enough to monkey-hammer the existing supply/demand balances, and thereby send yields soaring.

…click on the above link to read the rest of the article…
Measuring The Equity Bubble – “You Are Here”

On best revisions for GDP and earnings in 2018 after Tax reform, the S&P is now less expensive than before, at just 57% above historical average…

https://www.zerohedge.com/sites/default/files/inline-images/20180118_PEG1.jpg

In this brief note, we wanted to update our value indicator for the S&P, after the steep consensus upgrades to US earnings and US GDP that followed the US tax reform.

We assess how big of an improvement should we see after the reform, assuming a GDP growth of 3.40% in 2018, which is the average of the 10 highest analysts’ forecasts surveyed by Bloomberg, and assuming a 26% jump in earnings in 2018, again at the top end of surveys. We conclude that, against such most generous estimates, the ‘Peak PEG’ ratio for the S&P improved by almost 10%, or, rephrased, it is almost 10% off peak.

It follows that the S&P is now above historical averages by a mere 57%.

The Peak PEG ratio, using Peak Earnings and Trend Growth

The ‘Peak PEG’ ratio is a variation of the Shiller P/E and the Hussman P/E indicators. It measures the price-earnings to growth ratio (PEG ratio) not for a single stock but for the market as a whole. The ‘Peak PEG ratio’ is a price to peak-earnings multiple, adjusted for long-run trend growth. It considers the highest (rather than average) earnings over the previous 10 years (top 2 quarters on the last 40) and then divides for growth potential. It uses top earnings so to conservatively assume the best profit generation capability for stocks in a decade to persist, thus defusing a common critic to the Shiller P/E. It uses GDP trend growth so to proxy earnings growth potential, which is highly correlated to it over time.

…click on the above link to read the rest of the article…
Loonie Tumbles After Dovish Bank of Canada Hikes By 25bps, Warns Of NAFTA Uncertainty

As expected by a broad majority of economists, the Bank of Canada just hiked its overnight rate by 25bps to 1.25%, the first hike by a G-7 central bank in 2018.

In raising the rate, the BoC said that “recent data have been strong, inflation is close to target, and the economy is operating roughly at capacity” however in a dovish twist the BOC added that “as uncertainty about the future of NAFTA is weighing increasingly on the outlook, the Bank has incorporated into its projection additional negative judgement on business investment and trade.

From the bank’s forecasts:

In Canada, real GDP growth is expected to slow to 2.2 per cent in 2018 and 1.6 per cent in 2019, following an estimated 3.0 per cent in 2017. Growth is expected to remain above potential through the first quarter of 2018 and then slow to a rate close to potential for the rest of the projection horizon.

The central bank also sees the following key indicators:

CPI Inflation Y/Y:

  • 2017 Q2:1.3%, last 1.3%
  • 2017 Q3:1.4%, last 1.4%
  • 2017 Q4:1.8%, last 1.4%
  • 2018 Q1:1.7%

Real GDP Y/Y:

  • 2017 Q2:3.6%, last 3.7%
  • 2017 Q3:3.0%, last 3.1%
  • 2017 Q4:3.0%, last 3.1%
  • 2018 Q1:2.7%

However, what appears to have spooked traders is the general dovish context of the statement:

Looking forward, consumption and residential investment are expected to contribute less to growth, given higher interest rates and new mortgage guidelines, while business investment and exports are expected to contribute more. The Bank’s outlook takes into account a small benefit to Canada’s economy from stronger US demand arising from recent tax changes. However, as uncertainty about the future of NAFTA is weighing increasingly on the outlook, the Bank has incorporated into its projection additional negative judgement on business investment and trade.

As a result of the unexpected dovish addition, while the loonie initially kneejerked higher, it has since given up all gains and is now near the lows of the day.

…click on the above link to read the rest of the article…

What Has QE Wrought?

What Has QE Wrought?

bubbles_1.PNG

[Editor’s Note: Watch Ron Paul deliver this Special Report here.​]

The Great Recession began in 2007. It didn’t take long for the money managers to recognize its severity, and that a little tinkering with interest rates would not suffice in dealing with the economic downturn. In Dec. 2008, the first of four Quantitative Easing programs began which did not end until Dec. 18, 2013. Some very serious consequences of this policy of unprecedented credit creation have set the stage for a major monetary reform of the fiat dollar system. The dollar’s status as the reserve currency of the world will continue to be undermined. This is not a minor matter. As our financial system unravels, the seriousness of it will become evident to all, as the need to pay for our extravagance becomes obvious. This will make the country much poorer, though the elite class that manages such affairs will suffer the least.

By the time the QE’s ended, the Central banks of the world had increased their balance sheet by $8.3 trillion, with only $2.1 trillion worth of GDP growth to show for it. This left $6.2 trillion of excess liquidity in the banking system that did not go where the economic planners had hoped. Central banks now own $9.7 trillion of negative interest yielding bonds. The financial system has been left with a bubble mania, financed by artificial credit and unsustainable debt. The national debt in 2007 was $8.9 trillion; today it’s $20.5 trillion. Rising interest rates will come and that will be deadly for the economy and the Federal budget.

This inflationary policy is generated by the belief that there is no benefit in allowing the needed economic correction to the problems generated by the Fed to occur. The correction is what the market requires, not the resumption and acceleration of the dangerous inflationary policy that caused the bubble economy.

…click on the above link to read the rest of the article…

Will the World Economy Continue to “Roll Along” in 2018?

Will the World Economy Continue to “Roll Along” in 2018?

Once upon a time, we worried about oil and other energy. Now, a song from 1930 seems to be appropriate:

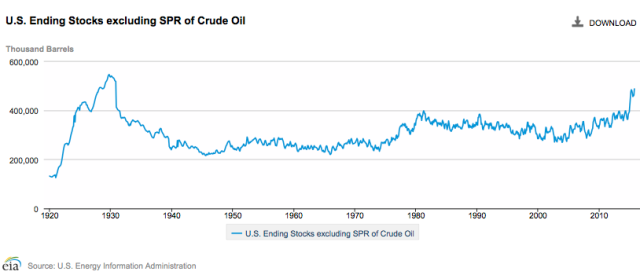
Today, we have a surplus of oil, which we are trying to use up. That never happened before, or did it? Well, actually, it did, back around 1930. As most of us remember, that was not a pleasant time. It was during the Great Depression.

Figure 1. US ending stocks of crude oil, excluding the Strategic Petroleum Reserve. Amounts will include crude oil in pipelines and in “tank farms,” awaiting processing. Businesses normally do not hold more crude oil than they need in the immediate future, because holding this excess inventory has a cost involved. Figure produced by EIA. Amounts through early 2016.

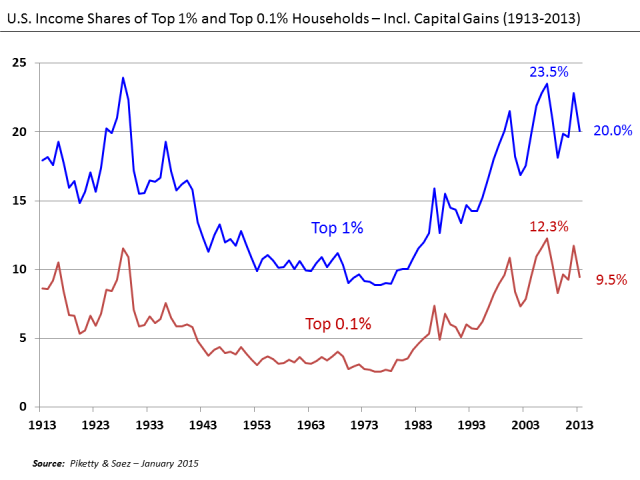
A surplus of a major energy commodity is a sign of economic illness; the economy is not balancing itself correctly. Energy supplies are available for use, but the economy is not adequately utilizing them. It is a sign that something is seriously wrong in the economy–perhaps too much wage disparity.

Figure 3. U. S. Income Shares of Top 10% and Top 1%, Wikipedia exhibit by Piketty and Saez.

If wages are relatively equal, it is possible for even the poorest citizens of the economy to be able to buy necessary goods and services. Things like food, homes, and transportation become affordable by all. It is easy for “Demand” and “Supply” to balance out, because a very large share of the population has wages that are adequate to buy the goods and services created by the economy.

…click on the above link to read the rest of the article…

Olduvai IV: Courage
Click on image to read excerpts

Olduvai II: Exodus
Click on image to purchase

Click on image to purchase @ FriesenPress